Thickness Dependence of Spin-Orbit Torques in Ferrimagnetic GdFeCo Alloys
Abstract
So far, studies of spin-orbit torques (SOT) in ferromagnets with perpendicular magnetic anisotropy (PMA) have been restricted to ultra thin samples, while a systematic study of it’s thickness dependence is still lacking in literature. In this article we discuss the thickness dependence of SOT in GdFe90Co samples with bulk PMA. We show that the effective SOT fields are decreasing inversely as a function of thickness while the spin-Hall angle stays constant, as expected from angular momentum conservation. Further we show that even thick GdFe90Co samples can be switched with SOT. This has important technological implications as the switching efficiency does not depend on the thickness. Finally, we investigate the composition dependence of SOT in thick GdFeCo samples and find that the spin torque effective field diverges at the magnetization compensation point.
I Introduction
Commercial magnetic random access memory (MRAM) devices have been available on the market since 2006 Apalkov et al. (2016). Most of the MRAM devices sold today are either based on the toggle switching mechanism Engel et al. (2005) or spin transfer torque (STT) Rizzo et al. (2013). However, these technologies have significant drawbacks. While toggle switching is inherently unscalable, STT-MRAM faces reliability issues due to large currents through the tunnel barrier as well as slow switching times due to the precessional switching.
These challenges could be overcome with the introduction of 3-terminal memory devices utilizing spin-orbit torque (SOT) as a mechanism to write information and tunnel magneto-resistance as a mechanism to read Lee and Lee (2016). Here SOT refers to the generation of a non-equilibrium spin-accumulation at a heavy metal (HM)/ferromagnet (FM) interface, either due to the bulk spin-Hall effect in the HM Liu et al. (2012a, b) or the Rashba-Edelstein effect at the HM/FM interface Miron et al. (2011). This non-equilibrium spin-accumulation diffuses into the ferromagnet Haney et al. (2013), where it can reverse the magnetic order via the spin-transfer torque mechanism Berger (1996); Slonczewski (1996).
These 3-terminal memory devices require magnetic materials which exhibit perpendicular magnetic anisotropy (PMA). In most devices today, transition metal magnets, such as Co or Fe, with MgO capping layers are used Ikeda et al. (2010). Here, the PMA originates from hybridization effects at the ferromagnet/oxide interfaceYang et al. (2011). Due to the inherently interfacial nature of this anisotropy, the ferromagnetic films must be grown very thin (on the order of a ) and clean interfaces with the right oxygen stoichiometry are important.
More recently, SOT have been investigated in HM/ferrimagnet structures, where the ferrimagnets are transitions metal (TM)-rare earth (RE) alloys Zhao et al. (2015); Ueda et al. (2016); Roschewsky et al. (2016); Finley and Liu (2016). These materials exhibit bulk PMA. This has several technological advantages. For instance, interfaces can be altered without changing the magnetic properties drastically. Further, the magnetic properties in ferrimagnetic alloys can be tuned by changing the film composition. Finally, the ferrimagnetic film thickness can be used as a new design parameter for SOT devices. Due to the bulk nature of the PMA, ferrimagnetic films can be grown much thicker than ferromagnet/oxide structures discussed above.
So far however, a detailed study of the thickness dependence of SOT is still lacking in literature. While this has been attempted before in magnets with in-plane anisotropy Fan et al. (2014), studies in magnets with PMA remain challenging, either due to changes in anisotropy energy with thickness Lo Conte et al. (2016) or changes in the crystalline structure with thickness Lee et al. (2014). Therefore, all studies of SOT in films with PMA to date are limited to ultra thin magnetic films of just a few nanometers thickness.
In this study we investigate the thickness dependence of SOT in ferrimagnetic GdFe90Co films. We vary the thicknesses from up to and show that all films can be switched with current pulses through adjacent HM layers. To measure the effective magnetic field due to SOT, we perform harmonic Hall measurements. The effective field is found to be inversely proportional to the ferrimagnet film thickness and saturation magnetization. In addition DC transport measurements are performed. It is found that the critical switching current , as well as the thermal stability increase linearly with thickness, so that the switching efficiency is constant. This result has important implications for memory technology, as the film thickness can be tuned in order to archive desired values for the critical current and thermal stability.
II Sample Preparation
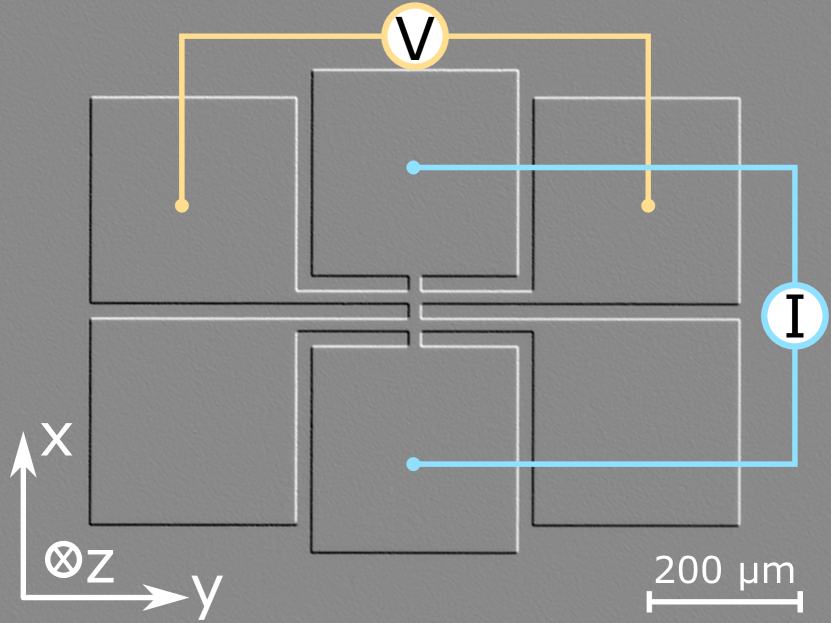
To investigate the thickness dependence of SOT in ferrimagnets we deposited a series of Ta/GdFe90Co/Pt films (thickness in ) on thermally oxidized silicon substrates by RF magnetron sputtering. The thickness was varied from to in steps of . The base pressure during deposition was below . After deposition, Hall bar mesa structures were defined by optical lithography and Ar-ion milling. Figure 1 shows an optical image of a typical Hall bar device and the measurement geometry. The width of the Hall bar is . A current is applied along the -direction to excite SOT dynamics. The response of the magnet is detected by the AHE, measured perpendicular to the current direction, along . Note that GdFe90Co is a transition metal rich alloy with . The resistivity of the GdFe90Co is .
III Results and Discussion
The anomalous Hall effect (AHE) in TM-RE ferrimagnets is proportional to the out-of-plane component of the TM magnetization, while the RE magnet does not contribute significantly the the AHE Shirakawa et al. (1976); Mimura et al. (1976). This is because the conduction electrons in the TM are spin polarized while the RE has no spin-split conduction band.
The AHE resistivity as a function of thickness is shown in Fig. 2, on the left axis. is proportional to the magnetic volume, and thus a linear trend can be observed. In addition, the planar Hall effect (PHE) resistivity was measured. also follows a linear trend, however, is two order of magnitude smaller than . The ratio of AHE and PHE is . The right axis of Fig. 2 shows the saturation magnetization as a function of thickness. is constant for all samples with . However, the thinnest sample of this series with has a larger .
To characterize the SOT in our samples we performed harmonic Hall measurements of the effective magnetic fields, following Hayashi et al. Hayashi et al. (2014). We start by measuring the first and second harmonic voltage responses and to an AC current with as a function of in-plane magnetic field . To measure the Slonczewski field , the in-plane magnetic field is applied along the -direction, while the in-plane magnetic field is applied along the -direction to measure the field-like field . For all harmonic Hall measurements discussed in the following, the samples were magnetized along the -direction and thus .
A typical harmonic Hall measurement to determine is shown in Fig. 3(a) for a GdFe90Co sample with and . The first harmonic response (blue) follows a quadratic trend as a function of the in-plane magnetic field , while the second harmonic response (red) can be approximated by a linear function of . Here is the current through the GdFe90Co .
To compute the effective Slonczewski field from this measurement, the slope of is divided by the curvature of Hayashi et al. (2014):
| (1) |
Figure 3(b) shows that the effective magnetic field obtained from this analysis is proportional to the current density in the HM layer in all samples under investigation. This confirms that the effect measured here is indeed caused by SOT, and not by non-linear effects such as heating. In the following, we will refer to the effective field per unit current density through the HM layers as .
To account for a mixing of and due to the presence of the PHE, the following correction is applied to the data shown in Figure 3 Hayashi et al. (2014):
| (2) |
Here, is the ratio of PHE resistivity and AHE resistivity: and the sample is magnetized upwards . The resulting fields are plotted in the upper panel of Fig. 4 as a function of GdFe90Co thickness. All samples with , follow a dependence. This is expected from angular momentum conservation as the SOT due to a spin-current is of the form:
| (3) |
where is the electric charge, Planck’s constant and the spin current. The sample with does not follow the trend because is larger (c. f. Fig. 2) and thus is smaller.
Next we use the results for to calculate the spin-Hall angle according to:
| (4) |
Here perfect interface transparency was assumed. Figure 4 shows that does not depend on . This is expected, because the SHA only depends on the choice of SH metal and the interface. Both did not change upon increasing the GdFe90Co thickness. The average value for the SHA is . This value is well in agreement with literature values in Pt/Co/Ta systems Woo et al. (2014).
In addition to harmonic Hall measurements, we also conducted SOT switching experiments to measure the scaling of critical switching current. To this end, current pulses were applied through the heavy metal layers and the magnetic response was measured by the AHE in the GdFe90Co . In order to switch a magnetic film with PMA, an additional magnetic field need to be applied in the -direction to break the symmetry. First we investigated, how the critical current that is needed to switch the magnet, scales with . A typical switching phase diagram for a GdFe90Co film with is shown in Fig. 5(a). As expected, the critical current decreases with increasing .
Next we show that the critical current density for SOT-switching at fixed scales linearly with (blue pentagons in Fig. 5(b)). This is expected from macro spin simulations if Lee et al. (2013), where is the anisotropy field. The magnitude of is in agreement with previous results in GdFeCo Roschewsky et al. (2016).
Magnetic memory applications require not only low switching current densities but also high thermal stability , where is the activation energy barrier. To investigate the scaling behavior of with we performed field-switching experiments with an external magnetic field applied along the magnetic easy axis. Field switching is a thermally activated process. Thus, it is expected that the coercive field depends on the rate at which the magnetic field is changed. This is shown in Fig. 6(a), where two hysteresis loops, recorded at different sweep rates, are shown. At slow sweeping rates, the switching event occurs at smaller fields, as it is more likely to thermally nucleate a domain, which will then propagate in the magnet.
The dependence of on the sweeping rate has been studied systematically over 3 orders of magnitude on samples with different GdFeCo thickness. The result is shown in Fig. 6(b): In a semilogarithmic plot depends approximately linearly on the sweeping rate. Note that each value for is the average value from 20 consecutive field switching measurements. To analyze this data we use a model proposed by El-Hilo et al. El-Hilo et al. (1992):
| (5) |
Here, is the anisotropy field, is the thermal stability factor, the attempt frequency and the sweeping rate. Figure 6(b) shows that this model (solid lines) fits the experimental data well. The extracted values for are shown in Fig. 6(c). For the extraction we assumed an attempt frequency of .
A linear trend is seen in Fig. 6(c) because the thermal stability is proportional to the magnetic volume. The sample with does not follow the trend, which we attribute again to an increase in saturation magnetization.
The switching efficiency for SOT devices is defined as . In our devices, as well as scale linearly with thickness. Thus, the switching efficiency does not depend on the thickness as shown in Fig. 5(b) on the right axis (red triangles). This has important consequences for memory applications. If traditional SOT devices with TM magnets are scaled to smaller lateral dimensions, the thermal stability will necessarily decrease. Thus, materials with larger anisotropy have to be found to keep the data retention time large. In our devices, on the other hand, the thermal stability can simply be enhanced by increasing the thickness. Thus GdFeCo might be a good material for ultra-scaled memory devices.
All results discussed to far have been obtained on GdFe90Co samples with . However, it is known from previous experiments in RE-TM magnets Ueda et al. (2016); Roschewsky et al. (2016); Finley and Liu (2016), that SOT exhibit a distinctive dependence on the film composition. So far the composition dependence has only been studied in very thin films with . Further, the effective fields were estimated from domain wall motion experiments. Here we used harmonic Hall measurements to characterize the composition dependence of the effective SOT fields in thick GdFe90Co films.
IV Conclusion
In conclusion, we showed that the effective magnetic field , induced by SOT, scales as for all samples under investigation in this study. This is a consequence of angular momentum conservation. is found to be constant at an average value of . In addition, we showed SOT-driven switching, even for thick magnets. Since , as well as scales linearly with thickness, the switching efficiency is constant. This has important technological implications, as it allows for lateral scaling of memory devices to ultra-small dimensions.
We thank Johannes Mendil and Samuel Smith for fruitful discussions. Research was supported by the Office of Science, Office of Basic Energy Sciences, Materials Science and Engineering Division and the U.S. Department of Energy under Contract No. DE-AC02-05-CH11231 within the NEMM program (KC2204). Device fabrication was supported by the STARNET/FAME Center.
References
- Apalkov et al. (2016) D. Apalkov, B. Dieny, and J. M. Slaughter, Proc. IEEE 104, 1796 (2016).
- Engel et al. (2005) B. N. Engel, J. Akerman, B. Butcher, R. W. Dave, M. DeHerrera, M. Durlam, G. Grynkewich, J. Janesky, S. V. Pietambaram, N. D. Rizzo, J. M. Slaughter, K. Smith, J. J. Sun, and S. Tehrani, IEEE Trans. Mag. 41, 132 (2005).
- Rizzo et al. (2013) N. D. Rizzo, D. Houssameddine, J. Janesky, R. Whig, F. B. Mancoff, M. L. Schneider, M. DeHerrera, J. J. Sun, K. Nagel, S. Deshpande, H. J. Chia, S. M. Alam, T. Andre, S. Aggarwal, and J. M. Slaughter, IEEE Trans. Mag. 49, 4441 (2013).
- Lee and Lee (2016) S. W. Lee and K. J. Lee, Proc. IEEE 104, 1831 (2016).
- Liu et al. (2012a) L. Liu, C. F. Pai, Y. Li, H. W. Tseng, D. C. Ralph, and R. A. Buhrman, Science 336, 555 (2012a).
- Liu et al. (2012b) L. Liu, O. J. Lee, T. J. Gudmundsen, D. C. Ralph, and R. A. Buhrman, Phys. Rev. Lett. 109, 96602 (2012b).
- Miron et al. (2011) I. M. Miron, K. Garello, G. Gaudin, P. J. Zermatten, M. V. Costache, S. Auffret, S. Bandiera, B. Rodmacq, A. Schuhl, and P. Gambardella, Nature 476, 189 (2011).
- Haney et al. (2013) P. M. Haney, H. W. Lee, K. J. Lee, A. Manchon, and M. D. Stiles, Phys. Rev. B 87, 174411 (2013).
- Berger (1996) L. Berger, Phys. Rev. B 54, 9353 (1996).
- Slonczewski (1996) J. C. Slonczewski, J. Mag. Mat. 159, L1 (1996).
- Ikeda et al. (2010) S. Ikeda, K. Miura, H. Yamamoto, K. Mizunuma, H. D. Gan, M. Endo, S. Kanai, J. Hayakawa, F. Matsukura, and H. Ohno, Nat. Mat. 9, 721 (2010).
- Yang et al. (2011) H. X. Yang, M. Chshiev, B. Dieny, J. H. Lee, A. Manchon, and K. H. Shin, Phys. Rev. B 84, 54401 (2011).
- Zhao et al. (2015) Z. Zhao, M. Jamali, A. K. Smith, and J. P. Wang, Appl. Phys. Lett. 106, 132404 (2015).
- Ueda et al. (2016) K. Ueda, M. Mann, C. F. Pai, A. J. Tan, and G. S. D. Beach, Appl. Phys. Lett. 109, 232403 (2016).
- Roschewsky et al. (2016) N. Roschewsky, T. Matsumura, S. Cheema, F. Hellman, T. Kato, S. Iwata, and S. Salahuddin, Appl. Phys. Lett. 109, 112403 (2016).
- Finley and Liu (2016) J. Finley and L. Liu, Phys. Rev. Applied 6, 54001 (2016).
- Fan et al. (2014) X. Fan, H. Celik, J. Wu, C. Ni, K. J. Lee, V. O. Lorenz, and J. Q. Xiao, Nat. Comm. 5, 3042 (2014).
- Lo Conte et al. (2016) R. Lo Conte, G. V. Karnad, E. Martinez, K. Lee, N. H. Kim, D. S. Han, J. S. Kim, S. Prenzel, T. Schulz, C. Y. You, H. J. M. Swagten, and M. Klaeui, ArXiv (2016), arXiv:1609.02078 .
- Lee et al. (2014) H. R. Lee, K. Lee, J. Cho, Y. H. Choi, C. Y. You, M. H. Jung, F. Bonell, Y. Shiota, S. Miwa, and Y. Suzuki, Sci. Rep. 4, 6548 (2014).
- Shirakawa et al. (1976) T. Shirakawa, Y. Nakajima, K. Okamoto, S. Matsushita, and Y. Sakurai, AIP Conference Proceedings 34, 349 (1976).
- Mimura et al. (1976) Y. Mimura, N. Imamura, and Y. Kushiro, J. Appl. Phys. 47, 3371 (1976).
- Hayashi et al. (2014) M. Hayashi, J. Kim, M. Yamanouchi, and H. Ohno, Phys. Rev. B 89, 144425 (2014).
- Woo et al. (2014) S. Woo, M. Mann, A. J. Tan, L. Caretta, and G. S. D. Beach, Appl. Phys. Lett. 105, 212404 (2014).
- Lee et al. (2013) K. S. Lee, S. W. Lee, B. C. Min, and K. J. Lee, Appl. Phys. Lett. 102, 112410 (2013).
- El-Hilo et al. (1992) M. El-Hilo, A. M. de Witte, K. O’Grady, and R. W. Chantrell, J. Mag. Mat. 117, L307 (1992).