\ulined
Differential cross-section measurements of boosted top quarks at TeV with the ATLAS detector
Michael Fenton111Work supported by the Science and Technologies Funding Council of the United Kingdom
On behalf of the ATLAS Collaboration
Department of Physics and Astronomy
University of Glasgow, University Avenue, Glasgow, G12 8QQ, UK
Differential cross-section measurements of highly boosted top quarks are presented. The dataset used has an integrated luminosity of fb-1, recorded at a centre-of-mass energy of TeV with the ATLAS detector at the CERN Large Hadron Collider in 2015. Events are selected in the lepton + jets channel, containing one isolated lepton and a large radius jet that is identified as originating from a top quark using substructure tagging techniques. The measured transverse momentum and absolute rapidity distributions are unfolded to remove detector effects and compared to a range of Monte Carlo simulations. The transverse momentum distribution shows that all Monte Carlo generators used predict a harder spectrum than observed in data, while the rapidity distribution agrees well between MC and data.
PRESENTED AT
International Workshop on Top Quark Physics
Olomouc, Czech Republic, September 19–23, 2016
1 Introduction
The top quark occupies a unique position in the Standard Model (SM). It’s large mass, close to the electro-weak symmetry breaking scale, means that precision top measurements are a likely window to physics beyond the SM, where effects from new physics may modify top kinematics. The ATLAS Collaboration [1] has previously measured top quark kinematics in the lepton+jets channel [2], and similar measurements have also been performed by CMS [3]. The largest deviation from the SM expectation in these measurements was observed in the top quark spectra, with most Monte-Carlo (MC) simulations predicting a harder spectra than was observed.
To maximise reach and sensitivity to the high region, measurements can be performed in the “boosted” regime. A top quark can be considered boosted if its decay products are sufficiently collimated as to be detected within the cone of a single jet, usually with a radius parameter of around 1. Since typically the radial separation of a particle decay products is approximately , a top quark can be considered to be boosted if it is produced with around GeV.
2 Event Topology + Selection
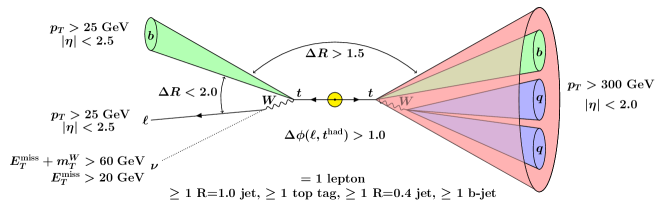
The analysis is performed in the lepton+jets channel, whereby one top quark decays leptonically and one decays hadronically. The analysis requires exactly one lepton ( or ) and at least one anti-kt R=1.0 jet. Top jets are identified using a simple tagger [6] which uses dependent substructure cuts optimised on 13 TeV MC, and the leading large radius jet that passes this tagger is considered the hadronic top candidate. To further improve the signal selection, at least one b-tagged small radius jet is required in the event, either inside the leading top jet or near to the lepton. Further requirements are made on and , as well as some angular cuts, to optimise the signal selection. The full details of these cuts are shown in Figure 1.
The expected signal is predicted using a Powheg+Pythia6 MC sample. The single top background is also modelled using Powheg+Pythia6, the background is estimated with Madgraph+Pythia6, and the W+jets, Z+jets and Diboson backgrounds are modelled using Sherpa2.1. The W+jets sample has additional data-driven scale factors applied to better model the charge asymmetry and heavy flavour content of the sample, while the QCD multijet background is estimated using a fully data-driven matrix method.
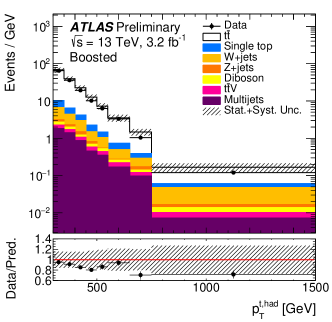
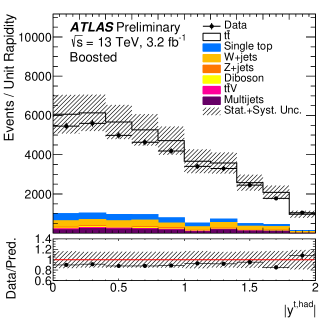
The pre-unfolding distributions of the two variables of interest are shown in Figure 2. Good agreement is seen between prediction and data for the absolute value of the top jet rapidity, , while a clear slope is present in the transverse momentum of the top jet, .
3 Unfolding Procedure
The data is unfolded to remove detector effects to a fiducial phase space using Iterative Bayesian unfolding, with 4 iterations. This procedure involves two bin-by-bin corrections factors, and , which correct for events which fail detector level and particle level selection, respectively. The expected background contribution is subtracted and a matrix of bin to bin migrations is constructed. The final differential cross-section is given after normalisation by the luminosity and the bin width . This procedure is summarised in Equation 1, where represents the Bayesian unfolding procedure.
| (1) |
The migration matrices are required to be highly diagonal in the chosen binning, such that all diagonal elements are above 50%.
4 Uncertainties
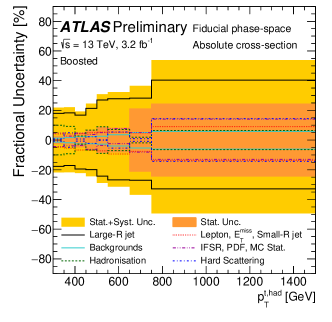
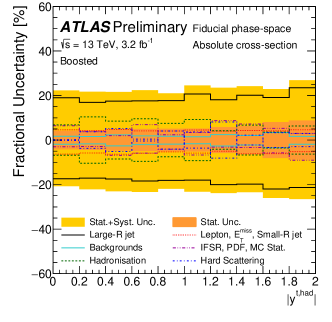
The measurement is limited primarily by the systematic uncertainties related to the jet energy scale, tracking, and substructure of the large-R jets, as shown for each bin of the absolute differential cross-section in Figure 3. Other significant contributions to the uncertainty come from the choice of hard scattering and hadronisation models as well as the limited statistics, particularly at high . Normalised differential distributions, where some systematic contributions cancel, are also included in the CONF note [7].
5 Results
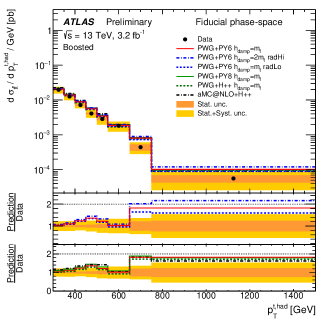
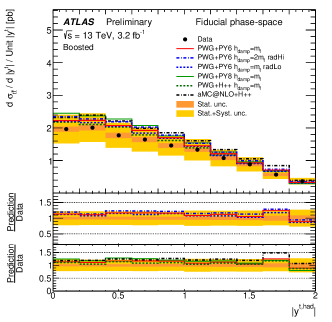
The final unfolded data are shown and compared to multiple MC generators in Figure 4. It can be seen that the spectrum continues to show an increasingly large discrepancy as the increases, similar to that seen in all measurements in Run 1, with all predictions outwith the uncertainty bands in the final two bins. The shows generally good agreement between data and MC.
6 Conclusions
Differential cross-sections have been measured of boosted top quarks for the first time in TeV data with the ATLAS detector, as a function of both top quark and . The spectrum continues to show some tension with SM expectation, in line with previous measurements. The distribution, previously unmeasured for boosted tops, shows broad agreement with predictions within the uncertainties.
References
- [1] ATLAS Collaboration, JINST 3(2008) S08003, arXiv:0901.0512 [hep-ex].
- [2] ATLAS Collaboration, Eur. Phys. J., C76(2016)538, arXiv:1511.04716 [hep-ex].
- [3] CMS Collaboration, Eur. Phys. J., C75(2015)542, arXiv:1505.04480 [hep-ex].
- [4] ATLAS Collaboration, Phys. Rev., D93(2016)032009, arXiv:1510.03818 [hep-ex].
- [5] CMS Collaboration, Phys. Rev. D94(2016)072002, arXiv:1605.00116 [hep-ex].
- [6] ATLAS Collaboration, ATL-PHYS-PUB-2015-053, (2015).
- [7] ATLAS Collaboration, ATLAS-CONF-2016-040, (2016).