An assessment of Fe XX – Fe XXII emission lines in SDO/EVE data as diagnostics for high density solar flare plasmas using EUVE stellar observations
Abstract
The Extreme Ultraviolet Variability Experiment (EVE) on the Solar Dynamics Observatory obtains extreme-ultraviolet (EUV) spectra of the full-disk Sun at a spectral resolution of 1 Å and cadence of 10 s. Such a spectral resolution would normally be considered to be too low for the reliable determination of electron density (Ne) sensitive emission line intensity ratios, due to blending. However, previous work has shown that a limited number of Fe xxi features in the 90–160 Å wavelength region of EVE do provide useful Ne-diagnostics at relatively low flare densities (Ne 1011–1012 cm-3). Here we investigate if additional highly ionised Fe line ratios in the EVE 90–160 Å range may be reliably employed as Ne-diagnostics. In particular, the potential for such diagnostics to provide density estimates for high Ne ( 1013 cm-3) flare plasmas is assessed. Our study employs EVE spectra for X-class flares, combined with observations of highly active late-type stars from the Extreme Ultraviolet Explorer (EUVE) satellite plus experimental data for well-diagnosed tokamak plasmas, both of which are similar in wavelength coverage and spectral resolution to those from EVE. Several ratios are identified in EVE data which yield consistent values of electron density, including Fe xx 113.35/121.85 and Fe xxii 114.41/135.79, with confidence in their reliability as Ne-diagnostics provided by the EUVE and tokamak results. These ratios also allow the determination of density in solar flare plasmas up to values of 1013 cm-3.
keywords:
Stars: coronae – stars: flares – Sun: corona – Sun: flares1 Introduction
Electron density (Ne) is a fundamental physical parameter of a plasma, and one of the main ways for determining this quantity in remote astrophysical sources is via emission line intensity ratios which are sensitive to variations in Ne. In the case of the high temperature solar transition region and corona, many of the emission lines lie at extreme-ultraviolet (EUV) wavelengths ( 100–1200 Å), and for more than half a century numerous researchers have worked on the calculation of theoretical line ratio Ne-diagnostics involving EUV transitions (see, for example, Jordan 1966; Keenan 1996; Del Zanna & Badnell 2016). Such diagnostics have generally been used in conjunction with medium to high spectral resolution solar observations obtained with rocket-borne or satellite-based instrumentation, required to adequately resolve and hence reliably measure the relevant emission lines. Examples include the S082A instrument on board the Skylab space station, which had a resolution of 0.1 Å (Dere, 1978), the Solar EUV Rocket Telescope and Spectrograph (SERTS) at 0.05–0.08 Å resolution (Thomas & Neupert, 1994), the Coronal Diagnostic Spectrometer (CDS) on the Solar and Heliospheric Observatory (SOHO) satellite at 0.4 Å resolution (Harrison et al., 1997) and the EUV Imaging Spectrometer (EIS) on the Hinode satellite at 0.07 Å resolution (Young et al., 2007).
The Solar Dynamics Observatory (SDO), launched on 2010 February 11, contains a number of instruments including the Extreme Ultraviolet Variability Experiment (EVE), which obtains a full-disk EUV spectrum every 10 s using its MEGS-A component, albeit at a relatively low resolution of 1 Å (Woods et al., 2011). Although the EVE temporal resolution is unprecedented for an EUV spectrometer, allowing detailed studies of time-dependent phenomena such as flares, one would expect the spectral resolution to be too low to provide reliable electron density diagnostics. However, Milligan et al. (2012) found that a few Fe xxi emission line ratios in the 90–160 Å portion of the MEGS-A flare spectra provide useful electron density diagnostics for values of Ne in the range 1011–1012 cm-3, hence allowing the study of the temporal evolution of relatively low flare density.
The short-wavelength spectrometer on the Extreme Ultraviolet Explorer (EUVE) satellite obtained spectra of astrophysical sources in the 70–190 Å region at a resolution of 0.5 Å (Abbott et al., 1996). It observed many highly-active late-type stars (see, for example, Craig et al. 1997), and due to the comparable spectral coverage and resolution with EVE flare data, the EUVE and EVE observations can appear remarkably similar in terms of the presence of highly ionised Fe lines, as illustrated in Figure 1. Hence the EUVE spectra may be employed as a ‘testbed’ for Fe ion line ratio diagnostics in EVE observations, and in particular allow us to assess the potential usefulness of such diagnostics for high Ne flare plasmas, as active late-type stars can contain high density (up to 1013 cm-3 or greater) coronal material.

In the present paper we significantly expand upon the work of Milligan et al. (2012) to establish if other high temperature (10 MK) Fe lines apart from those of Fe xxi can be used to derived plasma densities under flare conditions. Specifically, we undertake a comparison of EVE and EUVE observations, plus published results for well-diagnosed high density tokamak plasmas, to test the validity of additional highly ionized Fe line ratios present in EVE spectra between 90–160 Å as reasonable density diagnostics for flaring plasmas. More importantly, we also assess if they can be employed to derive densities in the high Ne ( 1012–1013 cm-3) regime.
2 Observational data
The solar observations considered in the present paper consist of EVE spectra for two X-class solar flares obtained at event peak, namely that of 2011 February 15 at 01:55:32 UT (X2.2 class) and 2011 August 9 at 08:05:07 UT (X6.9 class). These flares were selected to maximise both the intensities of the highly ionized Fe lines of interest (and hence minimise the effect of blending from low temperature transitions), and the electron density of the emitting plasma (ideally reaching densities close to 1013 cm-3). Details of the EVE instrument and data reduction procedures may be found in Woods et al. (2012) and Milligan et al. (2012). Briefly, the Multiple EUV Grating Spectrograph (MEGS)-A of EVE obtains full-disk spectra of the Sun in the 65–370 Å wavelength range, at a resolution of 1.0 Å, every 10 s. We have employed the most recent release of the EVE data (Level 2, Version 5), based on new rocket calibration flights, which improves the accuracy in the irradiance values presented in earlier releases (Milligan et al.).
Our paper is focused on the 90–160 Å region of MEGS-A, which contained numerous emission lines arising from transitions in Fe xviii – Fe xxiii. Del Zanna & Woods (2013) have previously undertaken an analysis of Fe xviii – Fe xxiv features in EVE spectra, to investigate which of these may be relatively free of blending in solar flares and hence have the potential to be employed as diagnostics. However, these authors did not consider electron density diagnostics in detail, in particular the consistency of densities derived from different line ratios. Furthermore, they focused on plasmas with Ne in the range 1011–1012 cm-3, where many of the Fe line diagnostics are not particularly useful. For example, the Fe xxi (142.14 + 142.28)/128.75 ratio recommended by Milligan et al. (2012) only varies by 35% between 1011 and 1012 cm-3. The Fe xxi 145.73/128.75 ratio recommended by both Milligan et al. and Del Zanna & Woods varies by a much greater amount over this density interval (a factor of 4.8), but with the problem that the 145.73 Å line is very weak at such values of Ne, being predicted to be typically only 5% of the intensity of 128.75 Å. By contrast, our work is primarily concerned with the identification and assessment of diagnostics for much higher density flare plasmas, ideally up to Ne 1013 cm-3 or even greater.
In Table 1 we summarise the lines judged by Del Zanna & Woods (2013) to be blend free and which may provide electron density sensitive intensity ratios. However, in addition we include the Fe xxi 123.83 and Fe xxii 156.02 Å transitions. The former was not considered by Del Zanna & Woods, while in the case of Fe xxii 156.02 Å these authors noted that the line appeared to be blended as it implied a very high value of electron density. To investigate the potential blending of these features, we have calculated synthetic spectra with the latest version (8.0.1) of the CHIANTI collisional-radiative modelling packages, appropriate for plasmas with densities up to 1015 cm-3 (Dere et al., 1997; Del Zanna et al., 2015). Spectra have been generated for electron densities in the range 1011–1013 cm-3, and for the standard CHIANTI flare differential emission measure (DEM) distribution. Although each solar flare will have its own characteristics (including DEM), we note that the highly ionized Fe lines are formed over a narrow range of temperatures of maximum fractional abundance, log Tmax = 7.0–7.1 (Bryans et al., 2009). The DEMs of different flares do not vary significantly over this temperature interval, as shown by for example Figure 5 of Kennedy et al. (2013). Our CHIANTI synthetic spectra indicate that blending species (primarily Cr xvii 122.97, Mn xxi 124.08 and Cr xx 156.02 Å) should make at most 25% contributions to the total measured line fluxes of both the Fe xxi 123.83 and Fe xxii 156.02 Å lines.
| Species | Transition | Wavelength (Å) |
|---|---|---|
| Fe xx | 2s22p3 2D5/2 – 2s2p4 2D5/2 | 113.35 |
| Fe xx | 2s22p3 4S3/2 – 2s2p4 4P3/2 | 121.85 |
| Fe xxi | 2s22p2 3P2 – 2s2p3 3P1 | 123.83 |
| Fe xxi | 2s22p2 3P0 – 2s2p3 3D1 | 128.75 |
| Fe xxi | 2s22p2 3P1 – 2s2p3 3D1,2 | 142.14 + 142.28 |
| Fe xxi | 2s22p2 3P2 – 2s2p3 3D3 | 145.73 |
| Fe xxii | 2s22p 2P3/2 – 2s2p2 2P3/2 | 114.41 |
| Fe xxii | 2s22p 2P1/2 – 2s2p2 2P1/2 | 117.15 |
| Fe xxii | 2s22p 2P1/2 – 2s2p2 2D3/2 | 135.79 |
| Fe xxii | 2s22p 2P3/2 – 2s2p2 2D5/2 | 156.02 |
For late-type stellar observations, we have employed spectra from the EUVE satellite mission, which operated from 1992 June 7 to 2001 January 31. A full description of the EUVE spectrometers may be found in Abbott et al. (1996) and references therein. Briefly, EUVE observed sources over the 70–760 Å wavelength range using three slitless, imaging spectrometers, with that of relevance to the present paper being the short-wavelength (SW) instrument which covered 70–190 Å at a resolution of 0.5 Å. An atlas of the spectra for 95 stellar sources from the EUVE Public Archive was published in Craig et al. (1997), which also contains details of the data reduction procedures. We have selected a sample of late-type stars for our study which are extremely active and hence show strong emission from highly ionized Fe lines, as well as large electron density estimates (Ne 1012 cm-3) for the emitting coronal plasma. Data for these objects were obtained from the Mikulski Archive for Space Telescopes (MAST). The archival spectra were processed with EUVE IRAF software version 1.9 with reference data EGODATA 1.17, and analyzed using IRAF and custom IDL routines. To improve the signal-to-noise of the EUVE data, we created new summed datasets using all available SW observations in MAST for UX Ari (4 spectra), V711 Tau (7) and AD Leo (9), while for 44i Boo and AU Mic we analysed existing co-added data. The total exposure times of the summed EUVE spectra are listed in Table 2. Detailed information on each star and the relevant EUVE spectral datasets may be found in the following references: Brickhouse & Dupree (1998) for 44i Boo, Monsignori Fossi et al. (1996) for AU Mic, Sanz-Forcada et al. (2002) for UX Ari and V711 Tau, and Sanz-Forcada & Micela (2002) for AD Leo.
| Line ratio | 2011 Feb 15 flare | 2011 Aug 9 flare | 44i Boo | AU Mic | UX Ari | V711 Tau | AD Leo | FTU | PLT | PLT | PLT |
|---|---|---|---|---|---|---|---|---|---|---|---|
| 01:55:32 UT | 08:05:07 UT | 141 ksb | 69.6 ksb | 450 ksb | 790 ksb | 1100 ksb | tokamakc | tokamakd | tokamakd | tokamake | |
| Fe sc xx 113.35/121.85 | … | 0.200.02 | 0.210.12 | 0.230.14 | 0.160.10 | 0.180.12 | 0.250.17 | … | … | … | … |
| … | 12.60.1 | 12.7 | 12.8 | 12.4 | 12.5 | 12.9 | … | … | … | … | |
| Fe xxi (142.14+142.28)/128.75 | 0.130.02 | 0.160.02 | 0.510.24 | 0.210.11 | 0.290.15 | 0.170.07 | 0.380.17 | 1.30.2 | … | … | 0.91 |
| 11.7 | 12.0 | 12.9 | 12.3 | 12.5 | 12.0 | 12.7 | 13.8 | … | … | 13.4 | |
| Fe xxi 145.73/128.75 | 0.210.04 | 0.170.03 | 0.340.19 | 0.220.06 | 0.110.09 | 0.050.02 | 0.060.03 | 1.00.2 | … | … | 0.61 |
| 12.4 | 12.20.1 | 12.7 | 12.4 | 12.0 | 11.5 | 11.6 | 13.7 | … | … | 13.2 | |
| Fe xxi 123.83/(142.14+142.28) | 0.910.17 | 0.490.06 | 0.370.08 | 0.640.41 | 0.500.37 | 0.200.11 | 0.280.19 | … | … | … | … |
| Lf | Lf | 10.0 | 11.8 | 12.7 | 12.1 | 10.9 | … | … | … | … | |
| Fe xxii 114.41/135.79 | 0.250.03 | 0.250.02 | 0.410.23 | 0.260.09 | 0.290.11 | 0.210.04 | 0.300.08 | … | 0.79 | 0.60 | 0.82 |
| 12.5 | 12.5 | 13.1 | 12.6 | 12.8 | 12.1 | 12.8 | … | 13.7 | 13.5 | 13.8 | |
| Fe xxii 114.41/117.15 | 0.170.02 | 0.250.02 | 0.540.30 | 0.220.08 | 0.230.07 | 0.230.07 | 0.240.04 | 1.10.3 | 0.67 | 0.33 | 0.40 |
| 11.4 | 12.6 | 13.4 | 12.3 | 12.4 | 12.4 | 12.5 | 14.1 | 13.6 | 12.9 | 13.1 | |
| Fe xxii 156.02/135.79 | 0.140.04 | 0.0760.013 | 0.180.14 | 0.290.07 | 0.190.12 | 0.190.16 | 0.210.10 | 0.550.06 | … | … | 0.59 |
| 12.9 | 12.4 | 13.0 | 13.4 | 13.1 | 13.1 | 13.1 | 13.8 | … | … | 13.9 | |
| Mean density | 12.40.5 | 12.40.2 | 13.00.3 | 12.60.4 | 12.50.4 | 12.30.5 | 12.60.5 | 13.90.2 | 13.70.1 | 13.20.4 | 13.50.4 |
| Log Ne(other)g | … | … | 13.20.7 | 12.70.5 | 12.50.4 | 12.20.1 | 12.90.3 | 13.9 | 13.5 | 12.7 | 13.4 |
aRatios are in photon units.
bTotal exposure time of the summed EUVE short-wavelength spectrum.
cFrom Fournier et al. (2001).
dFrom Stratton et al. (1984).
eFrom Stratton et al. (1985).
fL indicates that the observed ratio is greater than the theoretical low density limit.
gStellar electron densities derived from a range of high temperature ions in the EUVE spectra.
The tokamak values are those measured by Fournier et al. (2001) or Stratton et al. (1984, 1985).
The final sets of EUV spectra considered here are from the Frascati Tokamak Upgrade (FTU) and Princeton Large Torus (PLT) tokamaks, obtained by Fournier et al. (2001) and Stratton et al. (1984, 1985), respectively. All three datasets have a spectral resolution of 0.7 Å, similar to those of the EVE and EUVE observations. The tokamak spectra will not show the same level of blending as the astrophysical data, due to the latter sampling a larger number of elements. However, they should still provide a useful comparison with the solar/stellar observations, as most of the significant emission lines in the EUV region of interest arise from other high ionization Fe transitions. This is shown by, for example, a comparison of the Fe spectrum of the FTU tokamak between 85–140 Å in Figure 2 of Fournier et al. with the EVE and EUVE data in Figure 1, which appear very similar. Hence the tokamak spectra should allow the reliability and consistency of highly ionized Fe line diagnostics to be assessed. Tokamaks are also particularly useful to the present study as their plasmas have very large values of Ne, similar to or greater than those of high electron density flares.
3 Results and discussion
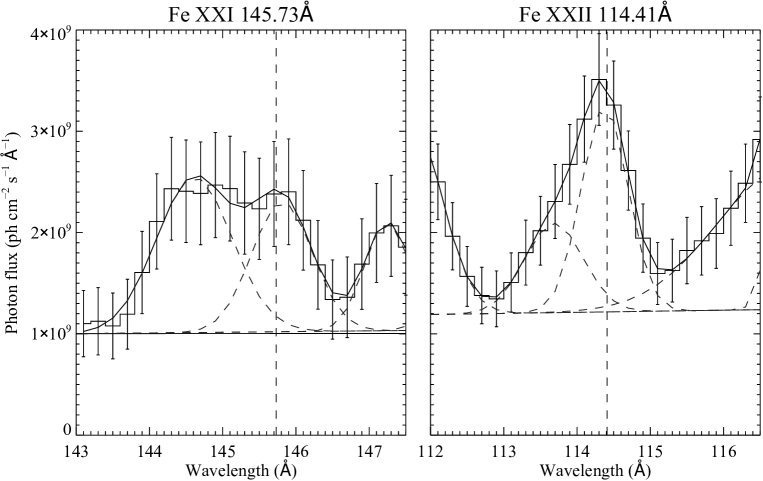
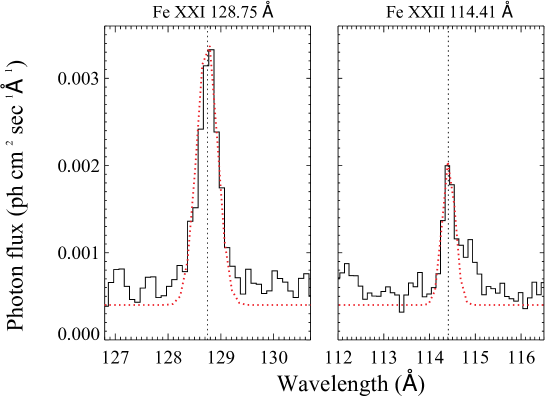
Line fluxes for the Fe ion lines in both the EVE and EUVE spectra were determined by fitting multiple Gaussian profiles to the observations, with some example fits shown in Figures 2 and 3. The resultant line intensity ratios (in photon units), along with the 1 errors, are listed in Table 2. Also included in the table are the observed line ratios for the FTU and PLT tokamak spectra, taken directly from Fournier et al. (2001) and Stratton et al. (1984, 1985).
We have derived values of electron density from the observed EVE, EUVE and tokamak line ratios using theoretical results from the latest version (8.0.1) of CHIANTI (Dere et al., 1997; Del Zanna et al., 2015). All of the line ratio calculations were performed at the value of Tmax of the relevant Fe ion (Bryans et al., 2009), although we note that the results are not sensitive to the adopted temperature. For example, changing the electron temperature for the Fe xxi (142.14 + 142.28)/128.75 line ratio calculations from Tmax = 1.1107 K to 2107 K leads to a 0.1 dex variation in the derived value of Ne. Similarly, for Fe xxii 114.41/135.79, adopting Te = 2.5107 K rather than Tmax = 1.3107 K also results in a 0.1 dex change in the density estimate. Hence even if the plasma is not in ionization equilibrium and the temperature is significantly different from Tmax, as may be the case during a flare (see, for example, Kawate et al. 2016), this should not affect the derived values of Ne. Furthermore, the timescale to achieve ionization equilibrium scales with electron density, and for the high Ne events considered here the ionization state of Fe should be close to equilibrium (Bradshaw, 2009).
Also listed in Table 2 are the electron densities, denoted Ne(other), determined from a range of high temperature ions in the EUVE spectra, in particular those with lines known to be blended in the EVE spectra (Del Zanna & Woods, 2013) but which should be relatively unblended in the (somewhat) greater resolution EUVE observations. These include density diagnostics such as Fe xx 121.85/110.63, Fe xxi 121.21/128.75 and Fe xxii 116.27/117.15. For the tokamak observations, Ne(other) is the experimental plasma density, determined from interferometry measurements to an accuracy of approximately 15% (Stratton et al., 1984, 1985; Fournier et al., 2001).
The first point to note from an inspection of Table 2 is that the Fe xxi 123.83 Å line is clearly blended to a very significant degree in the EVE observations, as the measured values of Fe xxi 123.83/(142.14 + 142.28) are both far greater (by factors of 1.7 and 3.1) than the theoretical low density limit of 0.29. As noted in Section 2, this line was not considered by Del Zanna & Woods (2013) in their assessment of EVE flare data, although it is not predicted to be severely blended. However, blending species must make a much larger contribution to the total intensity than evisaged, including perhaps unidentified transitions.
For the other Fe ion lines in the EVE spectra, the resultant intensity ratios imply electron densities that are reasonably consistent, with discrepancies that average only 0.3 dex from the mean value of log Ne = 12.4 for both flares. Similarly, for the EUVE datasets, the line ratios lead to electron density estimates for each star that are consistent within the errors, and indicate average densities which show no significant discrepancies with those derived from a wider range of high temperature Ne-diagnostic lines. Differences between the mean densities and the values of Ne(other) average only 0.1 dex, and do not exceed 0.3 dex. We note that as the EUVE spectra analysed here are the sum of several SW datasets, the derived densities will not represent specific flare values, but rather time-averaged estimates over the duration of the observations. However, this is not an issue as we are only concerned with the consistency of densities derived from different line ratios, and hence a comparison of time-averaged values is appropriate. In addition, it is worth pointing out that the ratio values for individual flares are actually very similar to those from the summed spectra. For example, for AU Mic the measured Fe xxii 114.41/135.79 and 114.41/117.15 ratios in Table 2 are 0.26 and 0.22, respectively, while those for a specific flare (interval b of Monsignori Fossi et al. 1996) are 0.30 and 0.23. The similar ratio values reflect the fact that the spectral emission is dominated, as might be expected, by high density flaring plasma. However, we employ summed EUVE spectra in our work as these provide better signal-to-noise and hence more reliable detections, especially for weak features.
In the case of the tokamak spectra, the derived average values of Ne are consistent with the experimental data in three out of four instances, with discrepancies of less than 0.2 dex. The exception is the PLT data of Stratton et al. (1984) at an experimental density of log Ne = 12.7, where the diagnostics indicate log Ne = 13.20.4. This is due to the Fe xxii 114.41/135.79 ratio being much larger than expected; the measured value is 0.60, while for an experimental density of log Ne = 12.7 the theoretical ratio is only 0.28. Stratton et al. also noted this discrepancy, and it remains unexplained. However, the problem must lie with the 135.79 Å line measurement in the spectrum, as the Fe xxii 114.41/117.15 ratio shows no significant differences between theory (0.27 at log Ne = 12.7) and observation (0.33), and hence the 114.41 Å experimental intensity should be secure. We note that there is no issue with the 135.79 Å line in the FTU spectrum of Fournier et al. (2001), with good agreement between the density derived from Fe xxii 156.02/135.79 (log Ne = 13.80.1) and the measured value (log Ne = 13.9). Furthermore, there is consistency between theory and observation for Fe xxii 114.41/135.79 in the PLT spectrum for the log Ne = 13.5 plasma, with the measured value indicating log Ne = 13.7, providing support for the reliability of the CHIANTI line ratio calculations.
4 Conclusions
The consistency of the electron densities determined from the EVE observations, combined with that also found from the EUVE and tokamak data of similar spectral resolution, indicates that the line ratios in Table 2 with the exception of Fe xxi 123.83/(142.14 + 142.28) should provide reasonable estimates of Ne for the high temperature ( 10 MK) plasma in solar flares. More importantly, the EUVE and tokamak results provide support for the line ratio diagnostics being reliable up to very high values of Ne ( 1013 cm-3), and confirm the large densities derived for the solar events. Milligan et al. (2012) found that two of the Fe xxi ratios in Table 2 — 145.73/128.75 and (142.14 + 142.28)/128.75 — provided good estimates of density at Ne 1012 cm-3. (We note in passing that these authors also considered Fe xxi 121.21/128.75, which we exclude as Del Zanna & Woods (2013) point out that the 121.21 Å feature is very weak and in the wing of the strong Fe xx 121.84 Å line). However, the present work significantly extends the Milligan et al. analysis to show that four additional ratios of Fe xx and Fe xxii may be confidently used as diagnostics, even at the low spectral resolution of EVE, and furthermore allow a high electron density regime to be reliably investigated. As EVE obtains full-disk spectra at a very high cadence of 10 s (as opposed to its low spectral resolution), this in turn indicates that the observations may be employed for reliable temporally-resolved studies of flare densities in the high Ne regime ( 1012–1013 cm-3), and in particular the investigation of the maximum density that can be achieved during flare peak. The EVE instrument has observed hundreds of flares during its 4 years of operation, providing a very large dataset for such studies. Measurement of as many as possible of the line ratios in Table 2 would be preferred, as the average densities are in better agreement with Ne(other) than the individual values, which show a large amount of scatter. However, the best diagnostics — based on their density sensitivity particularly at high Ne, and how well the derived densities agree with Ne(other) — are probably Fe xx 113.35/121.85, Fe xxi (142.14 + 142.28)/128.75 and Fe xxii 114.41/135.79.
Now that we have confirmed the usefulness of MEGS-A data for determining high flare densities, the next step is to extend our analyses to the MEGS-B spectral region (350–1050 Å), which samples lower temperature emission lines. The overall aim of this work will be to identify diagnostics which allow time profiles of flare densities simultaneously across a broad temperature range ( 0.1–10 MK).
Acknowledgements
FPK and MM are grateful to the Science and Technology Facilities Council for financial support. The research leading to these results has received funding from the European Community’s Seventh Framework Programme (FP7/2007-2013) under grant agreement no. 606862 (F-CHROMA). We are also grateful to the Leverhulme Trust for financial support via grant F/00203/X. ROM acknowledges support from NASA LWS/SDO Data Analysis grant NNX14AE07G. CHIANTI is a collaborative project involving George Mason University, the University of Michigan (USA) and the University of Cambridge (UK). The EUVE data presented in this paper were obtained from the Mikulski Archive for Space Telescopes (MAST). STScI is operated by the Association of Universities for Research in Astronomy, Inc., under NASA contract NAS5-26555. Support for MAST for non-HST data is provided by the NASA Office of Space Science via grant NNX09AF08G and by other grants and contracts.
References
- Abbott et al. (1996) Abbott M. J., Boyd W. T., Jelinksy P. et al., 1996, ApJS, 107, 451
- Bradshaw (2009) Bradshaw S. J., 2009, A&A, 502, 409
- Brickhouse & Dupree (1998) Brickhouse N. S., Dupree A. K., 1998, ApJ, 502, 918
- Bryans et al. (2009) Bryans P., Landi E., Savin D. W., 2009, ApJ, 691, 1540
- Craig et al. (1997) Craig N., Abbott M., Finley D. et al., 1997, ApJS, 113, 131
- Del Zanna et al. (2015) Del Zanna G., Dere K. P., Young P. R., Landi E., Mason H. E., 2015, A&A, 582, A56
- Del Zanna & Badnell (2016) Del Zanna G., Badnell N. R., 2016, A&A, 585, A118
- Del Zanna & Woods (2013) Del Zanna G., Woods T. N., 2013, A&A, 555, A59
- Dere (1978) Dere K. P., 1978, ApJ, 221, 1062
- Dere et al. (1997) Dere K. P., Landi E., Mason H. E., Monsignori-Fossi B. C., Young, P. R., 1997, A&AS, 125, 149
- Fournier et al. (2001) Fournier K. B., May M. J., Liedahl D. A. et al., 2001, ApJ, 561, 1144
- Harrison et al. (1997) Harrison R. A., Fludra A., Pike C. D. et al., 1997, Sol. Phys., 170, 123
- Jordan (1966) Jordan C., 1966, MNRAS, 132, 515
- Kawate et al. (2016) Kawate T., Keenan F. P., Jess D. B., 2016, ApJ, 826, 3
- Keenan (1996) Keenan F. P., 1996, Space Sci. Rev., 75, 537
- Kennedy et al. (2013) Kennedy M. B., Milligan R. O., Mathioudakis M., Keenan F. P., 2013, ApJ, 779, 84
- Milligan et al. (2012) Milligan R. O., Kennedy M. B., Mathioudakis M., Keenan F. P., 2012, ApJ, 755, L16
- Monsignori Fossi et al. (1996) Monsignori Fossi B. C., Landini M., Del Zanna G., Bowyer S., 1996, ApJ, 466, 427
- Sanz-Forcada & Micela (2002) Sanz-Forcada J., Micela G., 2002, A&A, 394, 653
- Sanz-Forcada et al. (2002) Sanz-Forcada J., Brickhouse N. S., Dupree A. K., 2002, ApJ, 570, 799
- Stratton et al. (1984) Stratton B. C., Moos H. W., Finkenthal M., 1984, ApJ, 279, L31
- Stratton et al. (1985) Stratton B. C., Moos H. W., Suckewer S., Feldman U., Seely J. F., Bhatia A. K., 1985, Phys. Rev. A, 31, 2534
- Thomas & Neupert (1994) Thomas R. J., Neupert W. M., 1994, ApJS, 91, 461
- Woods et al. (2011) Woods T. N., Hock R., Eparvier F. et al., 2011, ApJ, 739, 59
- Woods et al. (2012) Woods T. N., Eparvier F. G., Hock R. et al., 2012, Sol. Phys., 275, 115
- Young et al. (2007) Young P. R., Del Zanna G., Mason H. E. et al., 2007, PASJ, 59, S857