Molecular clouds in the extreme outer Galaxy between to
Abstract
We present the result of an unbiased CO survey in Galactic range of 34.75 45.25∘ and -5.25 5.25∘, and velocity range beyond the Outer arm. A total of 168 molecular clouds (MCs) are identified within the Extreme Outer Galaxy (EOG) region, and 31 of these MCs are associated with 13CO emission. However, none of them show significant C18O emission under current detection limit. The typical size and mass of these MCs are 5 pc and 310, implying the lack of large and massive MCs in the EOG region. Similar to MCs in the outer Galaxy, the velocity dispersions of EOG clouds are also correlated with their sizes, however, are well displaced below the scaling relationship defined by the inner Galaxy MCs. These MCs with a median Galactocentric radius of 12.6 kpc, show very different distributions from those of the MCs in the Outer arm published in our previous paper, while roughly follow the Outer Scutum-Centaurus arm defined by Dame & Thaddeus (2011). This result may provide a robust evidence for the existence of the Outer Scutum-Centaurus arm. The lower limit of the total mass of this segment is about 2.7105 , which is about one magnitude lower than that of the Outer arm. The mean thickness of gaseous disk is about 1.45∘ or 450 pc, and the scale height is about 1.27∘ or 400 pc above the plane. The warp traced by CO emission is very obvious in the EOG region and its amplitude is consistent with the predictions by other warp models using different tracers, such as dust, HI and stellar components of our Galaxy.
1 INTRODUCTION
The Extreme Outer Galaxy (EOG), is defined as the region of the Milky Way at Galactic radii () greater than 2 ( is the distance from the Sun to the Galactic center), or simply as the region outside the Outer arm (Digel et al., 1994). Molecular clouds (MCs) in the EOG regions not only delineate the spiral structure and warping of our Galaxy, but they also serve as an excellent laboratory for studying the star-formation process in a physical environment that is very different from that of the solar neighborhood (e.g., Rudolph et al., 1996; Kobayashi & Tokunaga, 2000; Kobayashi et al., 2008; Yasui et al., 2006, 2008; Izumi et al., 2014). The first few detections of EOG clouds were the results of a targeted CO survey towards the HI emission peaks in the EOG region in the second Galactic quadrant (Digel et al., 1994). A few more EOG clouds were revealed by the subsequent unbiased CO survey of the Outer Galaxy using Five College Radio Astronomy Observatory 14 meter telescope (Heyer et al., 1998; Brunt et al., 2003).
Unlike the second quadrant with few unbiased survey therein, many surveys were carried out in the first quadrant of the Galaxy (e.g., Dame & Thaddeus, 1985; Dame et al., 1986; Clemens et al., 1986, 1988; Scoville et al., 1987; Jacq et al., 1988; Solomon & Rivolo, 1989; Jackson et al., 2006; Roman-Duval et al., 2010). However, limited by the sensitivity, the latitude coverage, and the velocity coverage of previous CO surveys, all those studies were merely concentrated on the inner Galaxy. Therefore, the CO emission lying beyond the solar circle in the first quadrant of the Galaxy is less studied, let alone beyond the Outer arm (Dame et al., 2001; Heyer & Dame, 2015). It was not until 2011, however, that the Outer Scutum-Centaurus (hereafter Outer Scu-Cen) arm was found by Dame & Thaddeus (2011) lying beyond the Outer arm in the first Galactic quadrant. Ten EOG clouds (with brightness temperature ranging from 0.11 to 0.47 K) were detected in the interval of 13 55∘ in the new CO observations with the CfA 1.2 m telescope towards poorly resolved clumps in the HI (Dame & Thaddeus, 2011).
Applying different identification and analysis methods to the same data sets leads to different MCs catalogs. Using a Dendrogram technique and a hierarchical cluster identification method applied to the Dame et al. (2001) CfA 1.2 m data, Rice et al. (2016) and Miville-Deschênes et al. (2017) recently obtained a catalog of 1064 massive MCs and a catalog of 8107 MCs, respectively. These catalogs provide the most complete distribution of Milky Way MCs. Based on the l-v distribution of these MCs, none of the 1064 massive MCs lies beyond the Outer arm, and about ten out of 8107 MCs probably lie beyond the Outer arm in the first quadrant.
Because of the far distances involved and the warp of the Galactic plane from the solar radius outwards (e.g., Burke, 1957; Oort et al., 1958; Henderson et al., 1982), an unbiased Galactic plane CO survey with the combination of high-sensitivity, wide latitude coverage, and wide velocity coverage is essential for the discovery of more EOG clouds. The Milky Way Imaging Scroll Painting (MWISP) project is a high resolution () = 1-0 12CO, 13CO, and C18O survey of the northern Galactic Plane, performed with the Purple Mountain Observatory Delingha 13.7 m telescope. The survey started in 2011, and will cover Galactic longitudes from -10.25∘ to 250.25∘ and latitudes from -5.25∘ to 5.25∘ over a period of 10 years. The high-sensitivity data from MWISP survey will provide us a unique opportunity to systematically study the spiral structures and star-formation activities at the edge of the Milky Way. Using our new CO data of the MWISP, we have found dozens of new EOG clouds, which delineate a new segment of a spiral arm between Galactocentric radii of 15 and 19 kpc in the second Galactic quadrant (Sun et al., 2015).
In the first Galactic quadrant, the MWISP survey so far has completely covered the regions between 34.75 45.25∘ and -5.25 5.25∘. The mapping at least covered emission from four arms in this direction, including the Scu-Cen tangent, Sagittarius, Perseus, Outer, and Outer Scu-Cen arms that mentioned above. The results of the Outer arm within the velocity interval of -1.6 + 13.2 -10 km s-1 in this Galactic range have been presented by Su et al. (2016). The Outer Scu-Cen arm lying beyond the Outer arm is the outermost spiral arm, in other words, represents the edge of the Galactic plane in this direction. Here, we report on the results of emission from this arm according to the distribution of the CO gas between to , to . First, the observations and data reduction are described in Sect. 2, and in Sect. 3.1 and 3.2 the identification, and parameters of the EOG clouds are presented. Next, in Sect. 3.3 the revised scaling relations of Larson are examined in the EOG clouds. In Sect. 3.4, the distributions of the EOG clouds are explored. In Sect. 3.4, the spiral Arm and warp of the Galactic plane traced by CO emission are presented. In Sect. 4 a summary of the results is given.
2 CO OBSERVATIONS AND DATA REDUCTION
The observations were conducted during November 2011 to March 2015 using the 13.7 m millimeter-wavelength telescope of the Purple Mountain Observatory (PMO) in Delingha, China. The nine-beam Superconducting Spectroscopic Array Receiver (SSAR) system was used as front end, and each Fast Fourier transform spectrometer (FFTS) with a bandwidth of 1 GHz provides 16384 channels and a spectral resolution of 61 kHz (see the details in Shan et al., 2012). The molecular lines of 12CO (=1–0) in the upper sideband, and 13CO (=1–0) and C18O (=1–0) in the lower sideband were observed simultaneously. Typical system temperature is 150-200 K in the lower sideband and 250-300 K in the upper sideband.
Regions within the Galactic range of 34.75 45.25∘, and -5.25 5.25∘ are divided into 439 patches in (, ) grid for mapping, each with a size of 3030. The on-the-fly (OTF) mode was applied with typical sample steps of 10′′-15′′. The OTF raw data are re-gridded to a FITS cube with pixel size of 30′′ using the GILDAS software package111http://www.iram.fr/IRAMFR/GILDAS. The nominal sensitivity in the survey is set for 0.3 K in 13CO and C18O at the resolution of 0.17 km s-1, and 0.5 K in 12CO at the resolution of 0.16 km s-1. Each patch with a dimension 30 was scanned at least in two orthogonal directions, along the Galactic longitude and the Galactic latitude, in order to reduce the fluctuation of noise. The half-power beam width (HPBW) of the telescope was about at 115 GHz and the pointing accuracy was greater than in the observing epoch. It should be noted that any results presented in the figures and tables are on the brightness temperature scale (T), corrected for beam efficiencies, using = /, where is typically 0.51 for 13CO and C18O , and 0.46 for 12CO (see the status report of the telescope222http://www.radioast.nsdc.cn/mwisp.php).
3 RESULTS AND DISCUSSION
3.1 Molecular Clouds Identification
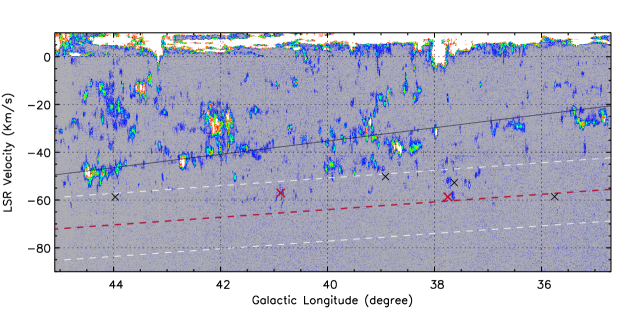
Longitude-velocity diagram of the CO emission beyond the Solar circle is shown in Figure 1. Note that the integrated latitude range is from -1.5∘ to 3.2∘, since the CO emission from the Outer Galaxy is concentrated in this latitude range. In addition, only those pixels with at least 3 continuous channels above 3 are averaged. The black-solid line ( = -2.78 + 75.9 km s-1; Su et al., 2016) and red-dashed line ( = -1.6 km s-1; Dame & Thaddeus, 2011) indicate the longitude-velocity relations of the Outer arm and the Outer Scu-Cen arm, respectively. The white-dashed lines ( = km s-1) indicate the assumed velocity range of the Outer Scu-Cen arm. Only six EOG clouds indicated by red crosses (Dame & Thaddeus, 2011) and black crosses (Miville-Deschênes et al., 2017) in Figure 1 are known MCs in this velocity range. However, our high-sensitivity CO data reveal much more features distributed beyond the Outer arm at a maximum negative velocity.
Firstly, we compiled an automatic procedure to list all the positions with emission greater than 0.92 K(2) and minimum number of adjacent pixels of 12 in the (, , ) three-dimensional (3D) 12CO J = 1-0 data cube within velocity range of km s-1. Then, we checked both the list and data cube and identified the clouds by eye. Here we should point out that we did not separate the isolated MCs into small pieces of molecular clumps. In other words, some of the MCs have more than one significant emission peak, only the strongest emission peak was chosen for the position of the cloud, which was the case for less than 20 per cen of the MCs.
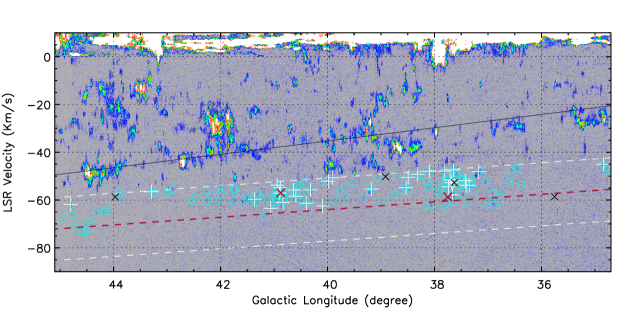
Finally, we detected 174 MCs, and the peak emissions of them are marked with circles in the longitude-velocity diagram (Figure 2). Besides, 23 other MCs are marginally detected. We note that 168 out of the 174 MCs with the -1.6 + 13.2 km s-1 might be located beyong the Outer arm, the remaining six clouds with -1.6 + 13.2 km s-1 might be located in the Outer arm or in the inter-arm. Seven of the 174 clouds were also cataloged by Su et al. (2016), but were identified by CLUMPFIND algorithm. Since the algorithm is different from this study, the seven sources are also cataloged. It is worthwhile to note that the two known EOG clouds identified by Dame & Thaddeus (2011) are also detected by us. Condering the beam size of the CfA 1.2 m telescope and the size of the MCs, three out of the four EOG clouds identified by Miville-Deschênes et al. (2017) are also detected by our new observations, the other one is marginally detected by us.
We also checked 13CO and C18O emissions in these MCs. Apparent 13CO emissions were detected in 25 of these clouds. Once we average the images over an 30” spatial extent of the emission peak to improve sensitivity, 35 dense clumps of 34 MCs showed 13CO emission. 31 of them with -1.6 + 13.2 km s-1 might be located beyond the Outer arm. None of them show significant C18O emission under current detection limit.
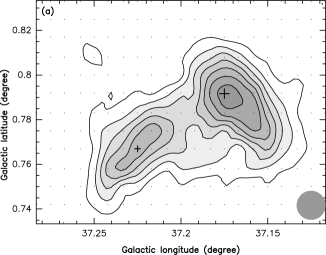
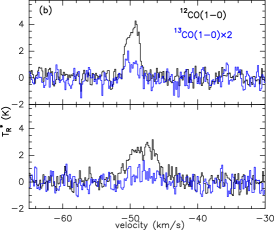
As an example, Figure 3 presents the integrated intensity map of one MC, MWISP G37.1750.792, which shows two emission peaks. The lowest contour level is 3 and increases in step of 3. 12CO and 13CO spectra of the two emission peaks that marked with pluses in Figure 3a, are plotted as black and blue histograms, respectively. The intensity of 13CO was multiplied by a factor of two for a better comparison. We find that the structures of the MC can be partially resolved by our current observation with spatial resolution of about 1.
3.2 Molecular Clouds Parameters
Table 1 displays a summary of the 174 MCs that identified in this study. The first column of the table contains the name of each MC, designated as MWISP (for CO survey project name) followed by the Galactic longitude and latitude ( and ) coordinates of the peak of the emission in degrees, e.g., MWISP G37.1750.792. Cols. 2-5 provide the single Gaussian fitting results of the brightest CO spectrum of the MCs, including LSR velocity (), line width FWHM (), integrated intensity (), and peak intensity (). The angular area of the MCs defined by the 3 limits is given in Col. 6.
We also estimated the physical parameters of these clouds. Distance is one of the most important parameters for determining the properties of the MCs, the spiral structure and warping of the Galactic plane. Since the extreme outer region of the Galactic plane is rarely studied in particularly in the first Galactic quadrant, none of the MCs have parallax or photometry distances, we then adopt kinematic distance in this study.
Fortunately, the Outer Scu-Cen arm lies beyond the solar circle, thus the molecular gas traced by CO emission does not suffer the kinematic distance ambiguity encountered in the inner Galaxy. The derived kinematic distance depends upon the choice of rotation curve and Solar motion parameters. We compared models of Reid et al. (2014) (hereafter Reid model) and Brand & Blitz (1993), which represent two often used models for kinematic distance. Generally, the derived kinematic distances of these MCs are insensitive to the exact choice of rotation curve, and are about 1 kpc (or 5 per cen) smaller on the assumption of Reid model. In this study, the rotation curve and Solar motion parameters of Model A5 of Reid et al. (2014) ( = 240 km s-1, = 8.34 kpc, km , km , km , km , km , and km ), are used to assign heliocentric and Galactocentric distances to each MC (Cols. 7 and 8). The vertical scale height is defined by (Col. 9). The cloud radius given in Col. 10 is obtained after beam deconvolution, , where is the angular size of a cloud, and is the main beam width. The mass of a cloud obtained by adopting a constant CO-to-H2 X conversion factor of 2.01020 cm (Bolatto et al., 2013), is listed in Col. 11. To evaluate the role of self-gravity, we also calculated the virial mass (Col. 12), (Bertoldi & McKee, 1992). The molecular gas surface density (Col. 13), , of a cloud is simply the mass divided by the projected area, . Note that the beam-filling factor is assumed to be 1.
Table 2 displays a summary of the 23 MCs that marginally detected in this study. A deeper observation is needed to confirm and/or to better constrain their properties. Table 3 summarizes the measured parameters of 13CO emissions, including the Gaussian fitting results of 13CO (, , and ), the integrated intensity ratio between 12CO and 13CO (), and the rms level of each detection with a velocity resolution of 0.166 km s-1. Note that those with rms values larger than 0.2 K are the rms value of a single pixel, otherwise the rms was averaged over nine pixels.
3.3 Properties of the Molecular Clouds in the Extreme Outer Galaxy
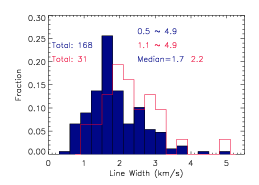
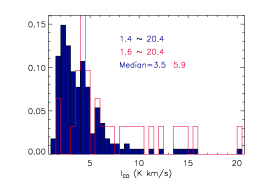
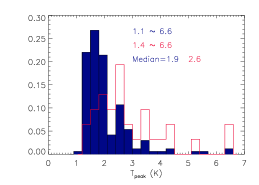
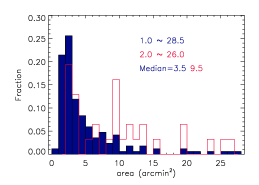
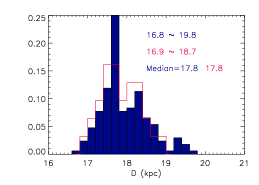
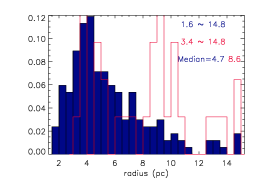
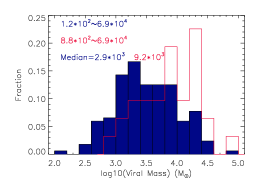
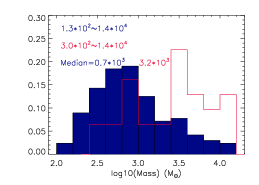
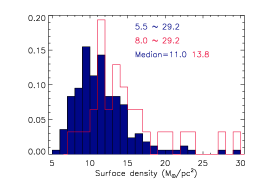
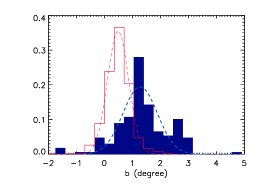
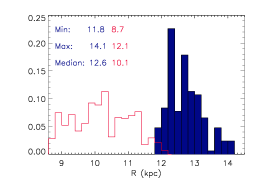
Only these clouds that might lie beyond the Outer arm are discussed in the below sections. The blue histograms in Figure 4 show the normalized number distributions for the measured 12CO parameters, including the Gaussian fitting results of the emission peak (line width, integrated intensity and ), and angular size of the EOG clouds, which yield typical parameters of 1.7 km s-1, 3.5 K km s-1, 1.9 K, and 3.5 arcmin2, respectively. The derived properties of these clouds are also plotted in Figure 4, including the heliocentric distance, the equivalent radius of the EOG clouds, virial mass, mass derived from -factor, and surface gas density, which yield typical properties of 17.8 kpc, 4.7 pc, 2.9103 , 0.7103 , and 11.0 , respectively. At a median distance of 17.8 kpc, these are the most distant detections of MCs in this direction between to . The fact that the sizes and masses of these clouds range from 1.6 pc to 14.8 pc, and 1.3102 to 1.4104 implies the lack of large and massive clouds in the EOG regions. The median gas surface density of these clouds obtained here is similar to that of MCs at similar Galactocentric radius (Miville-Deschênes et al., 2017), however, is about half value of the Outer arm (Su et al., 2016). In addition, it appears that the viral mass is much larger than the mass obtained by factor in the EOG region. Observations of Sodroski (1991) in the outer Galaxy also show similar trends. The subsequent studies by Falgarone et al. (1992) and Heyer et al. (2001) also found virial masses are much larger than CO-derived masses for the clouds with mass less than 1,000 in the outer Galaxy.
The distributions for those clouds with 13CO detections are also overlaid with red histograms in each panel in Fig. 4 for comparisons. The ranges and median values of each property are also marked. We find that those clouds with the presence of 13CO emissions are generally brighter and more massive. The ratios between 12CO and 13CO are not discussed in depth, since there are considerable uncertainties in the beam-filling factors for the two molecular lines. The ratios with median and mean values of 6.1 and 6.5 represent the upper limits for EOG clouds. Future observations with higher resolution are essential for further study.
The three empirical scaling relations of Larson (1981) can guide our understanding of the internal structure and dynamics of molecular clouds as well as the fundamental nature of the ISM environment. These relations were revised by Heyer et al. (2009). They found that equating the virial mass to the mass of the cloud implies that , where is the gravitational constant, is the cloud radius, and is the cloud surface density. This expression implies a scaling exponent of 1/2 for the line width-size relationship for constant mass surface density (Heyer et al., 2009).
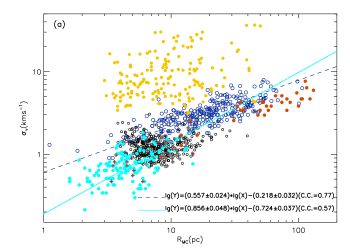
Similar to Heyer & Dame (2015), the revised scaling Larson relations are examined and compared across a wide range of Galactic environments in Figure 5. The molecular cloud velocity dispersion as a function of size for clouds located in EOG region (cyan, this work), Galactic Center (gold, Oka et al., 2001), Galactic ring (red and blue, Solomon et al., 1987; Dame et al., 1986), and outer Galaxy (black, Heyer et al., 2001) is shown in Figure 5a. The dashed line indicates a linear fitting to the inner Galaxy clouds from Solomon et al. (1987), computed using the least squares bisector. The power index is 0.5570.024, and the Pearson correlation coefficient of relation is 0.77. We find that the EOG clouds are well displaced below the scaling relationship defined by the inner Galaxy molecular clouds. The results is similar to the finding in the outer Galaxy clouds (Heyer & Dame, 2015). The best fitting result of - relation for the EOG clouds with a power index of 0.8560.048 is indicated by solid line in Fig. 5a. The Pearson correlation coefficient of this relation is 0.57. Generally, the clouds in the outer and extreme outer parts of our Galaxy have a shallower - relation, which is reflected in the larger uncertainties on the fitting results and the relatively lower Pearson correlation coefficient than clouds in the inner Galactic plane. In addition, the power index is much steeper for clouds in outer and extreme outer parts of our Galaxy. This is compatible with the analysis of Miville-Deschênes et al. (2017), who found that the scaling coefficient of the - relation decreases towards the outer Galaxy (middle panel of their Fig. 13). The observed variation of the power index of different samples of MCs simply reflects plausible differences of the amplitude of the turbulent motions between clouds owing to Galactic environments (Miville-Deschênes et al., 2017).
It is important to note that althought these EOG clouds in this study are well detected, but their properties (e.g., cloud size) are not well determined due to the relatively poor spatial resolution and sensitivity of our current observations. The radii might be overestimated for the small EOG clouds, at the lower value side in Fig. 5a, where the radii are approaching our spatial resolution limit (2 pc, at a median distance of 17.8 kpc). On the other hand, limited by our current detection limit of 102 in the EOG regions, the radii might be underestimated for the large EOG clouds (with angular size much larger than our beam size), at the higher value side in Fig 5a. Therefore, the power index only represents an upper limit for the EOG clouds. Future observations with improved resolution and sensitivity are essential for more accurate - relation for MCs in the EOG regions.
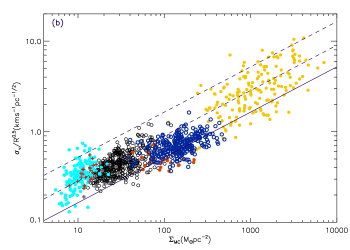
The - relation shows significant dispersion when clouds from different environments are compiled together, as revealed in Figure 5a in this study and Figure 9 of Heyer & Dame (2015). Heyer et al. (2009) firstly noticed that the dispersion is significantly reduced when the surface density is added. Figure 5b shows the variation of the scaling coefficient, /, with the mass surface density. The dependence of / on surface density for clouds within both the Galactic disk or Galactic center is evident in Fig. 5b, as implied by the above expression of size, line width, and surface density, that under the assumption of virial equilibrium. A similar correlation between / and is also present in the properties of Galactic MCs derived from 13CO (Heyer et al., 2009) and extragalactic GMCs (Bolatto et al., 2008). The results of these different analyses for large numbers of targets traced by different molecular lines, certify a necessary modification to Larson’s scaling relationships, as suggested by Heyer et al. (2009) that depends on both and . Note, however, the scatter is larger for clouds within these extreme locations of the Galaxy, both the center of the Galaxy and the edge of the Galactic disk (EOG region). The solid line and two dashed lines in Fig. 5b show the loci for =1 (lower), 3 (middle) and 10 (upper), respectively. Interestingly, almost no clouds within the inner Galactic disk have virial ratio , small portion of clouds in the outer Galaxy have , while most of the EOG clouds have . This is consistent with the finding of Miville-Deschênes et al. (2017) that MCs in the outer Galaxy exhibit higher value of than MCs in the inner Galaxy with 3 7 kpc.
Here, we should keep in mind that the masses of all MCs are derived by assuming a constant X conversion factor that measured in the Solar neighbourhood. If we believe that MCs are gravitationally bound objects, then the distributions of may suggest that factor in the EOG region should have a somewhat higher value than in the inner Galaxy. In fact, various theoretical and observational investigations have indicated high values of factor in the outer Galaxy (e.g. Brand & Wouterloot, 1995; Heyer et al., 2001; Abdo et al., 2010; Shetty et al., 2011). These are not difficult to understand. Since the increasing dominance of the CO-faint molecular gas associated probably with decreasing metallicities in the outer and/or extreme outer disk (Wolfire et al., 2010; Pineda et al., 2013; Langer et al., 2014), will naturally result in a higher value of factor (Bolatto et al., 2013). An alternative explanation could be that the EOG clouds are predominantly gravitationally unbound. In recent research, accumulated evidence seems to indicate that molecular clumps within MCs (the site for star formation to take place) should be gravitationally bound, however, it is not neccessary that the MCs as a whole to be bound (Clark et al., 2005, 2008; Ballesteros-Paredes et al., 2011). Dobbs et al. (2011) had addressed the question of how MCs can remain unbound. They found that it is a natural consequence of a scenario of cloud-cloud collisions and stellar feedback. And in this scenario, MCs are short-lived, typically a few Myr (Dobbs et al., 2011).
In both panel (a) and (b) of Fig. 5, the pluses mark the EOG clouds with 13CO detections. It appears that there is no significant difference in the and /R1/2 relations between the two groups with or without the presence of 13CO emission.
3.4 Spatial Distributions of the Molecular Clouds in the Extreme Outer Galaxy
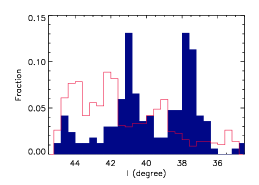
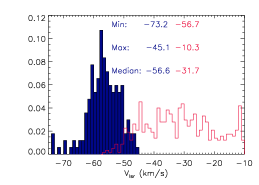
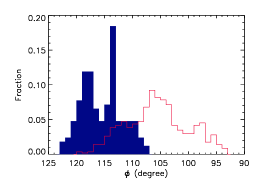
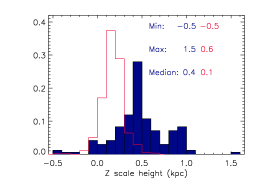
Figure 6 displays the normalized number distributions of EOG clouds (blue histogram) in the heliocentric coordinates, , , and , as well as in the Galactocentric cylindrical coordinates , , and . As mentioned above, the Reid model was chosen to convert , , to , , . The distributions of MCs in the Outer arm (red histogram) are also overlaid for comparison. It appears that the spatial distributions of the EOG clouds are not uniform. Several distribution peaks of the MCs are clearly discerned at 37.5∘, 41∘, and 45∘, respectively. Interestingly, the distributions of the EOG clouds in the Outer Scu-Cen arm are anti-correlated with the MCs in the Outer arm. We find that the EOG clouds are distributed within a broader and higher range of Galactic latitude than the MCs in the Outer arm, and can be well fitted by a Gaussian function with a full width at half maximum (FWHM) of 1.45∘ and with a peak of 1.27∘. At a median heliocentric distance of 17.8 kpc, this yields a FWHM of 450 pc, and a scale height of 400 pc above the b = 0∘ plane. These values are much higher than those of the Outer arm, which have a FWHM of 0.7∘ and a peak of 0.42∘. The dashed blue and red lines show the best Gaussian fitting results for the EOG clouds and MCs within the Outer arm, respectively.
The EOG clouds are mainly distributed within a narrow range of LSR velocities, with a peak value of -58 km s-1. In contrast, the distributions for the MCs within the Outer arm exhibit a wide range of values. Since the Milky Way rotation is well approximated by an axisymmetric rotation curve, the LSR velocity directly relates to a Galactocentric radius. As one would expect, the Galactocentric radial distributions of these clouds show similar distributions to the . Because most of the MCs are thought to well trace the logarithmic-spiral arm features (; Russeil, 2003; Hou et al., 2009; Hou & Han, 2014), it is reasonable to expect that MCs within a given arm segment with a narrow distribution of should relate to a narrow distribution of Galactocentric radii. This is the case for the EOG clouds, however, not the case for the MCs in the Outer arm (see the lower-right panel of Fig. 6). The broad distribution of the Galactocentric radii of the Outer arm can be understood in term of the probably presence of a substructure of the Outer arm near and -20 km s-1, as suggested by Su et al. (2016).
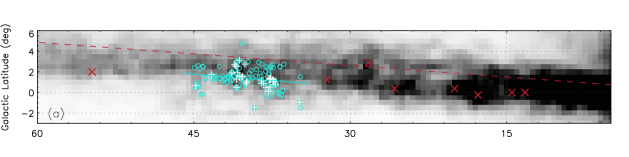
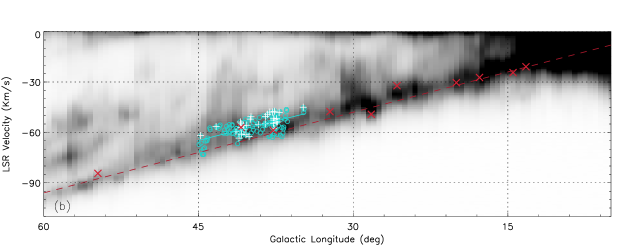
The distributions of all available EOG clouds are compared with the Outer Scu-Cen arm model (red-dashed lines) proposed by Dame & Thaddeus (2011) in Figure 7. The grayscale maps of Fig. 7a and Fig. 7b display the velocity-integrated intensity map and longitude-velocity diagram of 21 cm emissions from the Outer Scu-Cen arm. Similar to Dame & Thaddeus (2011), these diagrams are obtained by integrating the LAB 21 cm survey (Kalberla et al., 2005) over a window that follows the arm in velocity and latitude. The EOG clouds are indicated by cyan circles, and those with 13CO detections are indicated by white pluses.
We attempted to fit the distributions of these EOG clouds by a linear function. Their distributions can be described as , and in the space (the cyan-solid lines in Figure 7). We find that the fitting results of atomic hydrogen (the red dashed lines) and molecular gas show slightly different slope and intercept. When considering the larger velocity dispersion of atomic hydrogen and much higher spatial resolution of our observation, it appears that these EOG clouds and HI emissions trace the same coherent, large-scale structure, i.e., the Outer Scu-Cen arm. Broadly, our data confirm the existence of the Outer Scu-Cen arm proposed by Dame & Thaddeus (2011). The total mass of the Outer Scu-Cen arm in the segment is about 2.7105 , which is about one order of magnitude lower than that of the Outer arm (Su et al., 2016). It is important to note that the mass is a lower limit since the adopted CO-to- factor 2.01020 is measured in the solar neighborhood. However, as mentioned above, the factor might be higher in the EOG region than the nominal value. In addition, the beam dilution effects can not be neglected in the EOG region, which will lower the signal-to-noise ratio and hence also reduce the derived masses.
3.5 The Spiral Arm and Warp of the Galactic Plane Traced by CO Emission
The 3D Galactic structure traced by CO emission of the Outer Scu-Cen arm is investigated in this section. The Galactic plane traced by the CO emission of Outer Scu-Cen arm is obviously offset from the plane, and the amplitude evidently increases with the increasing of the Galactic longitude. It has long been recognized that both the effects of warping and tilted plane (because of the Sun’s offset from the physical mid-plane) will contribute to the offset between the physical midplane and the plane (e.g., Blaauw et al., 1960; Binney, 1992).
In the outer galactic disk, warp is a common feature in spiral galaxies, with amplitude increasing with galactic radius (e.g., Reshetnikov & Combes, 1998; Schwarzkopf & Dettmar, 2001; Reshetnikov et al., 2002; Kalberla & Kerp, 2009; Hou & Han, 2014). Early HI emission surveys have first revealed that the disk of our Galaxy is warped beyond the Solar circle (e.g., Burke, 1957; Kerr, 1957; Burton, 1988). This finding was confirmed by a series of studies in the Galactic disks traced by gaseous component (e.g., Oort et al., 1958; Henderson et al., 1982; Wouterloot et al., 1990; Russeil, 2003; Nakagawa et al., 2005; Sun et al., 2015), stellar component (e.g., Moitinho et al., 2006; Momany et al., 2006; Reylé et al., 2009), as well as dust component (e.g., Drimmel & Spergel, 2001; Drimmel et al., 2003; Marshall et al., 2006). However, our knowledge of the warp of the outer Galaxy to date is largely dependent on HI emission surveys. Several theories to cause and maintain warps have been proposed in the literature, including gravitational tidal interactions between galaxies, intergalactic magnetic fields, disk-halo interaction, and accretion of intergalactic medium (see the review by Binney, 1992).
Whereas, warp is not important in the inner disk of the Milky Way. The observed variation of Galactic latitude with repect to Galactic longitude can be understood in terms of the Sun’s vertical displacement from the physical mid-plane (e.g., Hammersley et al., 1995; Su et al., 2016). Various observations have revealed that the Sun is about 10-30 pc above the physical mid-plane (e.g., Chen et al., 2001; Reed, 2006; Majaess et al., 2009; Goodman et al., 2014; Su et al., 2016; Karim & Mamajek, 2016).
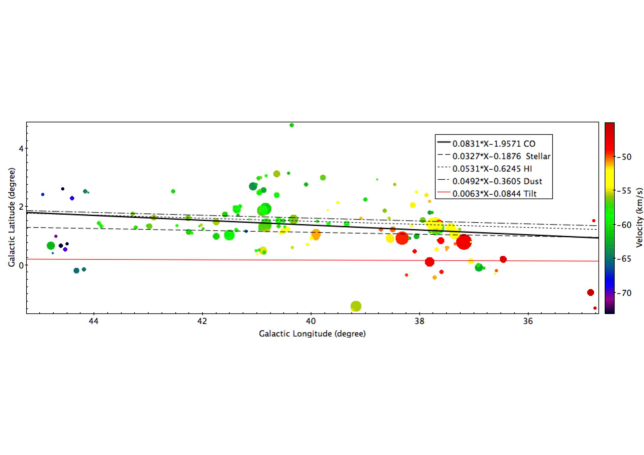
Here, we examine the effects of warping and tilted plane (because of the Sun’s offset from the physical mid-plane). Four models were tested to compare with our observation, including the gaseous warp model based on the Galactic HI survey (Levine et al., 2006), the stellar model constrained by 2MASS star counts (Reylé et al., 2009), the dust warp model obtained by dust extinction proposed by Marshall et al. (2006), as well as the tilted plane model obtained in the inner Galactic plane (Hammersley et al., 1995).
A Fourier mode frequency was used to characterize the warp in the Galactic HI warp model, (see Eq. (12) in Levine et al., 2006). Each of the three amplitudes and two phases is a function of Galactocentric radius. Following stellar model proposed by Reylé et al. (2009), the height of the warp is calculated using, , where = 8.4 kpc is taken from Derriere & Robin (2001) indicated as a best value for the starting Galactocentri radius of the warp, and = 0.09 is a value of the warp slope (the ratio between the displacement of the mid plane and the Galactocentric radius). Similar to the stellar warp model, the magnitude of the warp in the Galactic dust model can be written as, , where , = 89∘ and kpc (also see Eq. (10) in Marshall et al., 2006). The Galactic latitude of the disk predicted by the tilted plane model can be described as, (see Eq. (5) in Hammersley et al., 1995).
The comparison results are given in the space in Figure 8. The black-solid line, short-dashed line, long-dashed line, dash-dotted line, and red-solid line indicate our CO observation result, HI Levine et al. (2006) 1 model, stellar warp model (Reylé et al., 2009), dust warp model (Marshall et al., 2006), and tilted plane model (Hammersley et al., 1995), respectively. It appears that in the region with 12-14 kpc, the contribution of tilted plane is insignificant, while warp plays a dominant role. We also find that the dust and atomic gas HI models show very similar amplitude of warp, and are well consistent with our molecular gas observation results. The amplitude of the stellar warp model is slightly smaller than our observed displacement across the present Galactic longitude interval, as well as the other two warp models.
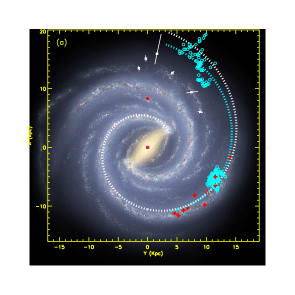
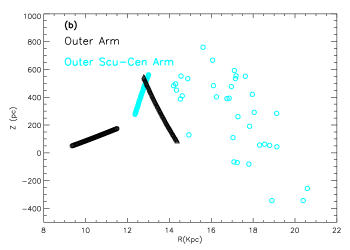
The large-scale structure traced by CO emission is also explored in the Galactocentric coordinate in Figure 9. The often used face-on view of the Milky Way (R. Hurt: NASA/JPL-Caltech/SSC) superposed on all available EOG clouds are displayed in Figure 9a, including clouds (filled star) identified by Dame & Thaddeus (2011), clouds (circle) in the 2nd and 1st quadrants identified by Sun et al. (2015), and this study. The white dashed line is a log spiral with a mean pitch angle of 12∘ that was fit to the ScuCen arm in the inner Galaxy (Vallée, 2008, 2014). And the cyan dashed line traces the fitting result of EOG clouds in Sun et al. (2015) with pitch angle of 9.3∘. Generally, our data are well in agreement with the far extension of the ScuCen arm in the outer Galaxy, as discussed previously. Figure 9b shows the vertical structure (in the space) of the Outer Scu-Cen arm traced by CO emission. We also examine the results for the Outer Scu-Cen arm in the 2nd quadrant (Sun et al., 2015), the Outer arm in both 1st and 2nd quadrants (Du et al., 2016; Su et al., 2016). Note that all structures are derived from the relations by applying the Reid model, with one exception, the Outer Scu-Cen arm in the 2nd quadrant, which is indicated by data points directly from observations. It is obvious that the shapes of the two arms gernerally follow a function, which are in agreement with the warp models from the literature. In addition, the scale heights of both the Outer Scu-Cen arm (cyan) and the Outer arm (black) are increased with the increasing of the Galactocentric radii in the same direction (with similar value of ).
4 SUMMARY
We have presented the results of an unbiased 12CO/13CO/C18O () survey in Galactic longitude range of 34.75∘ to 45.25∘, Galactic latitude range of -5.25∘ to 5.25∘, and velocity in the interval of -1.6 13.2 km s-1 that might lie beyond the Outer arm. The main results are summarized as follows.
(1) A total of 174 molecular clouds (MCs) were identified, of which 168 MCs most probably lie in the Extreme Outer Galacy (EOG) region. A total of 35 cores within the MCs show 13CO emission, of which 31 cores most probably lie in the EOG region. However, none of them show significant C18O emission under current detection limit.
(2) Physical properties of the EOG clouds were examined in detail. The revised scaling relations of Larson were tested in the EOG clouds, and compared across a wide range of Galactic environments. Similar to MCs in the outer Galaxy, the velocity dispersions of EOG clouds are also correlated with the cloud sizes, however, are well displaced below the scaling relationship defined by MCs in the inner Galaxy.
(3) We compared the distributions of the EOG clouds with the MCs lie in the Outer arm that published in our previous paper, as well as the HI emissions from the Outer Scu-Cen arm defined by Dame & Thaddeus (2011). The distributions of the EOG clouds can be described as linear features in the space (, and ), which are distinctly different from those of the MCs in the Outer arm, while roughly follow the and relations of the Outer Scu-Cen arm defined by Dame & Thaddeus (2011). All these may provide a robust evidence for the existence of the Outer Scu-Cen arm. The lower limit of the total molecular mass of this arm segment is about 2.7105 , assuming a conversion factor of 2.01020 .
(4) In the EOG region, the warp traced by CO emission is very obvious. The mean thickness of gaseous disk is about 450 pc, and the scale height is about 400 pc above the plane. The comparison between our observation and warp models reveals that different components of our Galaxy (stellar, dust, molecular gas, atomic gas) show similar amplitude of warp, in particular, the gaseous and dust components.
References
- Abdo et al. (2010) Abdo, A. A., Ackermann, M., Ajello, M., et al. 2010, ApJ, 710, 133
- Ballesteros-Paredes et al. (2011) Ballesteros-Paredes, J., Hartmann, L. W., Vázquez-Semadeni, E., Heitsch, F., & Zamora-Avilés, M. A. 2011, MNRAS, 411, 65
- Bertoldi & McKee (1992) Bertoldi, F., & McKee, C. F. 1992, ApJ, 395, 140
- Binney (1992) Binney, J. 1992, ARA&A, 30, 51
- Blaauw et al. (1960) Blaauw, A., Gum, C. S., Pawsey, J. L., & Westerhout, G. 1960, MNRAS, 121, 123
- Bolatto et al. (2008) Bolatto, A. D., Leroy, A. K., Rosolowsky, E., Walter, F., & Blitz, L. 2008, ApJ, 686, 948
- Bolatto et al. (2013) Bolatto, A. D., Wolfire, M., & Leroy, A. K. 2013, ARA&A, 51, 207
- Brand & Blitz (1993) Brand, J., & Blitz, L. 1993, A&A, 275, 67
- Brand & Wouterloot (1995) Brand, J., & Wouterloot, J. G. A. 1995, A&A, 303, 851
- Brunt et al. (2003) Brunt, C. M., Kerton, C. R., & Pomerleau, C. 2003, ApJS, 144, 47
- Burke (1957) Burke, B. F. 1957, AJ, 62, 90
- Burton (1988) Burton, W. B. 1988, The structure of our Galaxy derived from observations of neutral hydrogen, ed. K. I. Kellermann & G. L. Verschuur, 295–358
- Chen et al. (2001) Chen, B., Stoughton, C., Smith, J. A., et al. 2001, ApJ, 553, 184
- Clark et al. (2008) Clark, P. C., Bonnell, I. A., & Klessen, R. S. 2008, MNRAS, 386, 3
- Clark et al. (2005) Clark, P. C., Bonnell, I. A., Zinnecker, H., & Bate, M. R. 2005, MNRAS, 359, 809
- Clemens et al. (1988) Clemens, D. P., Sanders, D. B., & Scoville, N. Z. 1988, ApJ, 327, 139
- Clemens et al. (1986) Clemens, D. P., Sanders, D. B., Scoville, N. Z., & Solomon, P. M. 1986, ApJS, 60, 297
- Dame et al. (1986) Dame, T. M., Elmegreen, B. G., Cohen, R. S., & Thaddeus, P. 1986, ApJ, 305, 892
- Dame et al. (2001) Dame, T. M., Hartmann, D., & Thaddeus, P. 2001, ApJ, 547, 792
- Dame & Thaddeus (1985) Dame, T. M., & Thaddeus, P. 1985, ApJ, 297, 751
- Dame & Thaddeus (2011) —. 2011, ApJ, 734, L24
- Derriere & Robin (2001) Derriere, S., & Robin, A. C. 2001, in Astronomical Society of the Pacific Conference Series, Vol. 232, The New Era of Wide Field Astronomy, ed. R. Clowes, A. Adamson, & G. Bromage, 229
- Digel et al. (1994) Digel, S., de Geus, E., & Thaddeus, P. 1994, ApJ, 422, 92
- Dobbs et al. (2011) Dobbs, C. L., Burkert, A., & Pringle, J. E. 2011, MNRAS, 413, 2935
- Drimmel et al. (2003) Drimmel, R., Cabrera-Lavers, A., & López-Corredoira, M. 2003, A&A, 409, 205
- Drimmel & Spergel (2001) Drimmel, R., & Spergel, D. N. 2001, ApJ, 556, 181
- Du et al. (2016) Du, X., Xu, Y., Yang, J., et al. 2016, ApJS, 224, 7
- Falgarone et al. (1992) Falgarone, E., Puget, J.-L., & Perault, M. 1992, A&A, 257, 715
- Goodman et al. (2014) Goodman, A. A., Alves, J., Beaumont, C. N., et al. 2014, ApJ, 797, 53
- Hammersley et al. (1995) Hammersley, P. L., Garzon, F., Mahoney, T., & Calbet, X. 1995, MNRAS, 273, 206
- Henderson et al. (1982) Henderson, A. P., Jackson, P. D., & Kerr, F. J. 1982, ApJ, 263, 116
- Heyer & Dame (2015) Heyer, M., & Dame, T. M. 2015, ARA&A, 53, 583
- Heyer et al. (2009) Heyer, M., Krawczyk, C., Duval, J., & Jackson, J. M. 2009, ApJ, 699, 1092
- Heyer et al. (1998) Heyer, M. H., Brunt, C., Snell, R. L., et al. 1998, ApJS, 115, 241
- Heyer et al. (2001) Heyer, M. H., Carpenter, J. M., & Snell, R. L. 2001, ApJ, 551, 852
- Hou & Han (2014) Hou, L. G., & Han, J. L. 2014, A&A, 569, A125
- Hou et al. (2009) Hou, L. G., Han, J. L., & Shi, W. B. 2009, A&A, 499, 473
- Izumi et al. (2014) Izumi, N., Kobayashi, N., Yasui, C., et al. 2014, ApJ, 795, 66
- Jackson et al. (2006) Jackson, J. M., Rathborne, J. M., Shah, R. Y., et al. 2006, ApJS, 163, 145
- Jacq et al. (1988) Jacq, T., Despois, D., & Baudry, A. 1988, A&A, 195, 93
- Kalberla et al. (2005) Kalberla, P. M. W., Burton, W. B., Hartmann, D., et al. 2005, A&A, 440, 775
- Kalberla & Kerp (2009) Kalberla, P. M. W., & Kerp, J. 2009, ARA&A, 47, 27
- Karim & Mamajek (2016) Karim, M. T., & Mamajek, E. 2016, ArXiv e-prints, arXiv:1610.08125
- Kerr (1957) Kerr, F. J. 1957, AJ, 62, 93
- Kobayashi & Tokunaga (2000) Kobayashi, N., & Tokunaga, A. T. 2000, ApJ, 532, 423
- Kobayashi et al. (2008) Kobayashi, N., Yasui, C., Tokunaga, A. T., & Saito, M. 2008, ApJ, 683, 178
- Langer et al. (2014) Langer, W. D., Velusamy, T., Pineda, J. L., Willacy, K., & Goldsmith, P. F. 2014, A&A, 561, A122
- Larson (1981) Larson, R. B. 1981, MNRAS, 194, 809
- Levine et al. (2006) Levine, E. S., Blitz, L., & Heiles, C. 2006, ApJ, 643, 881
- Majaess et al. (2009) Majaess, D. J., Turner, D. G., & Lane, D. J. 2009, MNRAS, 398, 263
- Marshall et al. (2006) Marshall, D. J., Robin, A. C., Reylé, C., Schultheis, M., & Picaud, S. 2006, A&A, 453, 635
- Miville-Deschênes et al. (2017) Miville-Deschênes, M.-A., Murray, N., & Lee, E. J. 2017, ApJ, 834, 57
- Moitinho et al. (2006) Moitinho, A., Vázquez, R. A., Carraro, G., et al. 2006, MNRAS, 368, L77
- Momany et al. (2006) Momany, Y., Zaggia, S., Gilmore, G., et al. 2006, A&A, 451, 515
- Nakagawa et al. (2005) Nakagawa, M., Onishi, T., Mizuno, A., & Fukui, Y. 2005, PASJ, 57, 917
- Oka et al. (2001) Oka, T., Hasegawa, T., Sato, F., et al. 2001, ApJ, 562, 348
- Oort et al. (1958) Oort, J. H., Kerr, F. J., & Westerhout, G. 1958, MNRAS, 118, 379
- Pineda et al. (2013) Pineda, J. L., Langer, W. D., Velusamy, T., & Goldsmith, P. F. 2013, A&A, 554, A103
- Reed (2006) Reed, B. C. 2006, JRASC, 100, 146
- Reid et al. (2014) Reid, M. J., Menten, K. M., Brunthaler, A., et al. 2014, ApJ, 783, 130
- Reshetnikov et al. (2002) Reshetnikov, V., Battaner, E., Combes, F., & Jiménez-Vicente, J. 2002, A&A, 382, 513
- Reshetnikov & Combes (1998) Reshetnikov, V., & Combes, F. 1998, A&A, 337, 9
- Reylé et al. (2009) Reylé, C., Marshall, D. J., Robin, A. C., & Schultheis, M. 2009, A&A, 495, 819
- Rice et al. (2016) Rice, T. S., Goodman, A. A., Bergin, E. A., Beaumont, C., & Dame, T. M. 2016, ApJ, 822, 52
- Roman-Duval et al. (2010) Roman-Duval, J., Jackson, J. M., Heyer, M., Rathborne, J., & Simon, R. 2010, ApJ, 723, 492
- Rudolph et al. (1996) Rudolph, A. L., Brand, J., de Geus, E. J., & Wouterloot, J. G. A. 1996, ApJ, 458, 653
- Russeil (2003) Russeil, D. 2003, A&A, 397, 133
- Schwarzkopf & Dettmar (2001) Schwarzkopf, U., & Dettmar, R.-J. 2001, A&A, 373, 402
- Scoville et al. (1987) Scoville, N. Z., Yun, M. S., Sanders, D. B., Clemens, D. P., & Waller, W. H. 1987, ApJS, 63, 821
- Shan et al. (2012) Shan, W. L., Yang, J., Shi, S. C., et al. 2012, IEEE Transactions on Terahertz Science and Technology, 2, 593
- Shetty et al. (2011) Shetty, R., Glover, S. C., Dullemond, C. P., & Klessen, R. S. 2011, MNRAS, 412, 1686
- Sodroski (1991) Sodroski, T. J. 1991, ApJ, 366, 95
- Solomon & Rivolo (1989) Solomon, P. M., & Rivolo, A. R. 1989, ApJ, 339, 919
- Solomon et al. (1987) Solomon, P. M., Rivolo, A. R., Barrett, J., & Yahil, A. 1987, ApJ, 319, 730
- Su et al. (2016) Su, Y., Sun, Y., Li, C., et al. 2016, ApJ, 828, 59
- Sun et al. (2015) Sun, Y., Xu, Y., Yang, J., et al. 2015, ApJ, 798, L27
- Taylor (2005) Taylor, M. B. 2005, in Astronomical Society of the Pacific Conference Series, Vol. 347, Astronomical Data Analysis Software and Systems XIV, ed. P. Shopbell, M. Britton, & R. Ebert, 29
- Vallée (2008) Vallée, J. P. 2008, AJ, 135, 1301
- Vallée (2014) —. 2014, AJ, 148, 5
- Wolfire et al. (2010) Wolfire, M. G., Hollenbach, D., & McKee, C. F. 2010, ApJ, 716, 1191
- Wouterloot et al. (1990) Wouterloot, J. G. A., Brand, J., Burton, W. B., & Kwee, K. K. 1990, A&A, 230, 21
- Yasui et al. (2006) Yasui, C., Kobayashi, N., Tokunaga, A. T., Terada, H., & Saito, M. 2006, ApJ, 649, 753
- Yasui et al. (2008) —. 2008, ApJ, 675, 443
| Name | Area | scale | Radius | Mass | ||||||||
|---|---|---|---|---|---|---|---|---|---|---|---|---|
| (km s-1) | (km s-1) | (K.km s-1) | (K) | (arcmin2) | (kpc) | (kpc) | (kpc) | (pc) | (102) | (102) | ( pc-2) | |
| (1) | (2) | (3) | (4) | (5) | (6) | (7) | (8) | (9) | (10) | (11) | (12) | (13) |
| MWISP G34.7671.483 | -46.2 | 1.0 | 2.0 | 2.0 | 1.2 | 17.9 | 12.1 | -0.5 | 2.4 | 2.3 | 4.6 | 13.0 |
| MWISP G34.7921.517 | -48.1 | 1.1 | 1.9 | 1.7 | 3.4 | 18.2 | 12.3 | 0.5 | 5.0 | 5.0 | 12.7 | 6.4 |
| MWISP G34.8420.950 | -45.1 | 2.2 | 5.9 | 2.5 | 9.7 | 17.8 | 11.9 | -0.3 | 8.8 | 26.5 | 92.6 | 10.9 |
| MWISP G36.3752.750 | -53.5 | 1.9 | 2.9 | 1.5 | 2.2 | 18.5 | 12.8 | 0.9 | 3.9 | 5.0 | 27.9 | 10.7 |
| MWISP G36.4500.183 | -47.0 | 3.1 | 5.9 | 1.8 | 7.4 | 17.6 | 11.9 | 0.1 | 7.5 | 21.8 | 155.9 | 12.2 |
| MWISP G36.4750.225 | -46.3 | 2.3 | 3.6 | 1.5 | 3.0 | 17.5 | 11.8 | 0.1 | 4.4 | 7.6 | 49.8 | 12.5 |
| MWISP G36.5830.192 | -50.1 | 1.8 | 2.7 | 1.4 | 2.1 | 17.9 | 12.3 | -0.1 | 3.7 | 4.8 | 24.5 | 11.2 |
| MWISP G36.6000.308 | -52.1 | 0.5 | 1.4 | 2.6 | 1.1 | 18.2 | 12.5 | -0.1 | 2.1 | 1.9 | 1.2 | 13.0 |
| MWISP G36.7332.475 | -56.8 | 1.5 | 3.3 | 2.1 | 3.4 | 18.9 | 13.2 | 0.8 | 5.2 | 8.2 | 23.9 | 9.6 |
| MWISP G36.7672.517 | -57.9 | 1.1 | 1.5 | 1.4 | 0.9 | 19.0 | 13.3 | 0.8 | 1.6 | 1.3 | 3.8 | 16.0 |
| MWISP G36.8080.117 | -60.4 | 1.5 | 3.1 | 1.9 | 2.6 | 19.4 | 13.7 | -0.0 | 4.5 | 5.7 | 22.5 | 9.1 |
| MWISP G36.9000.100 | -62.5 | 3.6 | 6.8 | 1.8 | 8.8 | 19.8 | 14.0 | -0.0 | 9.3 | 37.4 | 252.2 | 13.7 |
| MWISP G36.9170.000 | -57.2 | 1.5 | 4.1 | 2.7 | 3.8 | 18.9 | 13.2 | 0.0 | 5.6 | 11.0 | 25.2 | 11.2 |
| MWISP G37.0500.117 | -52.5 | 2.0 | 4.9 | 2.3 | 5.0 | 18.1 | 12.5 | 0.0 | 6.3 | 15.1 | 52.8 | 12.3 |
| MWISP G37.0580.783 | -61.7 | 1.1 | 1.6 | 1.4 | 1.1 | 19.5 | 13.8 | 0.3 | 2.2 | 2.0 | 6.0 | 12.9 |
| MWISP G37.1000.833 | -47.6 | 2.7 | 5.1 | 1.8 | 4.5 | 17.5 | 11.9 | 0.3 | 5.7 | 13.5 | 84.6 | 13.4 |
| MWISP G37.1750.792 | -48.1 | 4.9 | 13.9 | 2.6 | 23.1 | 17.5 | 12.0 | 0.2 | 13.6 | 132.6 | 690.3 | 22.7 |
| MWISP G37.2581.217 | -56.0 | 1.2 | 2.5 | 1.9 | 1.1 | 18.6 | 13.0 | 0.4 | 2.2 | 2.7 | 7.2 | 17.7 |
| MWISP G37.2921.158 | -51.4 | 1.3 | 1.8 | 1.3 | 1.4 | 17.9 | 12.4 | 0.4 | 2.7 | 2.7 | 10.0 | 11.7 |
| MWISP G37.3081.125 | -52.7 | 1.2 | 1.6 | 1.2 | 1.9 | 18.1 | 12.5 | 0.4 | 3.4 | 2.9 | 11.1 | 8.1 |
| MWISP G37.3420.708 | -50.4 | 1.2 | 2.2 | 1.8 | 1.9 | 17.8 | 12.2 | 0.2 | 3.3 | 3.7 | 10.0 | 10.8 |
| MWISP G37.3501.050 | -53.9 | 2.9 | 20.4 | 6.6 | 9.7 | 18.2 | 12.7 | 0.3 | 9.0 | 70.6 | 158.9 | 27.6 |
| MWISP G37.3832.417 | -61.1 | 1.5 | 2.6 | 1.6 | 1.8 | 19.3 | 13.7 | 0.8 | 3.5 | 4.8 | 17.6 | 12.2 |
| MWISP G37.4081.183 | -53.8 | 1.5 | 3.5 | 2.2 | 3.6 | 18.2 | 12.6 | 0.4 | 5.1 | 8.2 | 24.3 | 9.9 |
| MWISP G37.4251.267 | -52.2 | 2.1 | 8.0 | 3.6 | 12.4 | 18.0 | 12.4 | 0.4 | 10.2 | 43.8 | 92.8 | 13.5 |
| MWISP G37.4331.200 | -53.6 | 0.9 | 1.9 | 2.0 | 5.0 | 18.2 | 12.6 | 0.4 | 6.3 | 8.1 | 10.8 | 6.6 |
| MWISP G37.4501.300 | -51.6 | 1.8 | 2.7 | 1.4 | 1.8 | 17.9 | 12.4 | 0.4 | 3.2 | 3.1 | 20.9 | 9.8 |
| MWISP G37.4671.325 | -54.0 | 1.7 | 4.4 | 2.5 | 1.8 | 18.2 | 12.7 | 0.4 | 3.3 | 5.1 | 19.4 | 14.4 |
| MWISP G37.4672.700 | -57.7 | 1.9 | 4.2 | 2.0 | 3.5 | 18.8 | 13.2 | 0.9 | 5.2 | 10.0 | 41.5 | 11.6 |
| MWISP G37.4750.600 | -51.0 | 1.5 | 4.2 | 2.6 | 2.3 | 17.8 | 12.3 | 0.2 | 3.8 | 4.9 | 18.7 | 10.7 |
| MWISP G37.4751.242 | -53.8 | 1.6 | 2.5 | 1.4 | 4.3 | 18.2 | 12.6 | 0.4 | 5.8 | 9.0 | 31.5 | 8.6 |
| MWISP G37.4921.333 | -51.4 | 0.8 | 1.5 | 1.8 | 1.3 | 17.9 | 12.3 | 0.4 | 2.4 | 2.0 | 2.9 | 10.7 |
| MWISP G37.5000.508 | -50.8 | 2.0 | 2.5 | 1.2 | 1.0 | 17.8 | 12.3 | 0.2 | 1.9 | 1.4 | 16.9 | 11.9 |
| MWISP G37.5000.592 | -51.0 | 1.8 | 2.3 | 1.2 | 1.7 | 17.8 | 12.3 | 0.2 | 3.1 | 3.3 | 21.4 | 10.9 |
| MWISP G37.5920.242 | -49.1 | 2.1 | 4.6 | 2.1 | 3.2 | 17.5 | 12.0 | -0.1 | 4.7 | 10.1 | 43.1 | 14.7 |
| MWISP G37.6001.408 | -58.5 | 1.2 | 1.8 | 1.4 | 2.1 | 18.9 | 13.3 | 0.5 | 3.9 | 3.5 | 10.8 | 7.4 |
| MWISP G37.6080.833 | -48.5 | 2.8 | 4.4 | 1.5 | 9.7 | 17.4 | 12.0 | 0.3 | 8.6 | 27.1 | 143.3 | 11.5 |
| MWISP G37.6172.408 | -54.7 | 1.6 | 2.3 | 1.4 | 2.4 | 18.3 | 12.7 | 0.8 | 4.0 | 4.5 | 20.2 | 8.9 |
| MWISP G37.6332.550 | -60.8 | 1.2 | 2.1 | 1.6 | 1.6 | 19.2 | 13.6 | 0.9 | 3.1 | 3.0 | 9.3 | 9.6 |
| MWISP G37.6421.400∗ | -47.1 | 2.1 | 5.8 | 2.6 | 9.3 | 17.2 | 11.8 | 0.4 | 8.4 | 31.8 | 79.8 | 14.4 |
| MWISP G37.6670.850 | -48.4 | 1.2 | 1.7 | 1.4 | 1.2 | 17.4 | 11.9 | 0.3 | 2.2 | 1.9 | 6.6 | 12.5 |
| MWISP G37.6671.267 | -57.8 | 3.2 | 14.7 | 4.4 | 19.6 | 18.7 | 13.1 | 0.4 | 13.4 | 106.7 | 282.5 | 19.0 |
| MWISP G37.6830.533 | -52.7 | 2.3 | 4.2 | 1.7 | 2.2 | 18.0 | 12.5 | 0.2 | 3.7 | 6.4 | 42.6 | 14.7 |
| MWISP G37.7081.367 | -51.8 | 2.4 | 15.8 | 6.3 | 26.0 | 17.8 | 12.3 | 0.4 | 14.8 | 138.7 | 172.5 | 20.3 |
| MWISP G37.7081.125 | -57.8 | 2.6 | 3.9 | 1.4 | 7.5 | 18.7 | 13.1 | 0.4 | 8.1 | 22.5 | 113.4 | 11.1 |
| MWISP G37.7170.442 | -51.0 | 1.2 | 2.5 | 2.0 | 4.9 | 17.7 | 12.2 | -0.1 | 6.0 | 10.2 | 17.5 | 8.9 |
| MWISP G37.7421.258 | -54.8 | 1.7 | 3.5 | 2.0 | 2.9 | 18.2 | 12.7 | 0.4 | 4.5 | 7.3 | 26.3 | 11.4 |
| MWISP G37.7421.183 | -56.8 | 1.1 | 1.5 | 1.3 | 4.8 | 18.5 | 13.0 | 0.4 | 6.2 | 8.6 | 15.3 | 7.1 |
| MWISP G37.7581.392 | -51.8 | 2.6 | 15.3 | 5.5 | 13.9 | 17.8 | 12.3 | 0.4 | 10.7 | 80.2 | 154.4 | 22.4 |
| MWISP G37.7671.783 | -61.6 | 1.4 | 2.0 | 1.4 | 1.3 | 19.3 | 13.7 | 0.6 | 2.6 | 2.3 | 10.5 | 11.0 |
| MWISP G37.7921.275 | -52.9 | 1.2 | 3.3 | 2.6 | 2.5 | 18.0 | 12.5 | 0.4 | 4.1 | 6.4 | 12.5 | 12.3 |
| MWISP G37.8001.142 | -57.2 | 1.0 | 2.5 | 2.4 | 5.4 | 18.6 | 13.0 | 0.4 | 6.7 | 10.7 | 13.6 | 7.7 |
| MWISP G37.8082.175 | -51.1 | 1.2 | 2.0 | 1.6 | 2.4 | 17.7 | 12.3 | 0.7 | 3.9 | 3.8 | 11.3 | 8.1 |
| MWISP G37.8171.792 | -63.0 | 2.3 | 3.9 | 1.6 | 2.8 | 19.5 | 13.9 | 0.6 | 4.8 | 7.9 | 54.1 | 11.1 |
| MWISP G37.8170.092∗ | -47.9 | 1.9 | 7.4 | 3.7 | 13.8 | 17.3 | 11.9 | 0.0 | 10.3 | 54.1 | 74.8 | 16.2 |
| MWISP G37.8331.392 | -52.1 | 1.7 | 3.5 | 1.9 | 5.7 | 17.8 | 12.4 | 0.4 | 6.6 | 15.3 | 38.7 | 11.2 |
| MWISP G37.8420.150† | -45.9 | 3.2 | 7.3 | 2.2 | 8.7 | 17.0 | 11.6 | 0.0 | 8.0 | 35.6 | 168.6 | 17.9 |
| MWISP G37.8672.383 | -54.8 | 0.9 | 1.8 | 1.8 | 4.4 | 18.2 | 12.7 | 0.8 | 5.8 | 7.8 | 10.9 | 7.3 |
| MWISP G37.9421.525 | -56.3 | 2.4 | 3.5 | 1.4 | 5.9 | 18.4 | 12.9 | 0.5 | 7.0 | 14.1 | 81.4 | 9.3 |
| MWISP G38.0502.500 | -54.1 | 1.3 | 2.0 | 1.4 | 2.3 | 18.0 | 12.6 | 0.8 | 3.9 | 3.6 | 14.8 | 7.4 |
| MWISP G38.0580.983 | -62.2 | 2.6 | 6.0 | 2.1 | 3.9 | 19.3 | 13.7 | 0.3 | 5.7 | 16.7 | 83.8 | 16.2 |
| MWISP G38.0920.458 | -48.3 | 1.9 | 3.3 | 1.6 | 3.1 | 17.3 | 11.9 | 0.1 | 4.5 | 7.3 | 34.6 | 11.4 |
| MWISP G38.1172.050 | -54.6 | 2.0 | 3.9 | 1.8 | 5.5 | 18.1 | 12.6 | 0.6 | 6.6 | 14.9 | 53.8 | 11.0 |
| MWISP G38.1501.333 | -52.0 | 0.9 | 1.8 | 2.0 | 4.1 | 17.7 | 12.3 | 0.4 | 5.5 | 6.0 | 8.6 | 6.4 |
| MWISP G38.1750.917 | -62.5 | 2.4 | 3.2 | 1.3 | 2.2 | 19.3 | 13.7 | 0.3 | 4.0 | 5.1 | 46.3 | 10.2 |
| MWISP G38.2330.342 | -49.7 | 0.8 | 2.2 | 2.5 | 1.7 | 17.4 | 12.0 | -0.1 | 2.9 | 2.3 | 4.1 | 8.6 |
| MWISP G38.3170.908 | -49.4 | 2.7 | 12.4 | 4.3 | 15.3 | 17.4 | 12.0 | 0.3 | 10.9 | 109.5 | 166.3 | 29.2 |
| MWISP G38.4582.750 | -55.8 | 1.5 | 4.0 | 2.5 | 2.8 | 18.2 | 12.7 | 0.9 | 4.4 | 6.1 | 21.5 | 9.9 |
| MWISP G38.4921.200 | -50.4 | 1.1 | 4.9 | 4.2 | 5.0 | 17.4 | 12.1 | 0.4 | 6.0 | 13.2 | 14.9 | 11.7 |
| MWISP G38.5330.892 | -54.6 | 2.3 | 4.7 | 2.0 | 11.5 | 18.0 | 12.6 | 0.3 | 9.8 | 36.6 | 105.9 | 12.2 |
| MWISP G38.5500.908 | -54.5 | 2.6 | 4.9 | 1.8 | 11.3 | 18.0 | 12.6 | 0.3 | 9.6 | 37.1 | 137.9 | 12.8 |
| MWISP G38.5581.600 | -55.3 | 0.9 | 1.7 | 1.9 | 4.2 | 18.1 | 12.7 | 0.5 | 5.7 | 6.1 | 8.9 | 6.1 |
| MWISP G38.6421.842 | -56.1 | 3.0 | 4.6 | 1.5 | 2.3 | 18.2 | 12.8 | 0.6 | 3.8 | 6.4 | 70.9 | 13.7 |
| MWISP G38.7081.200 | -50.1 | 1.7 | 2.6 | 1.4 | 3.3 | 17.3 | 12.0 | 0.4 | 4.7 | 6.7 | 28.1 | 9.5 |
| MWISP G38.7752.917 | -58.1 | 1.6 | 2.4 | 1.4 | 1.1 | 18.4 | 13.0 | 0.9 | 2.1 | 1.7 | 11.3 | 12.2 |
| MWISP G39.0002.242 | -60.3 | 3.8 | 5.4 | 1.3 | 4.5 | 18.6 | 13.3 | 0.7 | 6.1 | 11.3 | 181.1 | 9.8 |
| MWISP G39.0751.592 | -51.1 | 1.0 | 2.0 | 1.9 | 2.2 | 17.4 | 12.1 | 0.5 | 3.6 | 3.8 | 7.3 | 9.2 |
| MWISP G39.1751.425 | -55.6 | 3.3 | 11.0 | 3.1 | 19.2 | 17.9 | 12.6 | -0.4 | 12.7 | 69.9 | 290.8 | 13.8 |
| MWISP G39.2251.542 | -54.6 | 1.6 | 2.1 | 1.2 | 2.8 | 17.8 | 12.5 | -0.5 | 4.3 | 4.8 | 23.8 | 8.3 |
| MWISP G39.3421.400 | -59.2 | 2.0 | 4.1 | 1.9 | 6.4 | 18.4 | 13.1 | 0.4 | 7.3 | 15.1 | 61.7 | 9.1 |
| MWISP G39.4920.667∗† | -49.1 | 2.3 | 11.6 | 4.8 | 13.7 | 17.0 | 11.8 | 0.2 | 10.1 | 63.3 | 110.2 | 19.7 |
| MWISP G39.5002.125 | -53.0 | 1.7 | 2.5 | 1.4 | 1.8 | 17.5 | 12.3 | 0.6 | 3.2 | 3.4 | 18.5 | 10.7 |
| MWISP G39.6751.400 | -58.6 | 1.0 | 2.2 | 2.1 | 4.2 | 18.2 | 12.9 | 0.4 | 5.7 | 7.5 | 11.3 | 7.3 |
| MWISP G39.6831.867 | -54.4 | 1.2 | 2.1 | 1.7 | 0.9 | 17.6 | 12.4 | 0.6 | 1.6 | 1.4 | 4.7 | 18.6 |
| MWISP G39.7752.992 | -56.6 | 1.4 | 3.1 | 2.1 | 6.9 | 17.9 | 12.7 | 0.9 | 7.4 | 14.9 | 29.4 | 8.7 |
| MWISP G39.8831.492 | -60.3 | 1.3 | 2.3 | 1.6 | 2.2 | 18.4 | 13.1 | 0.5 | 3.9 | 4.3 | 14.2 | 9.1 |
| MWISP G39.9080.958 | -50.9 | 2.5 | 5.9 | 2.2 | 8.8 | 17.1 | 12.0 | 0.3 | 8.1 | 24.3 | 103.5 | 11.9 |
| MWISP G39.9081.058∗ | -50.9 | 3.2 | 9.9 | 2.9 | 11.0 | 17.1 | 12.0 | 0.3 | 9.1 | 46.0 | 192.8 | 17.8 |
| MWISP G39.9830.908 | -52.0 | 1.9 | 4.5 | 2.3 | 2.2 | 17.2 | 12.1 | 0.3 | 3.6 | 6.3 | 26.9 | 15.0 |
| MWISP G40.0670.700 | -52.6 | 0.8 | 1.9 | 2.1 | 1.8 | 17.3 | 12.1 | 0.2 | 3.1 | 2.5 | 4.8 | 8.1 |
| MWISP G40.0922.758 | -62.0 | 2.1 | 4.4 | 1.9 | 3.2 | 18.5 | 13.3 | 0.9 | 4.9 | 10.2 | 46.6 | 13.7 |
| MWISP G40.2921.150∗† | -50.6 | 3.1 | 12.5 | 3.8 | 4.8 | 17.0 | 11.9 | 0.3 | 5.7 | 20.1 | 111.7 | 19.8 |
| MWISP G40.3171.542 | -56.1 | 2.7 | 10.1 | 3.5 | 13.3 | 17.7 | 12.5 | 0.5 | 10.3 | 49.2 | 160.0 | 14.7 |
| MWISP G40.3420.592 | -55.2 | 1.7 | 4.5 | 2.5 | 1.5 | 17.5 | 12.4 | 0.2 | 2.7 | 4.9 | 16.6 | 21.7 |
| MWISP G40.3504.775 | -61.1 | 1.9 | 3.4 | 1.7 | 4.5 | 18.3 | 13.1 | 1.5 | 5.9 | 7.7 | 42.7 | 7.0 |
| MWISP G40.3921.550 | -61.0 | 1.7 | 3.6 | 2.0 | 2.0 | 18.3 | 13.1 | 0.5 | 3.5 | 4.5 | 21.7 | 11.5 |
| MWISP G40.4083.133 | -61.7 | 1.7 | 2.7 | 1.5 | 2.8 | 18.4 | 13.2 | 1.0 | 4.5 | 5.3 | 27.8 | 8.4 |
| MWISP G40.4331.208 | -52.1 | 3.3 | 5.1 | 1.4 | 7.3 | 17.1 | 12.0 | 0.4 | 7.3 | 17.5 | 171.8 | 10.4 |
| MWISP G40.4421.150∗† | -50.0 | 3.1 | 6.2 | 1.9 | 4.0 | 16.9 | 11.8 | 0.3 | 5.1 | 12.4 | 104.8 | 15.0 |
| MWISP G40.4831.292 | -58.0 | 2.0 | 2.9 | 1.4 | 2.8 | 17.9 | 12.7 | 0.4 | 4.4 | 4.1 | 36.2 | 6.9 |
| MWISP G40.5001.517 | -60.4 | 2.1 | 3.7 | 1.7 | 2.4 | 18.2 | 13.0 | 0.5 | 4.1 | 7.3 | 37.2 | 14.1 |
| MWISP G40.5171.150 | -53.9 | 4.3 | 5.9 | 1.3 | 5.1 | 17.3 | 12.2 | 0.3 | 6.0 | 12.9 | 239.5 | 11.3 |
| MWISP G40.5331.267† | -50.2 | 5.3 | 14.3 | 2.6 | 13.8 | 16.9 | 11.8 | 0.4 | 10.0 | 57.7 | 585.3 | 18.2 |
| MWISP G40.5581.092 | -53.9 | 2.8 | 4.2 | 1.4 | 2.3 | 17.3 | 12.2 | 0.3 | 3.7 | 5.8 | 63.1 | 13.5 |
| MWISP G40.5921.517 | -58.7 | 2.7 | 6.7 | 2.4 | 6.3 | 17.9 | 12.8 | 0.5 | 7.0 | 25.0 | 105.4 | 16.2 |
| MWISP G40.6001.325 | -57.1 | 1.4 | 3.3 | 2.3 | 3.8 | 17.7 | 12.6 | 0.4 | 5.2 | 8.0 | 20.7 | 9.3 |
| MWISP G40.6333.117 | -55.9 | 2.4 | 4.3 | 1.7 | 9.5 | 17.5 | 12.5 | 1.0 | 8.6 | 25.0 | 103.4 | 10.8 |
| MWISP G40.6332.383 | -59.2 | 2.6 | 5.0 | 1.8 | 4.8 | 18.0 | 12.9 | 0.7 | 6.1 | 12.3 | 89.1 | 10.7 |
| MWISP G40.7671.308 | -57.8 | 1.5 | 2.2 | 1.3 | 7.8 | 17.8 | 12.7 | 0.4 | 7.8 | 10.6 | 38.3 | 5.5 |
| MWISP G40.8251.400 | -57.1 | 3.6 | 7.9 | 2.1 | 15.4 | 17.6 | 12.6 | 0.4 | 11.1 | 58.3 | 298.2 | 14.9 |
| MWISP G40.8253.042 | -58.6 | 1.9 | 3.2 | 1.6 | 1.8 | 17.8 | 12.8 | 0.9 | 3.3 | 3.4 | 24.3 | 10.2 |
| MWISP G40.8331.300 | -55.7 | 2.6 | 8.8 | 3.2 | 20.5 | 17.5 | 12.4 | 0.4 | 12.8 | 58.6 | 184.2 | 11.4 |
| MWISP G40.8331.925 | -60.7 | 2.3 | 6.0 | 2.4 | 25.0 | 18.1 | 13.0 | 0.6 | 14.7 | 80.6 | 168.2 | 11.8 |
| MWISP G40.8580.425 | -58.5 | 3.7 | 5.8 | 1.5 | 5.1 | 17.8 | 12.7 | 0.1 | 6.2 | 9.6 | 178.4 | 7.9 |
| MWISP G40.8672.558 | -62.5 | 2.4 | 4.6 | 1.8 | 3.7 | 18.4 | 13.3 | 0.8 | 5.4 | 12.7 | 64.7 | 14.1 |
| MWISP G40.8830.492 | -54.9 | 3.8 | 9.0 | 2.2 | 9.4 | 17.4 | 12.3 | 0.1 | 8.5 | 30.7 | 250.6 | 13.7 |
| MWISP G40.8921.308 | -57.1 | 2.2 | 8.6 | 3.6 | 8.9 | 17.6 | 12.6 | 0.4 | 8.3 | 34.5 | 86.5 | 15.9 |
| MWISP G40.9001.842 | -56.8 | 1.8 | 4.7 | 2.4 | 27.0 | 17.6 | 12.5 | 0.6 | 14.8 | 67.9 | 102.9 | 9.8 |
| MWISP G40.9251.267 | -56.6 | 0.7 | 2.1 | 2.8 | 3.9 | 17.5 | 12.5 | 0.4 | 5.2 | 6.9 | 5.7 | 7.9 |
| MWISP G40.9252.983 | -56.1 | 1.5 | 2.3 | 1.4 | 1.7 | 17.5 | 12.4 | 0.9 | 3.0 | 2.7 | 14.7 | 9.3 |
| MWISP G40.9421.208 | -56.9 | 1.6 | 2.7 | 1.6 | 2.2 | 17.6 | 12.5 | 0.4 | 3.7 | 3.4 | 19.9 | 8.2 |
| MWISP G40.9422.542 | -59.4 | 1.1 | 1.6 | 1.4 | 2.0 | 17.9 | 12.8 | 0.8 | 3.4 | 3.0 | 8.8 | 8.0 |
| MWISP G40.9582.483 | -59.3 | 1.9 | 7.1 | 3.5 | 4.2 | 17.9 | 12.8 | 0.8 | 5.6 | 17.8 | 42.6 | 18.0 |
| MWISP G40.9580.500 | -57.5 | 1.5 | 1.9 | 1.2 | 2.3 | 17.7 | 12.6 | 0.2 | 3.8 | 4.5 | 18.3 | 10.1 |
| MWISP G40.9582.975 | -58.4 | 1.7 | 2.5 | 1.3 | 2.9 | 17.8 | 12.7 | 0.9 | 4.4 | 4.5 | 28.1 | 7.4 |
| MWISP G40.9672.958 | -60.8 | 1.6 | 3.4 | 2.0 | 3.5 | 18.1 | 13.0 | 0.9 | 5.1 | 7.7 | 26.2 | 9.6 |
| MWISP G40.9920.358 | -53.7 | 1.0 | 1.7 | 1.5 | 1.0 | 17.2 | 12.2 | 0.1 | 1.9 | 1.4 | 4.1 | 12.0 |
| MWISP G41.0080.492 | -58.6 | 2.4 | 4.0 | 1.6 | 2.5 | 17.8 | 12.7 | 0.2 | 4.0 | 4.8 | 48.6 | 9.4 |
| MWISP G41.0082.758 | -61.5 | 1.5 | 2.3 | 1.4 | 1.6 | 18.2 | 13.1 | 0.9 | 3.0 | 2.8 | 15.0 | 9.7 |
| MWISP G41.0672.683 | -63.6 | 2.1 | 5.9 | 2.6 | 9.7 | 18.5 | 13.4 | 0.9 | 9.1 | 36.5 | 83.7 | 14.0 |
| MWISP G41.1331.550 | -58.7 | 1.1 | 2.3 | 1.9 | 1.2 | 17.8 | 12.7 | 0.5 | 2.3 | 1.8 | 6.0 | 10.7 |
| MWISP G41.2001.142 | -66.7 | 1.5 | 3.0 | 1.9 | 1.6 | 18.9 | 13.8 | 0.4 | 3.1 | 3.1 | 14.0 | 10.6 |
| MWISP G41.2171.167 | -59.6 | 0.9 | 1.4 | 1.5 | 1.4 | 17.9 | 12.8 | 0.4 | 2.7 | 2.0 | 4.2 | 9.2 |
| MWISP G41.3082.000 | -57.6 | 1.6 | 6.1 | 3.5 | 2.9 | 17.6 | 12.6 | 0.6 | 4.3 | 8.6 | 24.7 | 14.4 |
| MWISP G41.3251.925 | -57.8 | 1.2 | 2.0 | 1.6 | 2.1 | 17.6 | 12.6 | 0.6 | 3.5 | 3.1 | 10.3 | 7.8 |
| MWISP G41.3421.708 | -61.4 | 2.3 | 3.8 | 1.5 | 2.6 | 18.1 | 13.0 | 0.5 | 4.2 | 5.9 | 47.3 | 10.7 |
| MWISP G41.3671.892 | -59.4 | 1.7 | 4.3 | 2.4 | 10.8 | 17.8 | 12.8 | 0.6 | 9.3 | 31.9 | 54.3 | 11.7 |
| MWISP G41.3751.183 | -59.2 | 1.5 | 4.3 | 2.8 | 3.1 | 17.8 | 12.8 | 0.4 | 4.6 | 8.7 | 21.3 | 13.0 |
| MWISP G41.4171.975 | -59.6 | 1.8 | 3.0 | 1.6 | 2.7 | 17.8 | 12.8 | 0.6 | 4.3 | 5.2 | 28.0 | 9.0 |
| MWISP G41.5001.017 | -59.1 | 2.8 | 6.2 | 2.1 | 21.1 | 17.7 | 12.7 | 0.3 | 13.2 | 60.0 | 221.1 | 11.0 |
| MWISP G41.5831.725 | -60.6 | 1.6 | 4.7 | 2.8 | 7.8 | 17.9 | 12.9 | 0.5 | 7.9 | 20.1 | 40.6 | 10.3 |
| MWISP G41.7331.517 | -55.4 | 1.5 | 2.5 | 1.5 | 1.5 | 17.2 | 12.3 | 0.5 | 2.7 | 3.3 | 12.9 | 15.0 |
| MWISP G41.7421.458 | -55.6 | 2.6 | 7.7 | 2.8 | 6.7 | 17.2 | 12.3 | 0.4 | 7.0 | 25.3 | 96.4 | 16.5 |
| MWISP G41.7500.967 | -60.6 | 2.2 | 6.5 | 2.7 | 7.5 | 17.8 | 12.9 | 0.3 | 7.7 | 25.3 | 80.4 | 13.6 |
| MWISP G41.7581.567 | -55.8 | 0.8 | 1.4 | 1.8 | 1.6 | 17.2 | 12.3 | 0.5 | 2.9 | 1.9 | 3.5 | 7.2 |
| MWISP G41.9921.233 | -57.0 | 1.8 | 2.5 | 1.3 | 2.9 | 17.3 | 12.4 | 0.4 | 4.3 | 4.3 | 30.2 | 7.3 |
| MWISP G42.0251.358 | -55.4 | 3.3 | 3.8 | 1.1 | 2.7 | 17.1 | 12.2 | 0.4 | 4.0 | 6.2 | 92.4 | 12.1 |
| MWISP G42.0581.325 | -60.3 | 1.5 | 2.2 | 1.4 | 1.2 | 17.7 | 12.8 | 0.4 | 2.3 | 1.9 | 10.3 | 11.5 |
| MWISP G42.1921.083 | -57.9 | 2.1 | 2.7 | 1.2 | 3.1 | 17.4 | 12.5 | 0.3 | 4.5 | 5.8 | 41.8 | 9.1 |
| MWISP G42.2581.125 | -60.6 | 2.7 | 5.5 | 1.9 | 5.7 | 17.7 | 12.8 | 0.3 | 6.6 | 17.2 | 98.1 | 12.6 |
| MWISP G42.2671.592 | -56.3 | 2.1 | 3.7 | 1.6 | 6.8 | 17.1 | 12.3 | 0.5 | 7.0 | 15.1 | 64.4 | 9.8 |
| MWISP G42.4671.333 | -58.6 | 1.2 | 2.1 | 1.6 | 1.9 | 17.4 | 12.5 | 0.4 | 3.2 | 2.7 | 10.3 | 8.3 |
| MWISP G42.5422.525 | -60.5 | 1.4 | 2.6 | 1.7 | 4.1 | 17.6 | 12.8 | 0.8 | 5.4 | 6.8 | 23.4 | 7.5 |
| MWISP G42.9001.608∗ | -55.6 | 1.6 | 4.2 | 2.5 | 8.2 | 16.9 | 12.2 | 0.5 | 7.6 | 20.2 | 39.2 | 11.0 |
| MWISP G42.9831.317 | -56.3 | 2.3 | 4.9 | 2.0 | 7.2 | 16.9 | 12.2 | 0.4 | 7.1 | 15.8 | 76.6 | 9.9 |
| MWISP G43.0081.342 | -57.6 | 1.8 | 3.2 | 1.6 | 4.1 | 17.1 | 12.4 | 0.4 | 5.3 | 6.0 | 37.2 | 6.9 |
| MWISP G43.2331.283 | -57.1 | 1.6 | 3.4 | 2.0 | 3.5 | 17.0 | 12.3 | 0.4 | 4.8 | 7.7 | 25.6 | 10.8 |
| MWISP G43.2921.742 | -56.6 | 1.3 | 4.0 | 2.8 | 3.9 | 16.9 | 12.2 | 0.5 | 5.0 | 9.5 | 18.8 | 12.0 |
| MWISP G43.8671.308 | -58.2 | 2.0 | 5.9 | 2.8 | 2.7 | 16.9 | 12.3 | 0.4 | 4.1 | 7.4 | 33.6 | 14.1 |
| MWISP G43.9081.425 | -57.3 | 2.5 | 6.4 | 2.4 | 2.8 | 16.8 | 12.2 | 0.4 | 4.1 | 8.2 | 52.1 | 15.6 |
| MWISP G44.1002.483 | -63.4 | 1.1 | 2.3 | 2.0 | 1.2 | 17.5 | 12.9 | 0.8 | 2.3 | 2.0 | 5.5 | 11.8 |
| MWISP G44.1582.525 | -64.5 | 2.4 | 4.7 | 1.9 | 2.3 | 17.6 | 13.0 | 0.8 | 3.8 | 6.3 | 45.7 | 13.8 |
| MWISP G44.1830.167 | -65.0 | 0.8 | 1.9 | 2.1 | 3.7 | 17.7 | 13.1 | -0.1 | 5.1 | 7.5 | 7.2 | 9.3 |
| MWISP G44.3250.208 | -65.2 | 2.0 | 4.2 | 2.0 | 7.0 | 17.7 | 13.1 | -0.1 | 7.3 | 16.3 | 59.1 | 9.6 |
| MWISP G44.4082.275 | -69.2 | 2.2 | 4.4 | 1.9 | 2.8 | 18.2 | 13.6 | 0.7 | 4.5 | 8.5 | 43.5 | 13.5 |
| MWISP G44.4920.717 | -73.1 | 1.8 | 3.2 | 1.7 | 1.4 | 18.8 | 14.1 | 0.2 | 2.8 | 3.4 | 19.2 | 14.2 |
| MWISP G44.5330.525 | -69.8 | 1.4 | 3.0 | 2.1 | 2.8 | 18.3 | 13.7 | 0.2 | 4.4 | 6.5 | 17.3 | 10.6 |
| MWISP G44.5752.608 | -73.2 | 1.0 | 1.5 | 1.4 | 1.7 | 18.8 | 14.1 | 0.9 | 3.2 | 2.6 | 6.7 | 8.1 |
| MWISP G44.6080.650 | -73.2 | 3.1 | 6.3 | 1.9 | 2.4 | 18.8 | 14.1 | 0.2 | 4.2 | 9.6 | 85.0 | 17.5 |
| MWISP G44.7080.967 | -71.1 | 1.0 | 2.5 | 2.3 | 2.0 | 18.4 | 13.8 | 0.3 | 3.5 | 3.2 | 7.4 | 8.2 |
| MWISP G44.7580.392 | -66.4 | 1.3 | 2.4 | 1.7 | 1.3 | 17.7 | 13.2 | 0.1 | 2.5 | 1.9 | 9.2 | 9.8 |
| MWISP G44.8000.658 | -62.1 | 2.6 | 14.4 | 5.2 | 6.0 | 17.1 | 12.7 | 0.2 | 6.5 | 31.1 | 91.8 | 23.2 |
| MWISP G44.9502.417 | -67.2 | 1.4 | 2.6 | 1.8 | 2.6 | 17.8 | 13.3 | 0.7 | 4.1 | 4.2 | 15.9 | 8.0 |
| MWISP G45.2080.958† | -58.9 | 1.9 | 4.4 | 2.2 | 5.5 | 16.6 | 12.3 | 0.3 | 6.1 | 9.2 | 46.7 | 8.0 |
Note. — Column (1): source named by the MWISP project and the peak position of in Galactic Coordinates. Sources marked with * are also listed in Su et al. (2016). Sources marked with with -1.6 + 13.2 km s-1probably lie in the Outer arm. Columns (2)-(5): the single Gaussian fitting results of the brightest CO spectrum of the MCs. Column (6): the solid angle defined by the 3 limits. Columns (7)-(8): heliocentric distance and Galactocentric radius of the cloud, assuming the rotation curve and Galactic parameters obtained by Reid et al. (2014). Column (9): scale height, , . Column (10): equivalent radii of the molecular clouds corrected by the beam size of the telescope. Column (11): cloud mass calculated using cm-2(K km s-1)-1 (Bolatto et al., 2013). Column (12): Viral mass. Column (13): Mass surface density.
| Name () | Name () | Name () |
|---|---|---|
| km s-1 | km s-1 | km s-1 |
| G35.4000.225(-56.0) | G36.6670.133(-59.5) | G37.6001.450(-52.2) |
| G37.9331.308(-48.1) | G37.9421.308(-49.4) | G38.0421.325(-48.9) |
| G38.0501.275(-48.9) | G39.1333.442(-57.6) | G39.7251.317(-55.6) |
| G39.9002.683(-60.0) | G40.5581.342(-55.4) | G40.8751.233(-57.0) |
| G40.9171.150(-57.9) | G40.9170.492(-56.2) | G41.1580.233(-57.5) |
| G41.4332.017(-59.1) | G41.5251.133(-57.8) | G41.5331.058(-57.6) |
| G41.7170.925(-58.6) | G42.8922.242(-67.8) | G43.0082.017(-66.4) |
| G44.3080.825(-68.9) | G44.7251.983(-68.6) |
| Name | / | |||||
|---|---|---|---|---|---|---|
| (km s-1) | (km s-1) | (K.km s-1) | (K) | (K) | ||
| (1) | (2) | (3) | (4) | (5) | (6) | (7) |
| MWISP G34.8420.950 | -45.0(0.09) | 2.3(0.44) | 1.3(0.25) | 0.6 | 4.4 | 0.29 |
| MWISP G37.1750.792 | -48.1(0.15) | 3.6(0.35) | 1.1(0.11) | 0.3 | … | 0.10 |
| MWISP G37.2250.767 | -50.0(0.10) | 2.1(0.29) | 1.5(0.20) | 0.7 | 9.2 | 0.24 |
| MWISP G37.3501.050 | -53.8(0.08) | 1.9(0.23) | 2.7(0.25) | 1.3 | 7.7 | 0.27 |
| MWISP G37.4081.183 | -53.8(0.10) | 0.9(0.29) | 0.6(0.14) | 0.6 | 5.8 | 0.22 |
| MWISP G37.4251.267 | -51.9(0.13) | 1.4(0.31) | 1.1(0.21) | 0.7 | 7.4 | 0.28 |
| MWISP G37.6421.400 | -47.4(0.06) | 0.9(0.21) | 0.3(0.07) | 0.3 | … | 0.12 |
| MWISP G37.6671.267 | -57.8(0.08) | 2.3(0.22) | 2.8(0.25) | 1.1 | 5.3 | 0.26 |
| MWISP G37.6830.533 | -52.7(0.10) | 1.8(0.38) | 1.2(0.22) | 0.6 | 3.4 | 0.27 |
| MWISP G37.7081.367 | -51.6(0.04) | 1.7(0.17) | 2.2(0.20) | 1.3 | 7.1 | 0.26 |
| MWISP G37.7421.258 | -54.5(0.08) | 1.3(0.40) | 0.9(0.20) | 0.6 | 4.0 | 0.25 |
| MWISP G37.8170.092 | -47.9(0.05) | 1.6(0.29) | 1.1(0.18) | 0.7 | 6.7 | 0.23 |
| MWISP G38.0920.458 | -47.9(0.08) | 2.5(0.48) | 0.7(0.13) | 0.3 | … | 0.14 |
| MWISP G38.3170.908 | -49.2(0.06) | 1.7(0.40) | 1.2(0.21) | 0.6 | 10.7 | 0.25 |
| MWISP G38.4921.200 | -50.5(0.10) | 0.5(0.13) | 0.7(0.13) | 1.2 | 7.0 | 0.27 |
| MWISP G38.5330.892 | -54.8(0.14) | 0.9(0.21) | 0.6(0.13) | 0.6 | 8.4 | 0.24 |
| MWISP G39.1751.425 | -55.4(0.09) | 3.7(0.43) | 2.6(0.25) | 0.7 | 4.3 | 0.21 |
| MWISP G39.4920.667 | -49.0(0.07) | 0.9(0.28) | 0.8(0.19) | 0.9 | 14.3 | 0.28 |
| MWISP G39.9081.058 | -50.7(0.09) | 2.0(0.41) | 0.6(0.10) | 0.3 | … | 0.12 |
| MWISP G39.9830.908 | -52.1(0.05) | 0.9(0.16) | 0.8(0.14) | 0.8 | 5.6 | 0.25 |
| MWISP G40.0922.758 | -62.5(0.16) | 1.1(0.18) | 0.9(0.15) | 0.8 | 4.7 | 0.26 |
| MWISP G40.2921.150 | -50.5(0.10) | 1.8(0.27) | 1.5(0.22) | 0.8 | 8.2 | 0.27 |
| MWISP G40.3171.542 | -55.7(0.12) | 3.5(0.59) | 2.4(0.33) | 0.7 | 4.2 | 0.28 |
| MWISP G40.3921.550 | -61.4(0.04) | 2.3(0.52) | 1.3(0.25) | 0.5 | 2.8 | 0.26 |
| MWISP G40.5331.267 | -50.0(0.07) | 4.5(0.68) | 1.4(0.18) | 0.3 | … | 0.13 |
| MWISP G40.5921.517 | -58.4(0.12) | 1.6(0.32) | 1.2(0.21) | 0.7 | 5.4 | 0.27 |
| MWISP G40.6333.117 | -55.8(0.04) | 0.9(0.18) | 0.4(0.07) | 0.4 | … | 0.13 |
| MWISP G40.8331.925 | -61.0(0.09) | 1.0(0.22) | 1.0(0.19) | 0.9 | 6.2 | 0.29 |
| MWISP G40.8830.492 | -54.9(0.04) | 2.7(0.45) | 1.7(0.27) | 0.6 | 5.2 | 0.28 |
| MWISP G40.8921.308 | -57.1(0.18) | 1.5(0.34) | 1.1(0.23) | 0.7 | 7.6 | 0.30 |
| MWISP G40.9422.542 | -53.8(0.12) | 0.9(0.22) | 0.3(0.06) | 0.3 | … | 0.11 |
| MWISP G41.0672.683 | -63.4(0.13) | 1.5(0.32) | 0.6(0.10) | 0.4 | … | 0.13 |
| MWISP G41.3671.892 | -59.7(0.09) | 1.0(0.14) | 0.4(0.06) | 0.3 | … | 0.11 |
| MWISP G43.2921.742 | -56.5(0.15) | 0.8(0.16) | 0.4(0.07) | 0.5 | … | 0.12 |
| MWISP G44.8000.658 | -61.9(0.05) | 2.5(0.35) | 2.4(0.29) | 0.9 | 6.1 | 0.29 |
Note. — Column (1): source named by the MWISP project and the peak position of in Galactic Coordinates. Sources marked with are belong to the same cloud MWISP G37.1750.792. Columns (2)-(5): the single Gaussian fitting results of the brightest 13CO spectrum of the MCs. Column (6): integrated intensity ratio of 12CO and 13CO. Column (7): the rms level of each detection with a velocity resolution of 0.166 km s-1 (those with values larger than 0.2 K are the rms value of a single pixel, otherwise the rms was averaged over nine pixels).