The Warm Circum-Galactic Medium: 105-6 K Gas Associated with a Single Galaxy Halo or with an Entire Group of Galaxies? 111Based on observations with the NASA/ESA Hubble Space Telescope, obtained at the Space Telescope Science Institute, which is operated by AURA, Inc., under NASA contract NAS 5-26555.
Abstract
In preparation for a Hubble Space Telescope (HST) observing project using the Cosmic Origins Spectrograph (COS), the positions of all AGN targets having high- far-UV G130M spectra were cross-correlated with a large catalog of low-redshift galaxy groups homogenously selected from the spectroscopic sample of the Sloan Digital Sky Survey (SDSS). Searching for targets behind only those groups at -0.2 (which places the O VI doublet in the wavelength region of peak COS sensitivity) we identified only one potential -20 target, FBQS 10103003. An O VI-only absorber was found in its G130M spectrum at , close to the redshift of a foreground small group of luminous galaxies at . Because there is no associated Ly absorption, any characterization of this absorber is necessarily minimal; however, the O VI detection likely traces “warm” gas in collisional ionization equilibrium at K. While this discovery is consistent with being interface gas between cooler, photoionized clouds and a hotter intra-group medium, it could also be warm, interface gas associated with the circum-galactic medium (CGM) of the single closest galaxy. In this case a detailed analysis of the galaxy distribution (complete to ) strongly favors the individual galaxy association. This analysis highlights the necessity of both high- COS data and a deep galaxy redshift survey of the region in order to test more rigorously the association of O VI-absorbing gas with a galaxy group. A Cycle 23 HST/COS program currently is targeting 10 UV-bright AGN behind 12 low-redshift galaxy groups to test the warm, group gas hypothesis.
1. Introduction
A detailed knowledge of the Circumgalactic Medium (CGM; a.k.a. gaseous galaxy halo) is necessary for any detailed understanding of galaxy formation and evolution. Recent studies using the ultraviolet spectrographs of the Hubble Space Telescope (HST) have proven critical to recent advances in the field (Tripp et al., 1998; Penton, Stocke, & Shull, 2004; Tumlinson et al., 2011; Prochaska et al., 2011; Stocke et al., 2013; Werk et al., 2013; Bordoloi et al., 2014), including the recognition that the CGM likely contains a comparable number of baryons as found in all the stars and gas in the disks of luminous (L 0.1L∗) late-type galaxies (Tumlinson et al., 2011; Stocke et al., 2013; Werk et al., 2014; Stern et al., 2016; Prochaska et al., 2017; Keeney et al., 2017). Stocke et al. (2013); Stern et al. (2016); Keeney et al. (2017) estimate a CGM cool, photo-ionized gas mass somewhat less than or comparable to the mass in stars and disk gas (10-20% baryon fraction compared to 20% in stars and disk gas; see Table 8 in Stocke et al., 2013), while Werk et al. (2014, COS Halos project); Prochaska et al. (2017, COS Halos project) obtain a limit and a value approximately a factor of 2 higher. While the COS-Halos results suggest that all the spiral galaxy baryons may have been identified already, the other results suggest that up to half the baryons are still “missing”. The unaccounted gas is likely in “warm” (105-6.5 K or hotter gas whose physical conditions, extent and total baryonic content are not well-estimated at the present time Stocke et al. (2014); Werk et al. (2016).
By either mass estimate, the number of “cool” photoionized CGM baryons is sufficient to explain the continuing high star formation rate (SFR) in spiral galaxies (Binney & Tremaine, 1987; Chomiuk & Povich, 2011) and the detailed metallicity history of spiral galaxies like the Milky Way (e.g., the “G dwarf problem”; Larson, 1972; Binney & Tremaine, 1987; Chiappini, Matteucci & Romano, 2001), the number of detected CGM baryons is still less than expected based both on detailed numerical simulations and on the cosmic ratio of baryons to dark matter (e.g., McGaugh et al., 2000; Klypin et al., 2001). Recent accountings by our group suggest that 30-50% of spiral galaxy baryons are still “missing” (Stocke et al., 2013; Keeney et al., 2017) in the sense that they have not been directly detected as yet (Fukugita et al., 1998; Bregman, 2007; Shull et al., 2012). Are these baryons still present in the CGM of massive spirals or have they been ejected out into the Inter-Galactic Medium (IGM) which is enriched in metals by this process?
Sophisticated cosmological, numerical simulations (e.g., Cen & Ostriker, 1999; Davé et al., 1999) as well as scaling relations based on X-ray observations of galaxy clusters and rich galaxy groups, suggest that a hot intra-group gas should surround massive spirals in small galaxy groups in the hard-to-detect temperature range of K (see also Faerman, Sternberg & McKee, 2016). This temperature range is too low to provide thermal bremmstralung emission sufficient to be detected using current X-ray telescopes (Mulchaey, 2000). Instead, Mulchaey et al. (1996) suggested that this K spiral group gas would be most easily detected using absorption-line spectroscopy of background UV-bright sources. Given the expected temperature range for spiral group gas, the UV absorption doublet of O VI 1032, 1038 Å would be the most sensitive indicator. However, the fraction of oxygen which is in the quintuply-ionized state is small (%) in K gas with most of the oxygen being in more highly-ionized states (O VII and O VIII), which are detectable in soft X-ray absorption lines. X-ray spectroscopy of low spectral resolution has provided only possible low-S/N detections of group gas but potential systematic noise in these very long integration Chandra and XMM-Newton observations do not allow definitive detections or non-detections of galaxy groups at this time (Nicastro et al, 2010, 2013; Buote et al., 2009). Potential Local Group detections are also suspect because these can be attributed to the hot halo of the Milky Way itself so that any O VII absorptions detected at have uncertain physical extent and origin (Bregman, 2007). This leaves broad, shallow O VI and Ly UV absorption lines as the best current method for discovering hot gas in galaxy groups. Statistical studies (Stocke et al., 2006; Finn et al., 2016) on the extent to which O VI absorbers are found away from galaxies suggest that metal enriched gas is spread Mpc from its source. This distance is about the diameter of a small galaxy group. If this O VI-absorbing gas fills the volume of small galaxy groups at even modest filling factor, it could account for the remainder of the missing baryons associated with spiral galaxies like the Milky Way.
Savage et al. (2014, Paper 1 hereafter) have used high-S/N=20-50 Far-UV (FUV) spectra obtained with the Cosmic Origins Spectrograph (COS) (Green et al., 2012) on HST to detect and analyze 54 O VI absorbers at low- including 14 systems which are estimated to be at temperatures ( K) too hot to be photoionized gas. The remaining O VI systems found in the Paper 1 study are either cooler than this, suggesting photoionized gas, or have velocity misalignments that preclude conclusive temperature analysis via this method (see Paper 1 for detailed analysis methodology). Two additional O VI absorbers have no associated Ly arguing for very high temperatures where the fraction of H I is too low to be detectable. One of these two is the initial HST/COS discovery based on the demonstration spectrum of PKS 0405123 obtained by the COS Science Team just after installation in Servicing Mission 5 (Savage et al., 2010). Following Paper 1 we will term this potential hot gas reservoir “warm gas” ( K), in contrast both to cool ( K), photo-ionized CGM gas commonly studied using COS FUV spectroscopy and also the hot ( K) intra-group and cluster gas detected with X-ray telescopes.
The few broad, shallow absorptions seen in the “warm” O VILy systems of Paper 1 are not obviously associated with individual foreground galaxies, since these are found well outside the virial radius of the nearest galaxy. In Stocke et al. (2014, Paper 2 hereafter) we make the case that these warm absorbers are associated with entire galaxy groups. If so a simple argument suggests that these warm absorbers are very large and massive enough to account for the remainder of the missing baryons in late-type galaxies; viz. using the warm absorber line density of per unit redshift (Paper 2) in conjunction with the local space density of galaxy groups (Berlind et al., 2006, 2008; Pisani, Ramella & Geller, 2003) requires that these absorbers have appproximate radii of 1 Mpc at high covering factor (larger still if patchy) and therefore are quite massive (; Paper 2). This is comparable to the gas mass in E-dominated groups and poor clusters (Mulchaey, 2000) and is also the amount needed to bring spiral groups up to the cosmic mean baryon-to-dark matter ratio (see also the recent paper by Faerman, Sternberg & McKee, 2016). The large uncertainty in the mass estimate above due to the largely unknown extent and filling factor of the warm, intra-group gas means that the baryon pecentage remaining within the group’s extent is still quite uncertain.
Current numerical simulations differ by factors of 3-5 on the percentage of baryons retained by group-size halos in this critical mass range (). COSMO-Owls (LeBrun et al., 2014), EAGLE (Schaye et al., 2015) and ILLUSTRIS (Genel et al., 2014) find divergent values in this halo mass range. But if all these baryons are retained within the group, then these spiral galaxy groups are close to being “closed boxes”, which has important consequences for galactic evolution. For example, the metallicity and star-formation rate histories then must be reconciled within individual galaxy groups and can be quite different from group-to-group depending upon the group luminosity function and details of the star-formation history. Given these important consequences, the hypothesis of a massive warm gaseous reservoir in spiral galaxy groups needs to be verified.
With these questions in-mind we have initiated an HST/COS program in Cycle 23 to obtain FUV spectra of ten bright AGN targets whose sightlines penetrate galaxy groups selected homogenously from a large new, low- group catalog that represents an extension of Berlind et al. (2006, Paper 3 hereafter). In preparation for this program we searched the HST/COS archive for serendipitous detections of broad, shallow O VI associated with -0.2 galaxy groups from this catalog. Despite having thousands of groups and hundreds of QSO targets to use for this search, only six targets previously observed by COS lie behind a Berlind group in the redshift range which places any potential O VI absorption in the wavelength band of peak COS sensitivity. All but one of these six have FUV spectra with S/N too low for detecting broad, shallow warm absorbers similar to those studied in Papers 1 and 2. However, FBQS 10103003 has medium-quality archival COS data ( at O VI; and at Ly somewhat lesser in quality to what we proposed for in Cycle 23). Here we report the discovery in the FUV spectrum of the bright moderate redshift () AGN FBQS 10103003 of a broad ( km s-1), shallow and symmetrical O VI 1032Å detection at the redshift () of a spiral-rich group (Berlind #49980 at )222We note that this group and its ID are associated with the new group catalog that we have constructed for this paper and does not correspond to any previously published group from Paper 3..
In Section 2 we briefly describe the selection process which allowed this discovery. Section 3 presents the COS spectra of O VI and Ly at the group redshift. Section 4 describes the deep galaxy redshift survey in this region which resulted in 30 galaxies at which are potential group members. The membership of this galaxy group is also described in this Section. A brief discussion of this result and a summary of our Conclusions are presented in Section 5.
2. Sample Search and Selection
To select targets we used a large new catalog of galaxy groups () that was constructed in a similar manner as in Paper 3, but was based on a slightly higher redshift sample (-0.2) from the Sloan Digital Sky Survey (SDSS) Data Release 7 data (Abazajian et al., 2009). Restricting the group redshifts to : (1) allows good SDSS galaxy group membership selection and characterization (estimated total luminosities, sizes and velocity dispersions); (2) facilitates excellent follow-up observations using multi-object galaxy spectroscopy (MOS) on moderate aperture telescopes (already in progress); and (3) allows both the O VI doublet and Ly (as well as Ly, Si III, and other lines of potential interest) to be observed with COS in the highest throughput G130M mode in a single visit. While there is an abundance of groups in the Berlind et al. (2008) catalog and in other catalogs, the O VI doublet is not within the COS passband at those low redshifts. Much of the preferred redshift range for O VI is blueward of the Ly rest wavelength, making an O VI identification more secure even with the detection of a single line in the O VI doublet.
We cross-correlated the groups catalog with a list of bright () background AGN targets. For investigation of a sample of sightlines through groups, we required that the AGN sightline intersect these groups at a range of impact parameters , where is the estimated virial radius of the group based on the estimated virial mass, . The virial mass was assigned by matching the abundance of groups of a given total -band luminosity to the theoretical abundance of dark matter halos of a given mass, as derived from a standard concordance cosmology halo mass function. For our Cycle 23 HST/COS GO program we rejected sightlines which passed within 1.5 virial radii of an individual group galaxy to make sure we were observing group gas, not gas associated with individual galaxies (see e.g., Prochaska et al., 2011; Stocke et al., 2013). This impact parameter is large enough that association of an absorber with a single galaxy is problematical (see Paper 2 and Keeney et al., 2017). But this proved too restrictive a criterion given the limited number of high-S/N spectra in the current COS archive (Danforth et al., 2016).
A high-S/N ( per resolution element at the predicted wavelength of O VI 1032Å) is essential for this program. The symmetrical and aligned O VI and Ly collisionally ionized lines at K are distinct from the large majority of O VILy absorption systems in the Paper 1 sample (and those found in all other samples at lower S/N; e.g., Tumlinson et al., 2011; Borthakur et al., 2013; Bordoloi et al., 2014) since only 14 out of 54 O VI systems from Paper 1 are unambiguously warm gas. Broad, shallow and symmetrical O VI absorbers without associated Ly are due unambiguously to warm, collisionally-ionized gas (see examples in Savage et al., 2010, and Paper 1).
Despite our estimate based on Paper 2 that is required for a warm gas detection, we cross correlated the Berlind groups with with all available HST/COS G130M AGN spectra. Additionally, we discarded the restriction that no individual galaxy can be within 1.5 virial radii of the sightlines. Six matches were found within the bounds of the group virial radius but only FBQS 10103003 possessed a COS G130M spectrum of anywhere near the quality required for a detection like those in Papers 1 and 2. The remaining five targets showed no sign of an O VI absorption near the group redshift; however, an absorption comparably strong to the FBQS 10103003 detection would not have been detected in the other five low-S/N spectra.
Expanding the above procedure to include bright targets not yet observed by HST/COS found one dozen potential candidates, from which we chose ten for observation in Cycle 23. Between the time of our initial search and the HST proposal submission, one of these ten (CSO 1022) was observed in the Cycle 22 HST Guest Observer program #13444 (PI: B. Wakker). That observation will be reported along with the results of our on-going Cycle 23 program at a later time.
3. The O VI-only system in FBQS 10103003
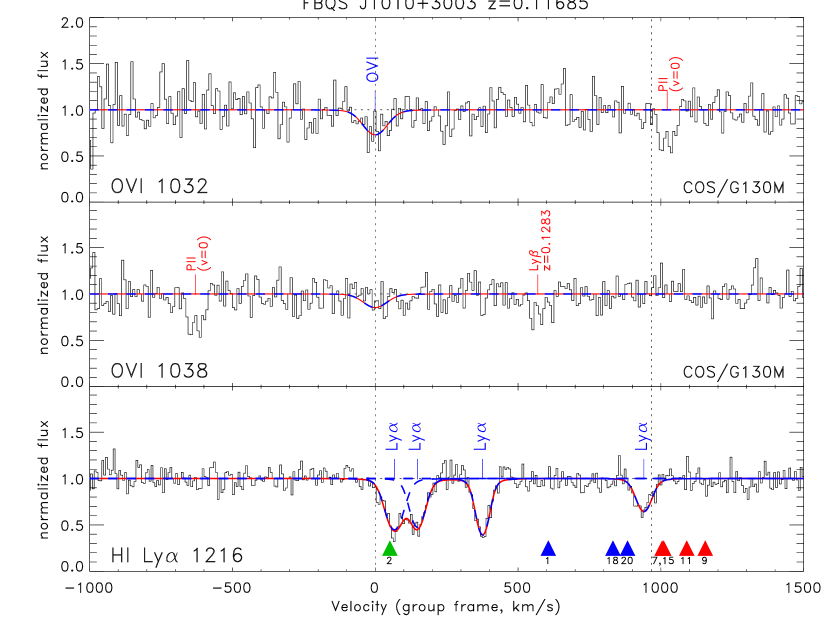
Figure 1 shows the wavelength regions of the normalized FBQS 10103003 COS/G130M spectrum at the O VI doublet (top and middle) and the Ly region (bottom). Each spectral region is presented in velocity space along the x-axis with the origin at the redshift of the O VI absorber (). The FBQS 10103003 COS spectrum was obtained by the COS Science Team as part of its Guaranteed Time Observation (GTO) program and reduced and analyzed as described in Danforth et al. (2016). It has medium-quality with per resolution element at O VI and 20 at Ly somewhat lesser in quality to what was predicted to be required for detection of typical warm absorbers based on previous GTO spectra (Paper 2). Table 1 lists the best-fit Voigt profile particulars for each line.
| Transition | Wavelength | SL | ||||
|---|---|---|---|---|---|---|
| (Å) | (mÅ) | (km s-1) | (cm-2) | () | ||
| O VI 1032 | 1148.80 | 0.113258 | 3.8 | |||
| Ly 1215 | 1353.64 | 0.113508 | 12.5 | |||
| Ly 1215 | 1354.00 | 0.113807 | 10.9 | |||
| Ly 1215 | 1355.03 | 0.114655 | 12.3 | |||
| Ly 1215 | 1357.58 | 0.116752 | 7.8 |
A broad, shallow absorption feature detected at at 1148.80 Å is identified as O VI 1032Å at with and km s-1. Ideally, this identity would be confirmed with a corresponding feature in the weaker line of the doublet at 1155.14Å, however, the expected O VI 1037Å feature would be of low significance (), but its marginal presence in the middle panel of Figure 1 is consistent with its predicted strength, width, and wavelength location based on the 1032Å detection (red and blue-dashed lines in Figure 1). The correlated pixel (fixed-pattern) noise characteristics of the COS detectors have yet to be quantified which makes it impossible to calculate a formal reduced value for the 1037 Å non-detection. However, we can calculate a relative goodness-of-fit for different O VI 1037 absorber scenarios. The 1037 Å line profile predicted by the 1032 Å fit gives a value identical to that of a flat continuum (no absorber) as well as that of an OVI absorber of one third the strength as seen in 1032.
Ly (bottom panel of Figure 2) shows several, narrower, photoionized CGM components most likely associated with individual group galaxies, but there is no Ly absorber that can be associated specifically with the O VI detection.
Identifying an absorption feature based on a single line is risky and we must acknowledge that it is possible that the 1148.8Å feature is not O VI. However, in this case, the list of alternate identifications for this significant absorption feature are extremely meager. The feature’s location blueward of 1216Å rules out a weak Ly forest line (the default identification of weak lines in Danforth et al., 2016). The modest redshift of FBQS J10103003 () means that the only other H I Lyman transitions which could possibly occur at 1148.8Å (Ly , Ly , Ly , etc.) do not show corresponding absorption in stronger Lyman lines at redward portions of the spectrum. O VI is the most commonly-seen metal species in AGN sight lines, but none of the other lines commonly seen in extensive surveys (C IV, Si III, C III Danforth et al., 2016) are consistent with the redshift range and/or the presence of other absorption. There are no Galactic absorption features nor any known COS instrumental features that fall near 1148.8Å. Similarly, the feature is far too narrow to be an intrinsic feature of the AGN continuum itself. O VI 1032Å is the only realistic identification.
There are no other plausible identifications for this absorption line since it is found blueward of the Ly rest wavelength. Metal line locations associated with Ly absorption systems at other redshifts and at the systemic redshift of FBQS 10103003 were checked and there are no reasonable possibilities for this absorption other than O VI. To be conclusqively convincing and to determine a robust -value would require both lines in the doublet to be detected independently. However, the near wavelength coincidence between the O VI and the several Ly absorbers (likely CGM absorption from individual group galaxies; see Figure 1), adds credence to this proposed identification. Clearly, higher S/N data and detections which include an associated broad Ly line will be required to be more definitive in other cases.
This O VI absorber is similar to the case described in detail in Savage et al. (2010) found in the spectrum of PKS 0405123 in which a broad, symmetrical and shallow O VI-only system was discovered. As in that paper we can use the observed O VI line width and the limit on the presence of Ly to roughly bound the temperature and/or metallicity of the gas producing the O VI.
Since the total line width is the quadratic sum of thermal and non-thermal motions: , the measured value for this O VI 1032Å line limits the temperature to K (i.e., assuming ). However, there is considerable uncertainty in the line width due to the finite quality of the data. Taking the full of the fitted -value ( km s-1) under the assumption gives a range of upper limits to the temperature of K.
The absence of obvious irregularities in the line profile of the O VI 1032Å absorption suggests (but does not prove) that the line width is largely thermal, in which case the suggested temperature is K. The absence of corresponding low-ionization metal ions often seen in IGM systems (e.g., Si III) also provides a lower limit on the gas temperature of K, signbificantly hotter than is typical of photoionization equilibrium (PIE) making collisional ionization equilibrium (CIE) far more likely in this case as well. Other highly-ionized metal ions (e.g., C IV, N V) are seen in some other “warm” absorbers, but the relatively weak O VI absorption and the relative abundances of C and N compared to O makes them undetectable in data of this modest quality. We set non-detections for both C IV and N V of . A complete physical discussion showing how an O VI detection and a Ly non-detection lead to CIE and temperatures in excess of K for the few O VI-only systems we have discovered (Savage et al., 2010, and in Paper 2) can be found in Savage et al. (2010).
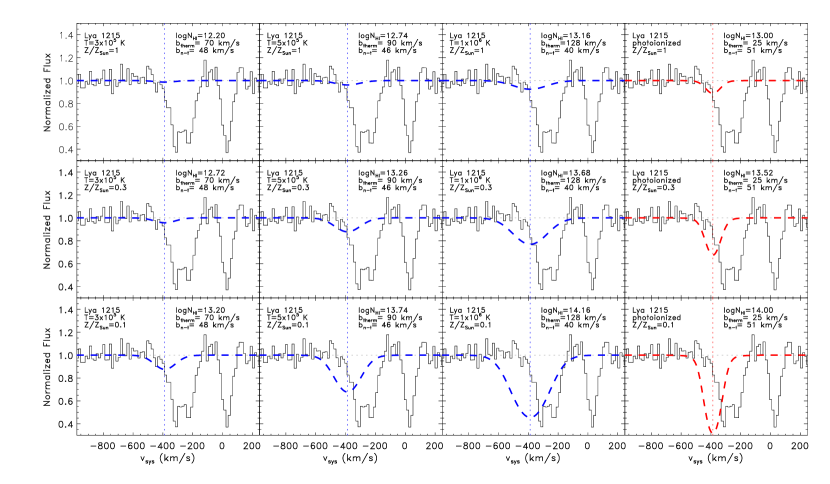
Figure 2 displays a grid of synthetic Ly spectra created assuming the observed O VI column density and line width, CIE and the temperature and metallicity values displayed in each box. While the observational constraints are scant, temperatures near K and higher metallicities () are preferred given the identification of the one observed detection as O VI.
It is possible that the O VI absorber is photoionized at a temperature more typical of the Ly forest rather than WHIM gas. CLOUDY simulations (e.g., those used in Keeney et al., 2017) show that the ratio of ionization fractions of O VI and H I () remain fairly constant over a wide range of ionization parameters at K. Adopting the observed , we infer a characteristic expected for photoionized gas of for a canonical . The observed O VI profile must be broadened almost entirely by non-thermal motions for gas at these low temperatures, so this non-thermal broadening would be present in the inferred Ly profiles as well. We show these predicted Ly profiles under the photoionized scenario and a temperature of K in the fourth column of Figure 2 (red dashed lines). We can rule out photoionization except in the case of solar metallicity or higher.
4. The Galaxy Group Berlind #49980
| ID | Name | Source | |||||
|---|---|---|---|---|---|---|---|
| () | (kpc) | (km s-1) | |||||
| 1 | SDSS J100942.33+295632.8 | SDSS | 0.11551 | 2.158 | 979 | 4.19 | |
| 2 | SDSS J100953.50+300202.2 | SDSS | 0.11345 | 1.980 | 254 | 1.11 | |
| 3 | SDSS J101101.29+300037.7 | SDSS | 0.11206 | 1.886 | 1664 | 7.38 | |
| 4 | SDSS J100915.11+301028.8 | SDSS | 0.11470 | 1.492 | 1510 | 7.29 | |
| 5 | SDSS J101056.25+300740.7 | HYDRA | 0.11472 | 0.967 | 1586 | 8.80 | |
| 6 | SDSS J101033.20+301449.2 | SDSS | 0.11654 | 0.737 | 1669 | 10.15 | |
| 7 | SDSS J100942.65+295705.8 | HYDRA | 0.11701 | 0.530 | 917 | 6.26 | |
| 8 | SDSS J101025.80+300528.4 | HYDRA | 0.11350 | 0.491 | 724 | 5.06 | |
| 9 | SDSS J100943.80+295704.2 | HYDRA | 0.11755 | 0.477 | 903 | 6.35 | |
| 10 | SDSS J101017.08+301437.0 | HYDRA | 0.11642 | 0.426 | 1466 | 10.72 | |
| 11 | SDSS J100939.46+300126.2 | HYDRA | 0.11731 | 0.419 | 619 | 4.56 | |
| 12 | SDSS J101016.94+295635.0 | HYDRA | 0.10727 | 0.404 | 948 | 7.04 | |
| 13 | SDSS J101104.02+295625.4 | HYDRA | 0.11515 | 0.395 | 1908 | 14.28 | |
| 14 | SDSS J100927.32+301231.5 | HYDRA | 0.11635 | 0.255 | 1449 | 12.53 | |
| 15 | SDSS J100918.64+300036.2 | HYDRA | 0.11699 | 0.249 | 1181 | 10.31 | |
| 16 | SDSS J101037.63+295959.0 | HYDRA | 0.11219 | 0.234 | 1078 | 9.61 | |
| 17 | SDSS J100902.90+300632.6 | HYDRA | 0.11578 | 0.232 | 1602 | 14.28 | |
| 18 | SDSS J100945.21+300140.5 | HYDRA | 0.11635 | 0.217 | 466 | 4.25 | |
| 19 | SDSS J101028.73+301520.0 | HYDRA | 0.11695 | 0.213 | 1667 | 15.34 | |
| 20 | SDSS J100940.35+295528.3 | HYDRA | 0.11654 | 0.212 | 1122 | 10.33 |
| ID | Name | |||||
|---|---|---|---|---|---|---|
| () | (kpc) | (kpc) | () | |||
| 18 | SDSS J100945.21+300140.5 | 0.11635 | 0.217 | 466 | 110 | 10.29 |
| 11 | SDSS J100939.46+300126.2 | 0.11731 | 0.419 | 619 | 136 | 10.66 |
| 9 | SDSS J100943.80+295704.2 | 0.11755 | 0.477 | 903 | 142 | 10.02 |
| 7 | SDSS J100942.65+295705.8 | 0.11701 | 0.530 | 917 | 147 | 10.77 |
| 1 | SDSS J100942.33+295632.8 | 0.11551 | 2.158 | 979 | 234 | 11.41 |
| 20 | SDSS J100940.35+295528.3 | 0.11654 | 0.212 | 1122 | 109 | 10.43 |
| 15 | SDSS J100918.64+300036.2 | 0.11699 | 0.249 | 1181 | 115 | 10.03 |
Originally, the group Berlind #49880 consisted of three luminous galaxies culled from a short list of five galaxies from this sky area ( arcminutes in each coordinate) and redshift interval ( km s-1) which are in the SDSS spectroscopic sample. These three galaxies have a mean redshift of , a total estimated halo mass (in solar masses) of and an estimated Mpc. The FBQS 1010 sightline lies at from the group centroid. The second-brightest galaxy in the group is a SB spiral with weak H and [N II] 6584Å emission that is 254 kpc () from the sightline. The absorber/galaxy velocity difference is only 51 km s-1 making an absorber association with this one galaxy entirely plausible. All other group galaxies are farther away from the sightline and at a much larger number of virial radii given that the three other potential group galaxies at an impact parameter Mpc are much less luminous. The two SDSS galaxies not selected for group membership fall just below the luminosity limit of the -0.2 volume-limited sample used to identify groups. It is thus useful to look at this region again in the light of deeper, newly obtained redshift information. The five SDSS galaxies are listed in Table 2 in decreasing luminosity (ID = 1-4 and #6); the first three (ID = 1-3) are the group members initially identified.
In order to characterize the galaxy group associated with this absorber, multi-object spectroscopy (MOS) in the field of FBQS 10103003 was obtained using the HYDRA spectrograph on the Wisconsin-Indiana-Yale-NOAO (WIYN) 3.5-m telescope on Kitt Peak. Spectroscopy in this field is a (small) portion of the galaxy MOS obtained for all COS GTO fields for the purpose of determining the relationship between gas and galaxies in the local universe (B. Keeney et al., in preparation). Details of the observing strategy and particulars, the data handling and the analysis methodology can be found in that paper. Briefly, for studies of the galaxy distribution in this portion of the sky, WIYN/HYDRA MOS covers a 5 Mpc diameter region centered on FBQS 10103003 obtaining viable galaxy spectra for a complete sample of galaxies down to or at the group’s Hubble flow distance. These Hydra spectra were augmented by a few single-object slit spectra obtained at the Apache Point Observatory (APO) 3.5-m telescope with the Dual-Imaging Spectrograph (DIS) in order to ensure that the completeness extends to at least in this region. Twenty-six new galaxy redshifts were obtained which fall within 1000 km s-1 of . The 20 galaxies which are located at Mpc and km s-1 from the sightline are listed in Table 2 in decreasing luminosity order. The basic information in Table 2 includes: (1) numerical designation used herein; (2) the SDSS DR12 galaxy designation which includes the RA and DEC of the galaxy (the QSO target FBQS 10103003 has (RA,DEC) = 10h10m00.7s +30d03m22s; (3) galaxy redshift, where the redshift errors are estimated to be km s-1; (4) the rest-frame -band galaxy luminosity, , in units; (5) the impact parameter () of the galaxy from the sightline in kpc; (6) the impact parameter divided by the galaxy’s virial radius () (see Stocke et al., 2013, for how the virial radius is derived from the stellar luminosity); and (7) the velocity difference () of the galaxy from the absorber in km s-1.
At this point it is worthwhile to discuss briefly the limited meaning of the virial radius (see Table 2) for individual galaxies within the confines of spiral rich groups of galaxies. From a theoretical perspective, the virial radius becomes a less useful terminology and a less-well defined term for “sub-halos” (individual galaxies) within a main halo (a galaxy group). While we recognize the ambiguities in calculating a virial radius for a sub-halo, nevertheless, we use this term herein to mean a characteristic radius for the CGM of an individual galaxy which scales as the total halo mass calculated only from the stellar luminosity; i.e., an galaxy has a halo mass of and a virial radius of kpc (see Figure 1 in Stocke et al., 2013). While the terminology is used in Table 2 and when referring to an individual galaxy, in Table 3 and in the context of galaxy members of a group we will use the term for the characteristic radius of a sub-halo. Numerically, in this paper.
The assumption that an individual galaxy’s CGM is confined largely within the virial radius is based upon a scrutiny of “serendipitously” discovered absorber-galaxy pairs carried out in Stocke et al. (2013) and Keeney et al. (2017). In Keeney et al. (2017) we showed that the association of abosrbers with individual galaxies is quite secure at . Absorbers at larger impact parameters often ( of cases) have ambiguous galaxy associations or are plausibly associated with entire small groups of galaxies (see also Paper 2). Additionally, low-ion metal-bearing absorbers are found at excepting H IO VI-only absorbers which are found out to impact parameters of nearly 1 Mpc from the nearest bright galaxy (Stocke et al., 2006, 2013; Keeney et al., 2017), many of which likely are associated with entire groups of galaxies (Paper 2). But there is no indication that the virial radius (, or in the group context) is a firm boundary for the CGM of an individual galaxy so we use it here only as an indicator that the absorber might or might not be associated with the CGM of an individual galaxy. In this paper, individual galaxies are assigned virial radii and group galaxies an based on their rest-frame -band luminosity using a hybrid method that employs a halo-abundance matching scheme at (Trenti et al., 2010) and assumes at . The halo mass and virial radius as a function of galaxy luminosity are shown in Figure 1 of Stocke et al. (2013).
Returning to the specific case of the FBQS 10103003 sightline at -0.118, we have used the Berlind group finder process of Paper 3 on all 20 galaxy locations and redshifts considered as possible group members. With these new data the original Berlind group fragments into 4-5 groups corresponding to the five brightest galaxies. This is because the numbers of satellite galaxies in this region do not increase with decreasing luminosity as fast as a standard SDSS luminosity function, decreasing the adopted linking length relative to the galaxy separations both in redshift and on the sky. The friends-of-friends method of Paper 3 is more suited to a large homogeneous sample of galaxies rather than the small region around a single group that we have here. We therefore adopt a new approach to establishing group membership, where we start by using each galaxy’s stellar mass to estimate a total halo mass using the observed tight correlation (0.2 dex spread in stellar mass at a fixed halo mass with the converse spread being somewhat larger than this) found by Behroozi, Conroy & Wechsler (2010). This halo mass is likely overestimated because we have ignored the scatter in the stellar-to-halo mass relation, making the group finding err on the side of being inclusive. The total galaxy mass then determines a virial radius, which can be plotted on the sky to determine if these overlap. If a satellite galaxy is encompassed by the projection of this radius on the sky, the velocity difference between the central and satellite galaxy is checked to see if this velocity difference can be accomodated at high (%) probability for a satellite bound to its primary given the inferred halo mass of the primary. This procedure results in three groups and a number of single galaxies in this region. These include a group with five satellites to the most luminous SDSS galaxy and two other groups of two galaxies each around the 3rd and 5th brightest galaxies.
The most abundant group has a mean velocity of with km s-1 and is centered on the brightest galaxy (#1 at and ), which is nearly 1 Mpc away from the sightline and 600 km s-1 from the absorber in velocity (see Figure 1). The six galaxies in this group are listed in Table 3 in order of increasing impact parameter from the AGN sightline, with the following information by column: (1) numerical designation from Table 2; (2) SDSS DR12 galaxy designation; (3) galaxy redshift; (4) the rest-frame -band galaxy luminosity, , in units; (5) the impact parameter of the galaxy from the sightline in kpc; (6) the characteristic radius, , determined as described above; and (7) the stellar mass, , derived from the galaxy’s -band absolute magnitude and rest-frame color using Equation 8 of Taylor et al. (2011). We correct to rest-frame colors and magnitudes using the -corrections of Chilingarian et al. (2010) and Chilingarian & Zolotukhin (2012).
A less conservative approach to group finding which was adopted in Paper 2 uses the friends-of-friends approach but with considerably larger linking lengths (5 times the virial radius for each galaxy) than in Paper 3. Examples of groups identified by this process can be seen in Figure 2 of Paper 2. Since these plots color-code group members and non-members, the examples in Paper 2 show explicitly that in almost all cases, many but not all galaxies in these regions are linked into a single group of galaxies by this method. Similar to the procedure in Paper 3, once the group membership is established, all galaxies (i.e., not just those identified as group members) within of the group redshift and of the group centroid are included in the group. All galaxies surveyed by us at Mpc and km s-1 from the absorber are included in the group finding analysis. This procedure is applied in a iterative fashion until it converges which occurs quickly; i.e., usually in iterations. Because these small groups of galaxies may not be completely virialized (similar to the Local Group), group finding and membership determination are not exact processes; we used both approaches here in order to provide useful bounds on the groups that are present in this region and their memberships. By way of an example, if these two procedures were applied to the Local Group, the less conservative approach of Paper 2 would identify the Milky Way and Andromeda as being members of the same group whereas the more restrictive approach adopted in Paper 3 would identify these two galaxies as being in separate groups.
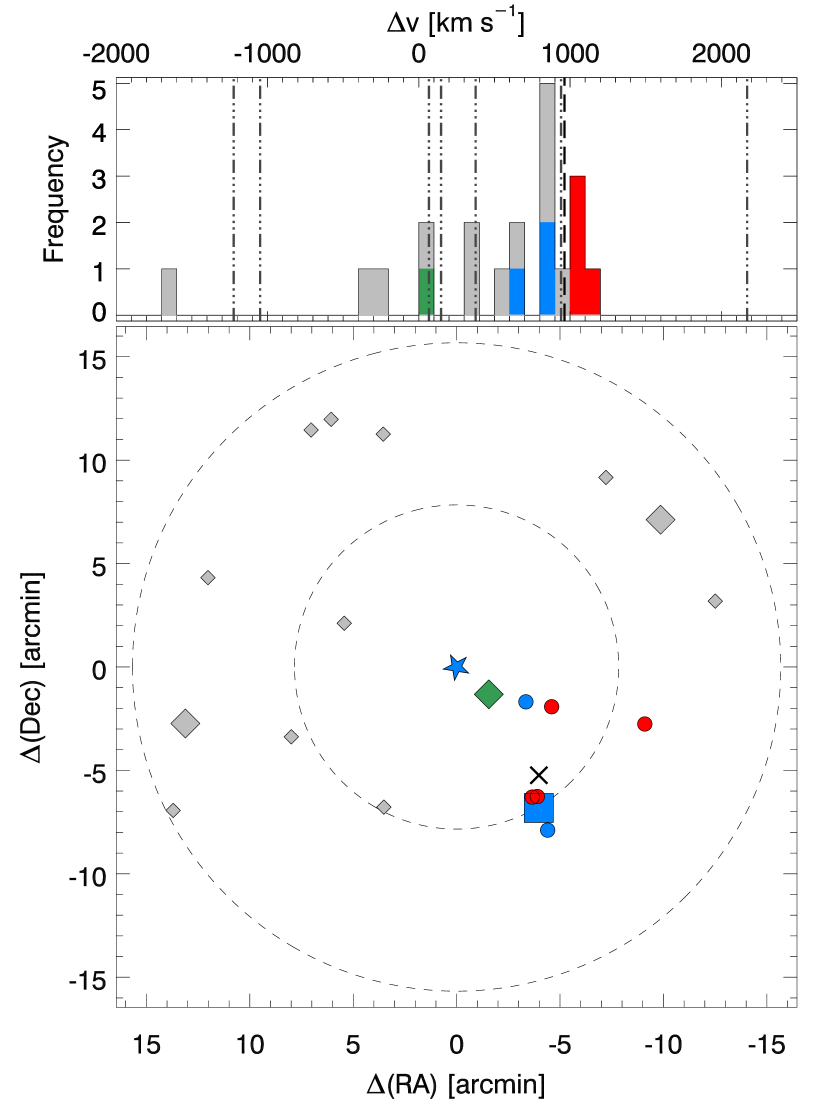
By this procedure a 7 member, group is identified that is almost identical to the group defined by the more conservative approach discussed above. Only galaxy #9 is added and so the group properties have not changed appreciably between these two group finding methods; data for this galaxy have been added to Table 3 of group members. Only one of the three bright galaxies in the original friends-of-friends group (#49880) is included in this newly-defined group. The membership and extent on the sky for this group are shown in Figure 3, which includes all six galaxies identified by the previous procedure plus one other (#9) identified by the more relaxed procedure. In Figure 3 the color-coded symbols are the identified group members with red and blue symbols indicating galaxies that are redshifted and blueshifted respectively from the velocity centroid of , which is 967 km s-1 higher than the absorber velocity. The estimated group barycenter on the sky is marked with a black “” and is 840 kpc from the sightline. The group velocity dispersion of km s-1 (90% confidence interval) is somewhat less than the virialized velocity dispersion of 262 km s-1 (which assumes ; see detailed definition and discussion in Paper 2). This indicates that as defined this group may not yet be fully virialized. The group velocity centroid is from the absorber velocity. As with the smaller group identified by the more conservative process, the group centroid impact parameter and velocity difference from the absorber are substantial.
The values in Tables 2 and 3 for the virial radii of the galaxies in this region use the “hybrid” relationship shown in Figure 1 of Stocke et al. (2013). But converting a total group luminosity into a halo mass and virial radius for the entire group is more problematical. While the Trenti et al. (2010) and Moster et al. (2010) “halo-matching” technique seems relevant to these very large halos, they are most appropriately applied to groups with single, dominant galaxies (i.e., “central” halos), not for the loose group we have identified here. Application of the pure halo-matching correlation shown in Figure 1 of Stocke et al. (2013) to this small group yields a halo mass of and Mpc. But this group is not dominated by a single, very massive galaxy (see Table 3). The loose group we have identified and delineated in Table 3 and Figure 3 has no dominant central galaxy. In this case,the conversion between stellar mass and halo mass is likely to be a shallower function of stellar luminosity (Hearin et al., 2013). The numerical simulation results of Hearin et al. (2013, see their Figure 4) show that there is a % difference in velocity dispersion as a function of richness for small groups with and without a single, dominant galaxy. In the current case this leads to a total estimated halo mass of and kpc for this small group. This places the absorber at . While these values seem appropriate for the small group we have identified, further simulation work is required to clarify “halo matching” schemes for halos appropriate to the sizes of small galaxy groups.
In Figure 3 the diamond symbols are galaxies in this sky and redshift region which are not identified as group members by this process. Specifically not included in the group described above is galaxy #2, which is the closest galaxy to the sightline (colored green in Figure 3). Despite being quite close on the sky to group members, it is not identified as being in this group mostly due to its large v with respect to group galaxies. The O VI absorber has a similarly large v compared to the galaxy group. Galaxy #2 is at a significantly lower velocity than the galaxies in the group (see Figure 3 at top) and has a velocity very close to the O VI and 2 of the Ly absorbers shown in Figure 1.
We believe that these two methods span the reasonable range of algorithms that can be used to define group membership in this region and yet obtain a nearly identical outcome. The absorber impact parameter and velocity difference relative to the identified group are substantial in both cases (see Figure 3). A much closer match is made to the one, nearest galaxy (#2) than to either of these possible group configurations. Therefore, while possible, the association of the warm gas absorber detected in O VI with the group listed in Table 3 is quite unlikely.
The identification of the broad O VI with galaxy #2 is bolstered by the small velocity differences between this luminous, moderately star forming spiral and three Ly-only absorbers shown in Figure 1. The two Ly absorbers close to the O VI absorption are at velocities ( and 148 km s-1) close to the velocity of galaxy #2 ( km s-1). While galaxies #4 and #5 have values quite close to this absorber, these two galaxies are also Mpc from the sightline and are not close to each other on the sky. Association with galaxy #2 seems much more plausible for this Ly absorber as well.
The only absorber which can be plausibly associated with the galaxy group we have identified is the highest redshift Ly line in Figure 1 (the final listing in Table 1) since it has a velocity quite close ( km s-1) to the group velocity centroid. However, this absorber has no associated O VI and is located greater than one group virial radius away on the sky.
In summary, we suggest that the most plausible association of the O VI-only absorber found in the FBQS 1103003 sightlines at is a single luminous galaxy (#2), located from the sightline. This same galaxy is also the most viable associated galaxy for three velocity components of Ly which are close to, but not coincident with, the O VI-only absorber. Three other Ly-only absorbers (whose velocity locations are shown in the velocity histogram at the top of Figure 3) are likely absorbers in IGM filaments in the vicinity of the galaxy distribution shown in the bottom plot of Figure 3.
5. Discussion and Conclusions
The hypothesis put forward in Paper 2 is that warm O VILy absorbers are associated with small galaxy groups and are detections of interface gas between a hotter intra-group medium and the cool, photoionized clouds amply detected in even modest S/N surveys using HST/COS (Tumlinson et al., 2011; Prochaska et al., 2011; Stocke et al., 2013; Werk et al., 2013; Keeney et al., 2017). The methodology followed in Paper 2 was to investigate the galaxies associated with the lowest redshift warm absorbers found in Paper 1; i.e., absorbers were discovered before the galaxy environments were investigated. This process led to some uncertainty about the conclusion that warm absorbers are associated with galaxy groups rather than individual galaxies because both galaxy groups and luminous galaxies are comparably abundant in the low- universe.
In a continuing investigation of this hypothesis, the converse approach is adopted here whereby a homogeneous sample of galaxy groups selected from the SDSS spectroscopic survey by the method of Paper 3 (see also the catalogue of Berlind et al., 2008) is cross-correlated with bright AGN targets that were already observed by HST/COS using the G130M grating. While six matches were found, only one previously-observed FUV AGN spectrum has sufficient S/N to allow a sensitive search for broad, shallow O VI and Ly common to these warm absorbers. The COS/G130M spectrum of FBQS 10103003 shows a broad, shallow O VI absorption feature at , quite close ( km s-1) to the redshift of Berlind group #49980 at (Figure 1). Only the O VI 1032 Å line of the doublet is detected without doubt but there is little ambiguity in the identification because this O VI -only absorption occurs blueward of the Ly rest wavelength.
The observed -value and rather symmetrical O VI 1032Å profile suggest gas in CIE at a temperature of although the constraints on this conclusion are rather loose. Higher metallicities () are also favored but are not required (Figure 2). The absence of both the weaker O VI doublet line and an associated Ly absorption line make the analysis of this absorber inconclusive. When there are solid detections of the broad O VI doublet and Ly, the -values for both species allow a determination of both the thermal and also the turbulent broadening of the gas (Paper 1). Higher S/N FUV spectra than the one analyzed here are required to investigate the warm absorber population further. G130M spectra are being obtained of 10 UV bright targets behind 12 galaxy groups in Cycle 23.
A moderately deep (complete to ) redshift survey was conducted on the FBQS 10103003 field using WIYN/Hydra and the Dual Imaging Spectrograph at the APO 3.5 meter. While the original Paper 3 analysis of this field using the SDSS spectroscopic survey identified a galaxy group consisting of three luminous galaxies, a new friends-of-friends type analysis using the much deeper () WIYN/HYDRA survey also found only one galaxy group of six or seven members in this region plus a number of more isolated galaxies. A strict application of the original Paper 3 approach “fragments” this group into a number of isolated, single galaxies, but a related, and still conservative approach, found a group of six galaxies closely associated with the brightest galaxy in this region at . The remaining galaxies were found to be either isolated galaxies or members of groups of two members only. A less conservative friends-of-friends approach using larger linking lengths also identified a single galaxy group of seven members, the six previously-identified members plus only one additional, lower luminosity galaxy. Because the membership of these potential groups so largely overlaps, they have similar mean redshifts which are several hundred km s-1 greater than the O VI absorber redshift and centroid locations on the sky which are greater than 500 kpc from the sightline. However, the velocity distribution of this larger group does encompass the velocities of the three Ly absorbers also detected in the FBQS 10103003 COS spectrum and there are near coincidences in velocities between these Ly absorbers and individual bright galaxies in this group. We identify these Ly absorbers as cool gas in PIE associated with the individual CGM of these galaxies.
The association between the warm gas detected in O VI and the small foreground group is not clearly made due to both a large impact parameter and a large v. However, the second brightest galaxy in this region, a spiral, is only 254 kpc () from the sightline and has a recession velocity which differs from the O VI absorber velocity by only km s-1. Based on these close correspondences, the warm gas detected in O VI is much more likely associated with this individual spiral galaxy than the entire galaxy group.
While the discovery of a broad, shallow O VI absorber that is demonstrably “warm” in the only viable archival COS spectrum was exciting, it has provided a cautionary tale for the investigation of warm gas in galaxy groups. Despite per resel at the O VI doublet and at the location of Ly, the spectrum was of insufficient quality to fully characterize the absorber due to a marginal detection of O VI 1038 Å. Further, the close proximity (impact parameter ) of the sightline to a single bright galaxy made the interpretation that the warm gas was associated with the entire galaxy group very unlikely. Our Cycle 23 program to use COS spectra to probe low- galaxy groups from an update to the catalog of Paper 3 (GO program #14277; JTS, PI) needs to avoid these possible pitfalls. Higher than found in the FBQS 10103003 spectrum has been proposed for this program. The impact parameters from the chosen AGN sightlines to nearby galaxies have been required to be .
The HST/COS program designed to probe spiral-rich galaxy groups has the potential to discover warm gas associated with galaxy groups, measure its covering factor inside the group virial radius and make a rough estimate of the mass in warm gas in these systems. As support a deep galaxy redshift survey complete to is underway at the MMT Observatory using the Hectospec multi-object spectrograph to characterize these groups in membership, velocity dispersion, and group centroids in velocity and on the plane of the sky. While a virialized intra-group medium for these groups is predicted to be too hot to detect by the broad O VI and broad Ly method (Mulchaey, 2000), detecting the warm interface gas will assist in estimating the properties of this hotter gas. In this paper we have highlighted some of the difficulties in testing the hypothesis of Paper 2 that the warm and hot gas reservoirs in galaxy groups may contain the bulk of the baryons still “missing” from spiral galaxy halos.
Facilities: HST/COS, WIYN, APO 3.5m
6. Acknowledgments
This research was supported by NASA/HST Guest Observing grant #14277 (PI: JTS). BDO’s contributions were supported by a NASA/HST Archive/Theory grant #14308.
References
- Abazajian et al. (2009) Abazajian, K. N., Adelman-McCarthy, J. K., Agüeros, M. A., et al. 2009, ApJS, 182, 543
- Behroozi, Conroy & Wechsler (2010) Behroozi, P.S., Conroy, C. & Wechsler, R.H. 2010, ApJ, 717, 379
- Berlind et al. (2006) Berlind, A.A. et al. 2006, ApJS, 167, 1 (Paper 3)
- Berlind et al. (2008) Berlind, A.A. et al. 2008, yCat, 21670001
- Binney & Tremaine (1987) Binney, J. & Tremaine, S. 1987, Galactic Dynamics (Princeton: Princeton Univ. Press), pp. 567-575
- Bordoloi et al. (2014) Bordoloi, R, Tumlinson, J.T., Werk, J. K. et al. 2014, ApJ, 796, 136
- Borthakur et al. (2013) Borthakur, S., Heckman, T., Strickland, D., Wild, V., & Schiminovich, D., 2013, ApJ, 768, 18
- Bowen et al. (1997) Bowen, D. V., Tolstoy, E., Ferrara, A., Blades, J. C., & Brinks, E. 1997, ApJ, 478, 530
- Bregman (2007) Bregman, J. N. 2007, ARA&A, 45, 221
- Buote et al. (2009) Buote, D. A., Zappacosta, L., Fang, T., et al. 2009, ApJ, 695, 1351
- Cen & Ostriker (1999) Cen, R. & Ostriker, J. P. 1999, ApJ, 514, 1
- Chen, Lanzetta & Webb (2001) Chen, H-W., Lanzetta, K. M. & Webb, J. K. 2001, ApJ, 556, 158
- Chen & Mulchaey (2009) Chen, H.-W. & Mulchaey, J. S. 2009, ApJ, 701, 1219
- Chiappini, Matteucci & Romano (2001) Chiappini, C, Matteucci, F. & Romano, D. 2001, ApJ, 554, 1044
- Chilingarian et al. (2010) Chilingarian, I. V., Melchior, A.-L., & Zolotukhin, I. Y. 2010, MNRAS, 405, 1409
- Chilingarian & Zolotukhin (2012) Chilingarian, I. V. & Zolotukhin, I. Y. 2012, MNRAS, 419, 1727
- Chomiuk & Povich (2011) Chomiuk, L. & Povich, M. S. 2011, AJ, 142, 197
- Danforth & Shull (2008) Danforth, C. W. & Shull, J. M. 2008, ApJ, 679, 194
- Danforth et al. (2016) Danforth, C. W., et al. 2016, ApJ, 817, 111
- Davé et al. (1999) Davé, R., Hernquist, L., Katz, N., & Weinberg, D. H. 1999, ApJ, 511, 521
- Davé & Oppenheimer (2007) Davé, R. & Oppenheimer, B. D. 2007, MNRAS, 374, 427
- Faerman, Sternberg & McKee (2016) Faerman, Y., Strenberg, A. & McKee, C.F. 2016, arXiv160200689F
- Finn et al. (2016) Finn, C.W., Morris, S.L., Tejos, N. et al. 2016, MNRAS, 460, 590
- Fukugita et al. (1998) Fukugita, M., Hogan, C. J., & Peebles, P. J. E. 1998, ApJ, 503, 518
- Genel et al. (2014) Genel, S., Vogelsberger, M., Springel, V., et al. 2014, MNRAS, 445, 175
- Green et al. (2012) Green, J. C., Froning, C. S., Osterman, S., et al. 2012, ApJ, 744, 60
- Haardt & Madau (2012) Haardt, F. & Madau, P. 2012, ApJ, 746, 125
- Hearin et al. (2013) Hearin, A. P., Zentner, A. R., Newman, J. A. & Berlind, A. A., 2013, MNRAS, 430, 1238
- Keeney et al. (2017) Keeney, B. A., Stocke, J.T., Danforth, C.D. et al. 2017, ApJS, submitted
- Klypin et al. (2001) Klypin, A., Kravtsov, A. V., Bullock, J. S. & Primack, J. R. 2001, ApJ, 554, 903
- Larson (1972) Larson, R. B. 1972, MNRAS, 157, 121
- LeBrun et al. (2014) Le Brun, A. M. C., McCarthy, I. G., Schaye, J., & Ponman, T. J., 2014, MNRAS, 441, 1270
- McGaugh et al. (2000) McGaugh, S. S., Schombert, J. M., Bothun, G. D., & de Blok, W. J. G. 2000, ApJ, 533, L99
- Montero-Dorta & Prada (2009) Montero-Dorta, A. D. & Prada, F. 2009, MNRAS, 399, 1106
- Moster et al. (2010) Moster, B. P., Somerville, R. S., Maulbetsch, C., et al. 2010, ApJ, 710, 903
- Mulchaey et al. (1996) Mulchaey, J. S., Mushotzky, R. F., Burstein, D., & Davis, D. S. 1996, ApJ, 456, L5 (M96)
- Mulchaey (2000) Mulchaey, J. S. 2000, ARA&A, 38, 289
- Muzahid (2014) Muzahid, S. 2014, ApJ, 784, 5
- Nicastro et al (2010) Nicastro, F., Krongold, Y., Fields, D. et al. 2010, ApJ, 715, 854
- Nicastro et al (2013) Nicastro, F., Elvis, M., Krongold, Y. et al. 2013 ApJ, 769, 90
- Pagel (2008) Pagel, B.E.J. 2008, in “Pathways through an Eclectic Universe”, ed. J. H. Knapen, T. J. Mahoney, and A. Vazdekis (San Francisco: Astronomical Society of the Pacific), ASP Conference #390, 483
- Penton, Stocke, & Shull (2004) Penton, S. V., Stocke, J. T., & Shull, J. M. 2004, ApJS, 152, 29
- Pisani, Ramella & Geller (2003) Pisani, A., Ramella, M & Geller, M.J. 2003, AJ, 126, 1677
- Prochaska et al. (2017) Prochaska, J. X., et al. 2017, ArXiv 1702:02618
- Prochaska et al. (2011) Prochaska, J. S., Weiner, B., Chan, H.-W., Cooksey, K., & Mulchaey, J. 2011, ApJS, 193, 28
- Savage et al. (2010) Savage, B. D., Narayanan, A., Wakker, B. P., et al. 2010, ApJ, 721, 960
- Savage et al. (2014) Savage, B.D., Kim, T-S., Wakker, B.P. et al. 2014, ApJS, 212, 8 (Paper 1)
- Schaye et al. (2015) Schaye, J., Craion, R.A., Bower, R.G., et al. 2015 MNRAS, 446, 521
- Shull et al. (2012) Shull, J. M., Smith, B. D., & Danforth, C. W. 2012, ApJ, 759, 23
- Shull (2014) Shull, J. M. 2014, ApJ, 784, 142
- Shull et al. (2015) Shull, J. M., Maloney, J., Danforth, C. D., & Tilton. E. M., 2015, ApJ, 811, 3
- Stern et al. (2016) Stern, J., Hennawi, J.F., Prochaska, J.X., & Werk, J.K. 2016, ApJ, 830, 87
- Stocke et al. (2006) Stocke, J. T., Penton, S. V., Danforth, C. W., et al. 2006, ApJ, 641, 217
- Stocke et al. (2013) Stocke, J. T., Keeney, B. A., & Danforth, C.W. et al. 2013, ApJ, 763, 148 (Paper 2)
- Stocke et al. (2014) Stocke, J.T., Keeney, B.A., & Danforth, C.W. et al. 2014, ApJ, 791, 128
- Taylor et al. (2011) Taylor, E. N., Hopkins, A. M., Baldry, I. K., et al. 2011, MNRAS, 418, 1587
- Thom et al. (2012) Thom, C., Tumlinson, J., Werk, J. K., et al. 2012, ApJ, 758, L41
- Trenti et al. (2010) Trenti, M., Stiavelli, M., Bouwens, R. J., et al. 2010, ApJ, 724, L202
- Tripp et al. (1998) Tripp, T. M., Lu, L., & Savage, B. D. 1998, ApJ, 508, 200
- Tumlinson et al. (2011) Tumlinson, J., Thom, C., Werk, J. K., et al. 2011, Science, 334, 948
- Werk et al. (2013) Werk, J., Prochaska, J. X., Thom, C., et al. 2013, ApJS, 204, 17
- Werk et al. (2014) Werk, J., Prochaska, J.X., Tumlinson, J.T., et al. 2014, ApJ, 792, 8.
- Werk et al. (2016) Werk, J., Prochaska, J.X., Cantalupo, S., et al. 2016, ApJ, 833, 54.