Properties of real metallic surfaces: Effects of density functional semilocality and van der Waals nonlocality
Abstract
We have computed the surface energies, work functions, and interlayer surface relaxations of clean (111), (110), and (100) surfaces of Al, Cu, Ru, Rh, Pd, Ag, Pt, and Au. Many of these metallic surfaces have technological or catalytic applications. We compare experimental reference values to those of a family of non-empirical semilocal density functionals from the basic local density approximation (LDA) to our most advanced, general-purpose meta-generalized gradient approximation, SCAN. The closest agreement within experimental uncertainty is achieved by the simplest density functional LDA, and by the most sophisticated general-purpose one, SCAN+rVV10. The long-range van der Waals interaction incorporated through rVV10 increases the surface energies by about 10%, and the work functions by about 3%. LDA works for metal surfaces through a stronger-than-usual error cancellation. The PBE generalized gradient approximation tends to underestimate both surface energies and work functions, yielding the least accurate results. Interlayer relaxations from different functionals are in reasonable agreement with one another, and usually with experiment.
I Introduction
The rapid development of electronic structure theory has made it easier to analyze and describe complex metallic surfacesGross (2014), but understanding the underlying physics behind surface energies, work functions, and interlayer relaxations has remained a long-standing challengeSilva et al. (2006). Metallic surfaces are of particular importance because of their wide range of applications including metal-molecule junctions, junction field-effect transistors, and in catalysis Perdew (2013); White (1986); Greeley (2016); Sperger et al. (2015); Kroes and Diaz (2016); Nørskov et al. (2009). A detailed knowledge of the electronic structure is required for accurate theoretical investigations of metallic surfaces Inglesfield (1982); Sahni and Solomatin (1998).
Consequently, metal surfaces have played a key role in the development and application of Kohn-Sham density functional theory (KS DFT) Kohn and Sham (1965). The work of Lang and Kohn Lang and Kohn (1970, 1971, 1973) in the early 1970’s demonstrated the ability of the simple local density approximation (LDA) Kohn and Sham (1965); Perdew and Wang (1992) for the exchange-correlation (xc) energy to capture the surface energies and work functions of real metals. Their work stimulated the effort to understand why simple approximate functionals work and how they can be improved Langreth and Perdew (1977, 1980). Later, correlated-wavefunction calculations Krotscheck et al. (1985); Acioli and Ceperley (1996) gave much higher surface energies for jellium, but were not supported by further studies Almeida et al. (2002); Constantin et al. (2008) and were eventually corrected by a painstaking Quantum Monte Carlo calculation Wood et al. (2007a). The too-low surface energies from the Perdew-Burke-Ernzerhof Perdew et al. (1996) (PBE) generalized-gradient approximation (GGA) led in part to the AM05 Armiento and Mattsson (2005) and PBEsol Perdew et al. (2008) (PBE for solids) GGAs, and to general-purpose meta-GGAs that remain computationally efficient, including the recent strongly constrained and appropriately normed (SCAN) meta-GGA Sun et al. (2015, 2016). SCAN captures intermediate-range van der Waals (vdW) interactions, but capturing longer-ranged vdW interactions requires the addition of a non-local vdW correction such as from the revised Vydrov-Van Voorhis 2010 (rVV10) functional Sabatini et al. (2013).
Ref. Peng et al., 2016 suggests that the vdW interaction is semilocal at short and intermediate range, but displays pairwise full nonlocality at longer ranges, and many-body full nonlocality Ambrosetti et al. (2016) at the longest and least energetically important distances. Accounting for intermediate and long-ranged vdW interactions is especially important for layered materials Lebègue et al. (2010); Björkman et al. (2012); Peng et al. (2015) and ionic solids Zhang et al. (2013); Tao et al. . van der Waals interactions are also needed to correct the errors of GGAs for bulk metallic systems Tao et al. . The importance of the vdW contribution to surface properties is something we emphasize below. By naturally accounting for both intermediate and long-range interactions, SCAN+rVV10 Peng et al. (2016) represents a major improvement over previous functionals for many properties of diversely-bonded systems Sun et al. (2016), however, it had not been tested for real metallic surfaces. By studying metallic surfaces with this general-purpose functional we can better understand why LDA can be accidentally accurate, and demonstrate the systematic improvement of SCAN over other non-empirical functionals. Furthermore, we will also be able to extract the impact of intermediate and long-range dispersion.
The surface energy is the amount of energy required per unit area to cleave an infinite crystal and create a new surface Lang and Kohn (1970). Accurate theoretical face-dependent surface energies are straightforward to obtain from accurate bulk and surface calculations, since we have absolute control over morphology and purity. Experimentally, however, surface energies have been determined by measuring the surface tension of the liquid metal and then extrapolating to 0K using a phenomenological method Tyson and Miller (1977). The surface tension of the liquid phase is generally different from the actual surface free energy of the solid state metals and can be considered as an “average” surface energy. Available experimental values are also rather old (1970-1980). They provide useful but uncertain estimates for the low-energy faces of bulk crystals. With this in mind, one should be careful when comparing defect-free theoretical predictions with experimental data.
The work function on the other hand, is easier to measure Rohwerder and Turcu (2007) compared to the surface energy. One can consider the work functions measured from a polycrystalline sample Hölzl and Schulte (1979) as a “mean” work function of all the possible crystallographic faces present in the sample. In a recent work Helander et al. (2010), Halender et. al argued that ultraviolet photoemission spectroscopy can be used as an accurate measurement of the work function of materials, despite of the chances of surface contamination of the exposed surface. However, it still remains an open question as to which experimental work function value one should compare theoretical values with. In practice the work function can be calculated using DFT by accurately determining the Fermi energy and vacuum potential Lang and Kohn (1971, 1973) of the surface slab. Since the work function depends on slab thickness, the role of quantum size-effects may need to be considered.
Another fundamental property of surfaces is geometric relaxations due to strong inward electrostatic attraction on the top surface layer, which occurs mainly due to charge density smoothing at the surface. This effect can be accurately measured experimentally using low-energy electron diffraction (LEED) Tyson and Miller (1977); Noonan and Davis (1990) intensity analysis. The role played by the xc functional in surface relaxations was unclear and worth exploring in more detail.
In spite of the theoretical challenges to model and explain these metallic surface properties, density functional theory Kohn and Sham (1965); Sun et al. (2015, 2016); Nørskov et al. (2011); Tao et al. (2003) has proven to be one of the leading electronic structure theory methods to understand characteristics of metal surfaces. Lang and Kohn Lang and Kohn (1970, 1971, 1973) and Skriver and Rosengaard Skriver and Rosengaard (1992) reported the surface energies and work functions of close-packed metal surfaces from across the period table using Green’s function techniques based on linear muffin-tin-orbitals within the tight-binding and atomic-sphere approximations. In another work, Perdew et al. used the stabilized jellium and liquid drop model (SJM-LDM) Perdew et al. (1991) to understand the dependency of surface energies and work functions of simple metals on the bulk electron density as well as the atomic configuration of the exposed crystal face. Developing functionals that are accurate for surfaces has been an active area of recent activity Langreth and Perdew (1975); Perdew et al. (2008); Staroverov et al. (2004).
Although previous works Langreth and Perdew (1977); Pitarke and Perdew (2003); Fiolhais and Perdew (1992) gave very reasonable descriptions of fundamental metallic surfaces, we must consider the limitations of the local and semilocal xc density functionals for metal surfaces Stroppa and Kresse (2008). Wang et al. Wang and Wang (2014) calculated surface energies and work functions of six close-packed fcc and bcc metal surfaces using LDA and PBE. Their study confirms the face-dependence of the surface energy and work function. Singh-Miller and Marzari Singh-Miller and Marzari (2009) used PBE to study surface relaxations, surface energies, and work functions of the low-index metallic surfaces of Al, Pt, Pd, Au and Ti. Ref. Singh-Miller and Marzari, 2009 found that LDA qualitatively agrees with the experimental surface energies, but neither LDA or PBE can be considered as a default choice for quantitative comparison with experimental values for surface properties. Following what they have suggested, we will demonstrate that higher rungs of Jacob’s ladder in DFT Perdew (2013), such as meta-GGA’s or the Random Phase Approximation Langreth and Perdew (1975), must be used to accurately study surface properties.
In this work we investigated the surface energies, work functions and interlayer relaxations of the low-index clean metallic surfaces of Al, Pt, Pd, Cu, Ag, Au, Rh and Ru. Here we focus on three main crystallographic faces, (111), (110), and (100), to explore the face-dependence of the surface properties Tran et al. (2016). Furthermore, we have explored the xc-functional dependence to demonstrate the improvements non-empirical meta-GGAs can achieve compared to GGAs. We utilized the following approximations: LDA Kohn and Sham (1965), the PBE generalized gradient approximation and its modification for solids, PBEsol Perdew et al. (2008); Constantin et al. (2009), and the newly constructed meta-GGAs SCAN and SCAN+rVV10. Pt (111) was used as a test case to explore the convergence of the surface energy and work function with respect to slab thickness, kinetic energy cutoff, and k-points, see Appendix VI.3.
II Theory
II.1 Surface energy
The surface energy, , can be defined as the energy per atom, or per area, required to split an infinite crystal into two semi-infinite crystals with two equivalent surfaces Zangwill (1988),
| (1) |
where is the total energy of the slab, is the total number of atoms in the slab, is the total energy of the bulk, and is the surface area of the slab. The factor of in the above equation comes from fact that each slab is bounded by two symmetric surfaces. DaSilva et. al Silva et al. (2006) showed that a dense mesh can be used to avoid numerical instabilities in Eq. (1) coming from using different numbers of atoms in the slab and bulk calculations Boettger (1994). The linear fit method is one way to find converged values of the surface energies from slab calculations Boettger et al. (1998). Previously, Fiorentinni et. al Fiorentini and Methfessel (1996) applied this method for Pt (100) surface. We have applied this method to obtain converged values of the surface energies using equivalent cutoff energies and dense k-meshes for bulk and surface calculations. One can write Eq. (2) for the large limit of the layer thickness as
| (2) |
so that the surface energy can be extracted from an extrapolation of the slab energy with respect to the layer thickness.
II.2 Work function
The work function for metallic systems can be determined computationally taking the difference between the vacuum potential and the Fermi energy Lang and Kohn (1971):
| (3) |
The reported anisotropy of the work function for different surfaces implies it can depend on the particular face due to edge effects Smoluchowski (1941). For different surfaces there are different densities of electrons at the edges of the surface and that causes different surface dipole barriers , which is explicitly related to . Surface dependent values of can yield different values for the work function since the Fermi energy is solely a bulk property.
II.3 Surface relaxations:
Surface relaxations arise due to the minimization of the energy at the surface and can be computed using the simple formula: , where and are the distance of and layer from the top layer of the relaxed slab, and is the distance between the layers of the unrelaxed slab.
III Results & discussions:
III.1 Surface energy
| Metals | LDA | PBE | PBEsol | SCAN | SCAN+rVV10 | RPA333gpaw results from Ref. Bates et al., . | Experimental |
|---|---|---|---|---|---|---|---|
| Al | 1.08 | 0.89 | 1.06 | 1.03 | 1.16 | 1.07 | 1.14111Experimental results from Ref. Tyson and Miller, 1977. |
| Cu | 1.98 | 1.48 | 1.74 | 1.68 | 1.89 | 2.04 | 1.83222Experimental results from Ref. De Boer et al., 1988. |
| Ru | 3.19 | 2.48 | 2.89 | 2.77 | 2.99 | 3.45 | 2.99111Experimental results from Ref. Tyson and Miller, 1977. |
| Rh | 2.86 | 2.47 | 2.71 | 2.6 | 2.81 | 3.10 | 2.7222Experimental results from Ref. De Boer et al., 1988. |
| Pd | 2.19 | 1.59 | 1.90 | 1.8 | 2.04 | 2.32 | 2.00111Experimental results from Ref. Tyson and Miller, 1977. |
| Ag | 1.2 | 0.84 | 1.08 | 1.03 | 1.22 | 1.42 | 1.25222Experimental results from Ref. De Boer et al., 1988. |
| Pt | 2.26 | 1.79 | 2.12 | 1.92 | 2.15 | 2.7 | 2.49111Experimental results from Ref. Tyson and Miller, 1977. |
| Au | 1.41 | 0.87 | 1.16 | 1.06 | 1.29 | 1.41 | 1.5111Experimental results from Ref. Tyson and Miller, 1977. |
The relevant surface energies measured experimentally Tyson and Miller (1977) are usually “average” surface energies of all the possible surfaces present in the sample, hence experimentally measured surface energies should be compared with the average of the surface energies for (111), (110), and (100) surfaces De Waele et al. (2016). Here we also use the average surface energies to compare with the experimentally measured values, but from a different perspective. LDA is known to yield accurate surface energies for jellium, within the uncertainty of the latest QMC values Wood et al. (2007b), and an equally-weighted average over the three lowest-index faces from LDA reproduces the experimental surface energies to within their uncertainties. Many people have justified the accuracy of LDA through an excellent error cancellation between its exchange and correlation contributions. Usually the LDA exchange energy contribution to the surface energy is an overestimate, while the correlation contribution is a significant underestimate, and their combination results in an accurate prediction.
In Table 1 we report the mean surface energies calculated using different density functionals, including results from the random phase approximation (RPA) Bates et al. . Figure 1(left) shows the relative error (in J/m2) of the computed values of the average surface energies compared to the best available experimental results for each metal. The consistent performance of SCAN+rVV10 can be seen in all cases whereas PBE and SCAN both perform poorly. RPA results are overall in good agreement with the experimental results, however the computational cost is higher and the improvement only marginal. One can argue that SCAN+rVV10 is the “best” candidate for predicting metallic surface energies with its moderate computational cost and high accuracy.
The relative errors and mean absolute percentage errors for the computed average surface energies are shown in Figure 1. The relative errors are calculated with respect to the average experimental value from all the three crystallographic surfaces. Our results are in agreement within an acceptable margin compared to those previously reported in the literature Vitos et al. (1998); Singh-Miller and Marzari (2009); De Waele et al. (2016); Wang and Wang (2014). For Al, the lefthand plot illustrates the accuracy of all methods for simple metals that are close to the jellium limit. Table 2 demonstrates that there is an overall systematic improvement from PBE to SCAN to SCAN+rVV10 in the Al surface energy due to the step-wise incorporation of intermediate-range dispersion in SCAN and long-range dispersion in rVV10. The long-range contributions from rVV10 in Al account for 12% of the total surface energy, and foreshadows the importance of including this contribution for the metals. However, we find that the dispersion contribution from SCAN+rVV10 to the total surface energy can be as large as 18%.
Transition metal surfaces are more challenging due to their localized orbitals which cause inhomogeneities in the electron density at the surface. These inhomogeneities lead to a wider spread in the results from the different functionals. PBE yields the largest errors for the transition metal surface energies due to its parametrization for slowly varying bulk densities. PBEsol was instead fit to jeliium surface exchange-correlation energies and yields a significant improvement compared to PBE. To improve the results further, vdW interactions need to be incorporated. SCAN was constructed to interpolate the xc enhancement factor between covalent and metallic bonding limits in order to deliver an improved description of intermediate-range vdW interactions. Consequently, SCAN is more accurate than PBE but not PBEsol, since no information about surfaces was used in SCAN’s construction. Still, even without parameterizing to jellium surfaces, SCAN and PBEsol are similar and exhibit analogous trends for all of the metals. With the addition of long-range vdW from rVV10, SCAN+rVV10 surpasses the accuracy of PBEsol, indicating that the total vdW contribution to the surface energy is more important than previously recognized since SCAN alone is unable to outperform PBEsol.
Although LDA does not explicitly include vdW interactions, we infer portions of the long-range part are somehow captured through error cancellation in the exchange and correlation contributions. RPA, which also includes vdW interactions, tends to overestimate the surface energies. This is somewhat expected based upon the results for jellium slabs Pitarke and Eguiluz (1998); Kurth and Perdew (1999) where the xc contributions to the surface energy show similar relative trends between LDA and RPA as a function of the Seitz radius.
The righthand plot in Figure 1 shows the mean absolute percentage errors (MAPE). SCAN+rVV10 is clearly the best semilocal density functional, though LDA is a close second. Incorporation of vdW interactions is important for dealing with the interactions of clean metallic surfaces and their surroundings, however, and SCAN+rVV10 can be expected to perform more systematically than LDA for a broader set of properties. Though RPA provides a good additional benchmark when experimental data is scarce, its higher computational cost limits its applicability for general surface problems and reinforces the utility of a functional such as SCAN+rVV10, which is accurate, efficient, and naturally incorporates dispersion.
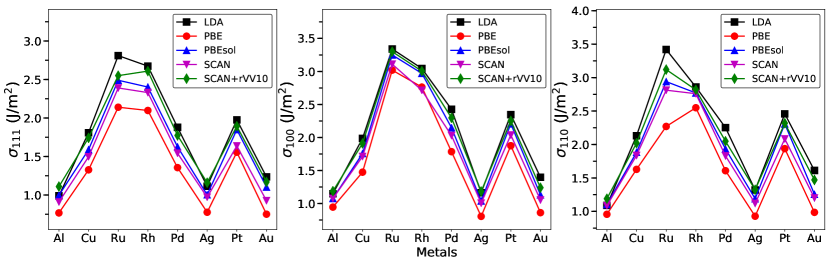
Table 2 and Figure 2 illustrate the detailed performance of each method for each crystallographic face. SCAN+rVV10 frequently overlaps with LDA, while the systematic underestimation of the surface energies by PBE is easy to see. We find excellent agreement of our PBEsol results with that of Sun et al. Sun et al. (2011), and that our LDA and PBE values and trends are in good agreement with others recently reported Singh-Miller and Marzari (2009); De Waele et al. (2016); Wang and Wang (2014). The general trend of can be seen from Fig. 2 for Al, Cu, Ag, Pt and Au respectively. However, this trend seems to be broken for Ru, Rh and Pd.
| Metals | Surface | LDA | PBE | PBEsol | SCAN | SCAN | LDA | GGA |
|---|---|---|---|---|---|---|---|---|
| +rVV10 | (Other works) | (Other works) | ||||||
| Al | 111 | 0.99 | 0.77 | 0.99 | 0.91 | 1.11 | ||
| 110 | 1.09 | 0.96 | 1.11 | 1.09 | 1.19 | , | ||
| 100 | 1.15 | 0.95 | 1.08 | 1.08 | 1.18 | , | ||
| Cu | 111 | 1.81 | 1.33 | 1.59 | 1.49 | 1.74 | ||
| 110 | 2.13 | 1.63 | 1.88 | 1.84 | 2.02 | |||
| 100 | 1.99 | 1.48 | 1.76 | 1.71 | 1.91 | |||
| Ru | 111 | 2.81 | 2.14 | 2.49 | 2.39 | 2.55 | ||
| 110 | 3.42 | 2.27 | 2.94 | 2.81 | 3.12 | |||
| 100 | 3.34 | 3.02 | 3.25 | 3.11 | 3.3 | |||
| Rh | 111 | 2.67 | 2.09 | 2.40 | 2.33 | 2.61 | ||
| 110 | 2.86 | 2.55 | 2.77 | 2.76 | 2.82 | |||
| 100 | 3.04 | 2.77 | 2.97 | 2.71 | 3.00 | |||
| Pd | 111 | 1.88 | 1.36 | 1.63 | 1.54 | 1.77 | ||
| 110 | 2.25 | 1.61 | 1.93 | 1.83 | 2.05 | |||
| 100 | 2.43 | 1.79 | 2.15 | 2.03 | 2.29 | , | ||
| Ag | 111 | 1.13 | 0.78 | 1.00 | 0.97 | 1.16 | ||
| 110 | 1.32 | 0.93 | 1.19 | 1.12 | 1.33 | |||
| 100 | 1.16 | 0.81 | 1.04 | 1.00 | 1.18 | |||
| Pt | 111 | 1.98 | 1.56 | 1.85 | 1.64 | 1.89 | ||
| 110 | 2.46 | 1.94 | 2.31 | 2.08 | 2.32 | , | ||
| 100 | 2.35 | 1.88 | 2.21 | 2.04 | 2.25 | , | ||
| Au | 111 | 1.24 | 0.75 | 1.1 | 0.93 | 1.17 | ||
| 110 | 1.61 | 0.99 | 1.26 | 1.2 | 1.47 | , | ||
| 100 | 1.39 | 0.86 | 1.13 | 1.05 | 1.24 | , |
a Experiment ; Ref. Tyson and Miller, 1977
b FCD-GGA ; Ref. Vitos et al., 1998
c Experiment ; Ref. De Boer et al., 1988
d Green function LMTO ; Ref. Skriver and Rosengaard, 1992
e PBE-GGA ; Ref. Wang and Wang, 2014
f Full potential LMTO ; Ref. Methfessel et al., 1992
g PBE calculation ; Ref. Singh-Miller and Marzari, 2009
h All-electron LDA ; Ref. Silva et al., 2006
i PWPP-LDA ; Ref. Lozovoi and A, 2003
j PWPP-LDA ; Ref. Yu, 1997
III.2 Work function
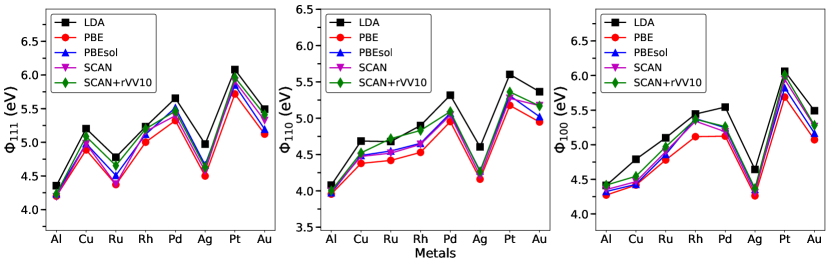
The relative errors and MAPE with respect to experiment for the work functions of the (111) surfaces are plotted in Figure 3. Tabulated values of the work function for each face can be found in Table 3, and are plotted in Fig. 4. Since we could not find experimental references for Ru (110) and (100) work functions, we instead focus on the (111) surface for simplicity. The performance trends for (111) generally hold for the other crystallographic faces as well. Our results for LDA and PBE are generally within eV of those reported in the literature Fall et al. (2001); Singh-Miller and Marzari (2009). For Al, LDA overestimates the work function for the (111) surface by 0.1 eV, but is dead on experiment for the other two faces. PBE and SCAN perform similarly for Al, but show larger deviations from one another for the -block metals. PBEsol and SCAN+rVV10 yield the smallest errors for Al. The effect of geometric relaxation on the work function was not explored, but is likely negligible.
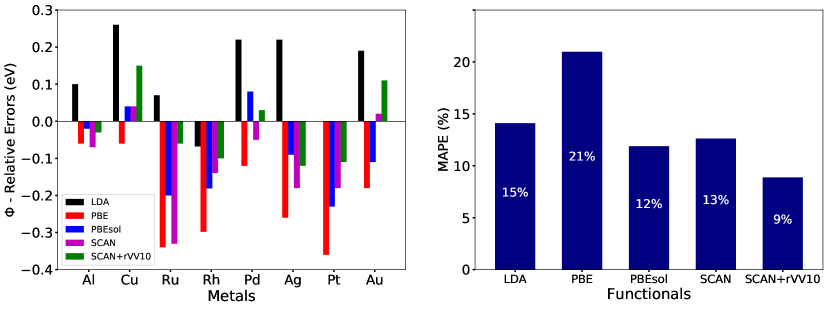
Figure 3 also shows the relative errors in the calculated values of the work function for the transition metals. These systems have entirely or partly filled -orbitals which are localized on the atoms.
Hybridization between the and orbitals varies with the crystallographic orientation resulting in changes in the surface-dipole and, consequently, the work function. The redistribution of the electrons in noble metals also impacts the surface energy due to changes in the bulk Fermi energy, and these changes vary from one face to another Fall et al. (2000).
The difference in work function values predicted by different functionals originates from the different Fermi energies predicted by each functional. The lower Fermi energy predicted by LDA results in an overestimated work function, since the average electrostatic potentials calculated from different functionals differs by less than 0.2 eV from each other. PBE and SCAN predict comparatively larger Fermi energies leading to underestimated work functions. On the other hand, SCAN+rVV10 not only lowers the Fermi energy value but also increases the average electrostatic potential compared to SCAN and thus gives a much better work function. From Fig. 3 it is clear that PBE systematically underestimates the (111) work functions and its accuracy is erratic. The underestimation of the (111) work function by PBE persists for the other faces as well. For Al and Cu PBE is accurate but shows much larger errors for the other metals. For Al and Ru, PBE and SCAN are fortuitously close though not for any particular physical reason, and in general SCAN improves upon PBE through its incorporation of vdW contributions to the surface potentials. Though PBEsol and SCAN incorporate different physical limits in their construction, their overall performance for work functions is quite similar, and typically the errors from these functionals are within the experimental uncertainties. They are also outperforming LDA for the work functions, which was not the case for the surface energies above.
The inclusion of interemdiate-range vdW interactions is not enough, however, as the long-range contributions can still raise the work function by an appreciable amount. The (111) surface of Ru is one such case where the addition of rVV10 to SCAN increases the work function by nearly 0.3 eV, significantly reducing the error compared to experiment. Incorporating the long-range dispersion amounts to between 3 and 6% of the total work function for the (111) surfaces, underscoring the importance of its inclusion. Though LDA and SCAN+rVV10 were of similar quality for the surface energies, SCAN+rVV10 clearly takes the top spot for computing accurate work functions of the (111) surfaces. We note that the trend predicted by Smoluchowski Smoluchowski (1941) is not observed for Ru, Rh and Pt, but is observed for the other metals.
The photoelectrons ejected from the metal experience an image potential, which in DFT is influenced by the behavior of the exchange-correlation potential (functional). The attractive dispersion interaction lowers this potential, systematically increasing the work function. By incorporating a long-range contribution to the potential from rVV10, SCAN+rVV10 systematically and accurately predicts surface energies within experimental uncertainties. Addition of rVV10 to the GGAs would likely reduce their errors as well, provided the bare functional underestimates the experimental reference, but it would worsen the LDA results for all but Rh. The systematic behavior of SCAN for diversely bonded systems lends itself to correction by rVV10 achieving a well balanced performance both for surface and bulk Sun et al. (2015, 2016) properties.
Since, the surface energies are calculated using the relaxed slab model the effect of surface relaxations are already incorporated in the calculations.
| Metals | Surface | LDA | PBE | PBEsol | SCAN | SCAN | LDA | GGA | Expt. |
|---|---|---|---|---|---|---|---|---|---|
| +rVV10 | (Other work) | (Other work) | |||||||
| Al | 111 | 4.36 | 4.2 | 4.24 | 4.19 | 4.23 | , | ||
| 110 | 4.08 | 3.96 | 3.98 | 3.99 | 4.00 | , | |||
| 100 | 4.41 | 4.27 | 4.32 | 4.35 | 4.42 | , | |||
| Cu | 111 | 5.20 | 4.88 | 4.98 | 4.98 | 5.09 | , | ||
| 110 | 4.68 | 4.38 | 4.48 | 4.47 | 4.53 | , | |||
| 100 | 4.79 | 4.42 | 4.43 | 4.47 | 4.54 | , | |||
| Ru | 111 | 4.78 | 4.37 | 4.51 | 4.38 | 4.65 | |||
| 110 | 4.68 | 4.42 | 4.55 | 4.52 | 4.72 | ||||
| 100 | 5.1 | 4.78 | 4.86 | 4.9 | 4.97 | ||||
| Rh | 111 | 5.23 | 5.00 | 5.12 | 5.16 | 5.20 | , | ||
| 110 | 4.9 | 4.53 | 4.66 | 4.65 | 4.83 | , | |||
| 100 | 5.44 | 5.12 | 5.38 | 5.34 | 5.37 | , | |||
| Pd | 111 | 5.66 | 5.32 | 5.52 | 5.39 | 5.47 | , | ||
| 110 | 5.32 | 4.95 | 5.07 | 5.04 | 5.09 | , | |||
| 100 | 5.54 | 5.12 | 5.25 | 5.19 | 5.26 | , | |||
| Ag | 111 | 4.97 | 4.49 | 4.66 | 4.57 | 4.63 | , | ||
| 110 | 4.61 | 4.16 | 4.28 | 4.21 | 4.26 | , | |||
| 100 | 4.64 | 4.26 | 4.35 | 4.3 | 4.37 | , | |||
| Pt | 111 | 6.08 | 5.72 | 5.85 | 5.90 | 5.97 | , | ||
| 110 | 5.6 | 5.18 | 5.31 | 5.27 | 5.36 | , | |||
| 100 | 6.06 | 5.69 | 5.82 | 5.94 | 6.01 | , | |||
| Au | 111 | 5.49 | 5.12 | 5.19 | 5.32 | 5.41 | , | ||
| 110 | 5.36 | 4.94 | 5.02 | 5.17 | 5.3 | , | |||
| 100 | 5.49 | 5.07 | 5.17 | 5.26 | 5.28 | , |
1 PWPPW-LDA ; Ref. Fall et al., 1998
2 PBE ; Ref. Singh-Miller and Marzari, 2009
3 Experiment ; Ref. Grepstad et al., 1976
4 Experiment ; Ref. Derry et al., 2015
5 Experiment ; Ref. Eastment and Mee, 1973
6 Experiment ; Ref. Haas and Thomas, 1977
7 Experiment ; Ref. Li and Li, 2001
8 Experiment ; Ref. Gartland et al., 1972
9 Full potential LMTO ; Ref. Methfessel et al., 1992
10 Experiment ; Ref. Michaelson, 1977
11 Experiment ; Ref. Brault et al., 1997
12 Experiment ; Ref. Vanselow and Li, 1992
13 Experiment ; Ref. Peebles et al., 1984
14 FLAPW-LDA ; Ref. Silva et al., 2006
15 Experiment ; Ref. Fischer et al., 1993
16 Experiment ; Ref. Sesselmann et al., 1987
17 Experiment ; Ref. Gay et al., 1981
18 Experiment ; Ref. Farnsworth and Winch, 1940
19 Experiment ; Ref. Giesen et al., 1987a
20 Experiment ; Ref. Giesen et al., 1987b
21 PWPP-LDA ; Ref. Lozovoi and A, 2003
22 Experiment ; Ref. Salmerón et al., 1983a
23 Experiment ; Ref. Nieuwenhuys, 1976
24 Experiment ; Ref. Drube et al., 1988
25 PWPP-LDA ; Ref. Fall et al., 2000
26 Experiment ; Ref. Pescia and Meier, 1982
27 Experiment ; Ref. Hansson and Flodström, 1978a
III.3 Surface relaxation
At the surface, the presence of fewer neighboring ions can cause changes in the equilibrium positions of the ions due to the changes in the inter-atomic forces. Surface reconstructions have been measured for Ag, Pt and Au. Hansson and Flodström (1978b); Bohnen and Ho (1995); Abernathy et al. (1993) In these kinds of experimental measurements surface reconstructions are possible since the top layers rearrange in order to reach a new equilibrium position, and hence can change the work function. Nevertheless, we can always compare the performance of one functional to another compared to the best available experimental values.
Tables 6, 7, and 8 show the tabulated values of the percentage relaxation for the top 4 layers of the three surfaces. Different exchange-correlation functionals may predict different interlayer relaxations compared to the experimental data Noonan and Davis (1990); Salmerón et al. (1983b); Burchhardt et al. (1994); Adams et al. (1979); Ocko et al. (1991); Ohtani et al. (1987). It is important to note that for % and % we have found only a few experimental results to compare with.
In most cases SCAN+rVV10 and SCAN predict reasonably accurate interlayer relaxations in comparison to the experimental results. However, the values for the (100) surfaces of Cu, Pd and Ag calculated using the SCAN+rVV10 and SCAN are much lower than the experimental results. Only PBEsol predicts a reliable value of % in these cases. Notice that in many cases the percentage interlayer relaxation values calculated by LDA are much larger than the experimental values. Moreover, Tables 6, 7, and 8 also show that the LDA and PBE results calculated in this work are in agreement with Ref. Singh-Miller and Marzari, 2009.
IV Summary
We studied three important surface properties of metals using the local density approximation, two generalized gradient approximations (PBE and PBEsol), and a new meta-GGA (SCAN) with and without a van der Waals correction. The surface energy, work function and interlayer relaxation were calculated and compared with the best available experiential values. The choice of exchange-correlation potential has a noticeable effect on the surface properties of metals especially on the surface energy Mohammed and Sahni (1985). The performance of SCAN is comparable to PBEsol, which is a boon for meta-GGA development, since existing GGA’s struggle compared to LDA in predicting good surface energies and work functions Singh-Miller and Marzari (2009). van der Waals interactions are present at metallic surfaces and have a non-negligible contribution to the surface energy and work function, but make a smaller impact on the interlayer relaxation. Ferri et al. Ferri et al. (2015) also found that van der Waals corrections can improve surface properties. van der Waals interactions provide an attractive interaction between one half of a bulk solid and the other when the halves are separated, so vdW interactions tend to increase the surface energy. Typically vdW forces lower the energy of a neutral solid more than for a charged system, so vdW interactions also tend to increase the work function. LDA overestimates the intermediate-range vdW attraction but has no long-range component. These two errors of LDA may cancel almost perfectly for surface properties. Although it is well understood that LDA predicts an exponential decay rather than the true asymptotic nature of the surface barrier potential, the discrepancy only matters for cases where the surface states are extended into the vacuum, such as in the case of photoemission and scanning tunneling microscopy. Surface energies and work functions are more or less a property of the local electron density at the surface and hence LDA can give excellent results.
PBE underestimates the intermediate range vdW and has no long-range vdW, so it underestimates surface energies and work functions. PBEsol and SCAN have realistic intermediate-range vdW and no long-range vdW, so they are more accurate than PBE but not as good as LDA for predicting surface properties. The asymptotic long-range vdW interactions missing in semilocal functionals can make up to a 10% difference in the surface energy or work function, which implies there is a limit to the accuracy of these methods. SCAN+rVV10 stands out in this regard as it is a balanced combination of the most advanced non-empirical semilocal functional to date and the flexible non-local vdW correction from rVV10. In addition to delivering superior performance for layered materials Peng et al. (2015), SCAN delivers high quality surface energies, work functions, and surface relaxations for metallic surfaces. SCAN+rVV10 includes realistic intermediate- and long-range vdW interactions, so it tends to yield more systematic and accurate results than LDA, PBEsol, or SCAN. Accurate measurements for these properties are needed in order to validate the performance of new and existing density functionals. Overall we find that SCAN is a systematic step up in accuracy from PBE and that adding rVV10 to SCAN yields a highly accurate method for diversely bonded systems.
| Surface | LDA | PBE | PBEsol | SCAN | SCAN+ |
|---|---|---|---|---|---|
| rVV10 | |||||
| 111 | 0.174 | 0.629 | 0.356 | 0.463 | 0.238 |
| Surface | LDA | PBE | PBEsol | SCAN | SCAN+ |
|---|---|---|---|---|---|
| rVV10 | |||||
| 111 | 0.141 | 0.209 | 0.119 | 0.126 | 0.089 |
V Acknowledgment
A.P. would like to thank A. Ruzsinszky, H. Peng, Z. Yang, and C. Shahi for their help and suggestions. This work is supported by NSF under DMR-1305135, CNS-09-5884, and by DOE under DE-SC0012575, DE-AC02-05CH11231.
| Metals | Surface | LDA | PBE | PBEsol | SCAN | SCAN | LDA | PBE | Expt. |
|---|---|---|---|---|---|---|---|---|---|
| +rVV10 | (Other work) | (Other work) | |||||||
| Al | % | 1.64 | 1.46 | 1.55 | 1.81 | 1.89 | |||
| % | -0.66 | -0.72 | -0.73 | -1.27 | -1.27 | ||||
| % | 0.1 | 0.07 | 0.09 | 0.17 | 0.16 | ||||
| Cu | % | -0.44 | -0.34 | -0.39 | -0.39 | -0.51 | |||
| % | -5.43 | 0.01 | 0.1 | -0.1 | 0.14 | ||||
| % | -4.8 | -0.01 | -0.1 | 0.13 | -0.09 | ||||
| Ru | % | -16.73 | -18.41 | -19.84 | -19.82 | -17.26 | |||
| % | -15.35 | -9.58 | -11.39 | -12.06 | -15.8 | ||||
| % | -3.74 | -8.43 | 5.84 | 6.11 | -4.01 | ||||
| Rh | % | -1.24 | -1.93 | -1.56 | -1.53 | -1.37 | |||
| % | -0.5 | -0.89 | -0.36 | -0.2 | -0.72 | ||||
| % | -1.11 | 1.05 | 1.07 | 1.16 | 1.29 | ||||
| Pd | % | -0.45 | -0.45 | 0.55 | 0.91 | 1.07 | |||
| % | -0.52 | -0.24 | -0.3 | -0.49 | -0.42 | ||||
| % | -0.48 | 0.15 | 0.11 | 0.2 | 0.14 | ||||
| Ag | % | 0.15 | -0.15 | -0.07 | -0.43 | 0.24 | |||
| % | -0.11 | -0.3 | -0.07 | -0.12 | -0.27 | ||||
| % | -0.14 | -0.15 | -0.8 | -0.24 | -0.49 | ||||
| Pt | % | 1.05 | 0.89 | 0.79 | 2.48 | 2.67 | |||
| % | -0.32 | -0.71 | -0.65 | -0.39 | -0.15 | ||||
| % | 0.14 | -0.04 | -0.03 | -0.62 | -0.61 | ||||
| Au | % | -0.42 | 0.99 | 0.76 | 1.09 | 1.5 | |||
| % | -0.58 | -0.75 | -0.65 | -0.78 | -0.82 | ||||
| % | -0.24 | -0.29 | -0.18 | -0.27 | -0.31 |
| Metals | Surface | LDA | PBE | PBEsol | SCAN | SCAN | LDA | PBE | Expt. |
|---|---|---|---|---|---|---|---|---|---|
| +rVV10 | (Other work) | (Other work) | |||||||
| Al | % | -7.04 | -7.27 | -6.84 | -8.86 | -8.44 | |||
| % | 5.28 | 4.1 | 3.99 | 6.05 | 3.88 | ||||
| % | -1.02 | -0.86 | -0.91 | -1.12 | -0.79 | ||||
| Cu | % | -9.9 | -9.98 | -10.07 | -11.75 | -11.17 | |||
| % | 5.26 | 4.81 | 5.00 | 5.82 | 5.73 | ||||
| % | -2.91 | -1.18 | -0.99 | -3.89 | -2.6 | ||||
| Ru | % | -18.44 | -19.8 | -14.7 | -15.75 | -17.2 | |||
| % | -9.65 | -6.23 | -8.55 | -9.41 | -9.24 | ||||
| % | -2.01 | 0.93 | 1.64 | -0.88 | -1.85 | ||||
| Rh | % | -14.2 | -10.54 | -8.97 | -11.33 | -11.25 | |||
| % | 2.74 | 2.49 | 3.09 | 2.87 | 3.57 | ||||
| % | -1.45 | 1.41 | 1.91 | 3.26 | 3.89 | ||||
| Pd | % | -6.88 | -5.38 | -8.88 | -9.5 | -7.6 | |||
| % | 4.03 | 3.84 | 4.11 | 4.73 | 4.00 | ||||
| % | -0.35 | -0.21 | -0.3 | -0.28 | -0.44 | ||||
| Ag | % | -7.71 | -6.87 | -8.84 | -8.81 | -7.38 | |||
| % | 4.71 | 3.69 | 4.45 | 3.99 | 4.16 | ||||
| % | -1.07 | -0.97 | -1.23 | -0.86 | -0.42 | ||||
| Pt | % | -16.47 | -17.15 | -16.1 | -24.5 | -23.3 | |||
| % | 8.96 | 10.08 | 8.85 | 14.37 | 14.55 | ||||
| % | -1.82 | -1.91 | -1.82 | -2.53 | -2.23 | ||||
| Au | % | -14.08 | -13.87 | -13.52 | -14.54 | -14.09 | |||
| % | 9.01 | 9.24 | 8.71 | 10.11 | 10.14 | ||||
| % | -4.00 | -3.29 | -3.58 | -4.17 | -3.68 |
a LEED ; Ref. Noonan and Davis, 1984
b LEED ; Ref. Davis et al., 1979
c LEED ; Ref. Barnes et al., 1985
d LEED ; Ref. Kuk and Feldman, 1984
e LEED ; Ref. Adams et al., 1979
f PBE ; Ref. Singh-Miller and Marzari, 2009
g PWPP-LDA ; Ref. Kiejna et al., 1999
h LDA-SGF ; Ref. Methfessel et al., 1992
i LEED ; Ref. Bohnen and Ho, 1995
j DFT(LDA & PBE) ; Ref. Wang et al., 2001
| Metals | Surface | LDA | PBE | PBEsol | SCAN | SCAN | LDA | PBE | Expt. |
|---|---|---|---|---|---|---|---|---|---|
| +rVV10 | (Other work) | (Other work) | |||||||
| Al | % | 1.22 | 1.18 | 0.9 | 1.08 | 1.26 | |||
| % | -0.44 | -0.65 | -0.38 | 0.0 | -0.06 | ||||
| % | -0.32 | -0.26 | -0.24 | -0.67 | -0.69 | ||||
| Cu | % | -2.88 | -2.48 | -2.18 | -3.98 | -3.19 | |||
| % | -0.41 | 1.22 | 1.15 | -0.25 | -0.75 | ||||
| % | 0.0 | 0.11 | 0.03 | -0.13 | -0.03 | ||||
| Ru | % | -17.71 | -13.12 | -15.79 | -15.85 | -15.65 | |||
| % | -2.24 | 0.4 | -1.69 | -2.76 | -2.52 | ||||
| % | 0.83 | 3.29 | 1.32 | 1.47 | 1.39 | ||||
| Rh | % | -7.71 | -4.13 | -3.63 | -4.45 | -4.43 | |||
| % | -2.39 | 0.47 | 0.81 | 1.37 | 1.83 | ||||
| % | -2.23 | 0.92 | 1.14 | 0.98 | 1.32 | ||||
| Pd | % | -0.69 | -1.13 | -1.17 | -0.94 | -0.9 | |||
| % | 0.28 | 0.24 | 0.43 | 0.32 | 0.21 | ||||
| % | -0.54 | 0.26 | 0.23 | 0.49 | 0.59 | ||||
| Ag | % | -1.13 | -1.74 | -1.41 | -1.78 | -1.16 | |||
| % | 0.87 | 0.79 | 0.69 | 0.89 | 0.83 | ||||
| % | 0.17 | 0.2 | 0.16 | -0.06 | 0.28 | ||||
| Pt | % | -2.61 | -2.2 | -3.84 | -4.29 | -3.72 | |||
| % | -0.04 | 0.03 | 0.38 | -0.96 | -0.96 | ||||
| % | -1.66 | -1.35 | -1.39 | -1.37 | -0.77 | ||||
| Au | % | 0.88 | 0.52 | 0.6 | 0.54 | 0.53 | |||
| % | -0.721 | -0.75 | -0.65 | -0.78 | -0.82 | ||||
| % | 0.44 | 0.24 | 0.17 | 0.22 | 0.19 |
a LEED ; Ref. Davis et al., 1992
b LEED ; Ref. Davis and Noonan, 1983
c LEED ; Ref. Quinn et al., 1990
d LEED ; Ref. Li et al., 1991
e LEED ; Ref. Davies et al., 1981
f Hex XRD ; Ref. Ocko et al., 1991
g PBE ; Ref. Singh-Miller and Marzari, 2009
h PWPP-LDA ; Ref. Borg et al., 2004
i LDA-SGF ; Ref. Methfessel et al., 1992
j PWPP-LDA ; Ref. Yu, 1997
k DFT(LDA & PBE) ; Ref. Wang et al., 2001
VI Appendices
VI.1 Stabilized jellium model
The jellium model (JM) studied in Refs. Lang and Kohn, 1970, 1971; Manninen, 1986 is a simple model to study surface properties in which the positive ionic charge is replaced by a uniform positive background truncated at a planar surface. Although the jellium model shows “universality” in predicting the dependence of metallic surface properties, it’s not perfect. It has the following defects:
These defects are corrected in the SJM using a “structureless pseudopotential” Perdew et al. (1990). SJM treats the “differential potential” between the pseudopotential of the lattice and the electrostatic potential of the uniform positive background perturbatively, adapting the idea that each bulk ion belongs to a neutral Wigner-Seitz sphere of radius with .
| surface | JM | SJM | SJ-LDM | Expt | |
|---|---|---|---|---|---|
| Al | 111 |
VI.2 Jellium surface energies from semilocal density functionals
Jellium surface energies for different can depends on the semilocal exchange-correlation functional. In this section, we tabulated the calculated values of jellium surface energies for LDA, PBE, PBEsol and SCAN. We mention here that the rVV10 long-range correction to SCAN is less important for the jellium surface than a real surface. This preserves the fact that the jellium surface is an appropriate norm for SCAN itself.
| Exact | LDA | PBE | PBEsol | SCAN | |
|---|---|---|---|---|---|
| () | |||||
| 2 | 2624 | 15.7 | -7.2 | 1.6 | 0.3 |
| 3 | 526 | 27.2 | -11.6 | 2.7 | -7.0 |
| 4 | 157 | 42.7 | -18.5 | 3.2 | -19.1 |
| 6 | 22 | 15.7 | -46.4 | 4.1 | -71.4 |
| Error | LDA | PBE | PBEsol | SCAN |
| ME (Ha) | 160.89 | -72.3 | 15.53 | -18.66 |
| MARE (Ha) | 160.89 | -72.3 | 15.53 | 22.60 |
| MRE (%) | 45.83 | -20.93 | 2.90 | -24.30 |
| MARE (%) | 45.83 | -20.93 | 2.90 | 24.45 |
| RMSD (%) | 36.31 | 17.61 | 1.04 | 32.40 |
| TDDFT | DMC | LDA | PBE | PBEsol | SCAN | |
|---|---|---|---|---|---|---|
| () | ||||||
| 2 | 3446 | -3.2 | -5.8 | -2.7 | -0.7 | |
| 3 | 797 | -4.1 | -7.0 | -2.9 | -1.1 | |
| 4 | 278 | -4.1 | -9.4 | -4.0 | -1.6 | |
| 6 | 58 | 53 | -6.1 | -10.3 | -2.9 | 1.6 |
| Error | LDA | PBE | PBEsol | SCAN |
| ME (Ha) | -41.38 | -72.23 | -32.37 | -9.14 |
| MARE (Ha) | 41.38 | 72.23 | 32.37 | 9.60 |
| MRE (%) | -5.5 | -20.93 | -3.13 | -0.45 |
| MARE (%) | 5.5 | -20.93 | 3.13 | 1.25 |
| RMSD (%) | 2.4 | 17.61 | 0.59 | 1.42 |
VI.3 Computational details:
We performed first-principles density functional theory (DFT) calculations using the VASP package Hafner (2008) in combination with projector augmented wave (PAW) method Blöchl (1994); Kresse and Joubert (1999). For both bulk and surface computations, a maximum kinetic energy cutoff of 700 eV was used for the plane-wave expansion. The Brillouin zone was sampled using Gamma centered k-mesh grids of size for the bulk and for the surfaces. The top few layers in the slab were fully relaxed until the energy and forces were converged to 0.001 eV and 0.02 eV/Å, respectively. Dipole corrections were employed to cancel the errors of the electrostatic potential, atomic forces and total energy, caused by periodic boundary condition.
For the slab geometry, 20Å of vacuum was used to reduce the Coulombic interaction between the actual surface and its periodic image. For (111) surfaces, a hexagonal cell was used with each layer containing one atom per layer. The same procedure was employed for (100) tetragonal and (100) orthorhombic cell. The cells are built using the theoretical lattice constants obtained from fitting the Birch-Murnaghan(BM) equation of state for the bulk with each functional, see Tab. 15. We do not consider exchange-correlation contributions to the planar averaged local electrostatic potential (). We used Pt (111) to test the convergence of the surface properties with respect to different computational variables such as k-mesh, cut-off energy, layer and vacuum thickness of the slab geometry. All the computed surface properties presented in this work, are well converged with respect to these computational variables.
| Metals | LDA | PBE | PBEsol | SCAN | SCAN+rVV10 | Experimental |
|---|---|---|---|---|---|---|
| Al | 3.981 | 4.034 | 4.008 | 4.004 | 3.996 | 4.018 |
| Cu | 3.524 | 3.631 | 3.561 | 3.558 | 3.545 | 3.595 |
| Ru | c=4.265 | c=4.269 | c=4.267 | c=4.265 | c=4.266 | c=4.281 |
| c/a =1.571 | c/a=1.574 | c/a=1.573 | c/a=1.572 | c/a=1.575 | c/a= 1.582 | |
| Rh | 3.751 | 3.825 | 3.8 | 3.784 | 3.773 | 3.794 |
| Pd | 3.834 | 3.935 | 3.866 | 3.896 | 3.877 | 3.876 |
| Ag | 4.001 | 4.145 | 4.079 | 4.087 | 4.060 | 4.062 |
| Pt | 3.897 | 3.967 | 3.919 | 3.896 | 3.888 | |
| Au | 4.052 | 4.156 | 4.079 | 4.087 | 4.073 | 4.063 |
References
- Gross (2014) A. Gross, Theoretical Surface Science, Vol. 1 (Springer, 2014).
- Silva et al. (2006) J. L.F. Da Silva, C. Stampfl, and M. Scheffler, “Converged properties of clean metal surfaces by all-electron first-principles calculations,” Surface Science 600 (2006).
- Perdew (2013) J P. Perdew, “Climbing the ladder of density functional approximations,” MRS Bulletin 38 (2013).
- White (1986) J M. White, “Physical and chemical properties of thin metal overlayers and alloy surfaces,” MRS Proceedings 83 (1986).
- Greeley (2016) J. Greeley, “Theoretical heterogeneous catalysis: scaling relationships and computational catalyst design,” Annual review of chemical and biomolecular engineering 7 (2016).
- Sperger et al. (2015) T. Sperger, I A. Sanhueza, I. Kalvet, and F. Schoenebeck, “Computational studies of synthetically relevant homogeneous organometallic catalysis involving ni, pd, ir, and rh: An overview of commonly employed dft methods and mechanistic insights,” Chemical Reviews 115 (2015).
- Kroes and Diaz (2016) G J. Kroes and C. Diaz, “Quantum and classical dynamics of reactive scattering of h2 from metal surfaces,” Chemical Society Reviews 45 (2016).
- Nørskov et al. (2009) J K. Nørskov, T. Bligaard, J. Rossmeisl, and C H. Christensen, “Towards the computational design of solid catalysts,” Nature chemistry 1 (2009).
- Inglesfield (1982) J E. Inglesfield, “Surface electronic structure,” Reports on Progress in Physics 45 (1982).
- Sahni and Solomatin (1998) V. Sahni and A. Solomatin, Density Functional Theory, Advances in Quantum Chemistry, Vol. 33 (Academic Press, 1998).
- Kohn and Sham (1965) W. Kohn and L. J. Sham, “Self-consistent equations including exchange and correlation effects,” Physical Review 140 (1965).
- Lang and Kohn (1970) N. D. Lang and W. Kohn, “Theory of metal surfaces: Charge density and surface energy,” Physical Review B 1 (1970).
- Lang and Kohn (1971) N. D. Lang and W. Kohn, “Theory of metal surfaces: Work function,” Physical Review B 3 (1971).
- Lang and Kohn (1973) N. D. Lang and W. Kohn, “Theory of metal surfaces: Induced surface charge and image potential,” Physical Review B 7 (1973).
- Perdew and Wang (1992) J P. Perdew and Y. Wang, “Accurate and simple analytic representation of the electron-gas correlation energy,” Physical Review B 45 (1992).
- Langreth and Perdew (1977) D C. Langreth and J P. Perdew, “Exchange-correlation energy of a metallic surface: Wave-vector analysis,” Physical Review B 15 (1977).
- Langreth and Perdew (1980) D C. Langreth and J P. Perdew, “Theory of nonuniform electronic systems. I. Analysis of the gradient approximation and a generalization that works,” Physical Review B 21 (1980).
- Krotscheck et al. (1985) E. Krotscheck, W. Kohn, and G-X. Qian, “Theory of inhomogeneous quantum systems. IV. Variational calculations of metal surfaces,” Physical Review B 32 (1985).
- Acioli and Ceperley (1996) P. H. Acioli and D. M. Ceperley, “Diffusion Monte Carlo study of jellium surfaces: Electronic densities and pair correlation functions,” Physical Review B 54 (1996).
- Almeida et al. (2002) L. M. Almeida, J P. Perdew, and Carlos Fiolhais, “Surface and curvature energies from jellium spheres: Density functional hierarchy and Quantum Monte Carlo,” Physical Review B 66 (2002).
- Constantin et al. (2008) L A. Constantin, J M. Pitarke, J F. Dobson, A. Garcia-Lekue, and J P. Perdew, “High-level correlated approach to the jellium surface energy, without uniform-gas input,” Physical Review Letters 100 (2008).
- Wood et al. (2007a) B. Wood, N. D. M. Hine, W. M. C. Foulkes, and P. García-González, “Quantum Monte Carlo calculations of the surface energy of an electron gas,” Physical Review B 76 (2007a).
- Perdew et al. (1996) J P. Perdew, K. Burke, and M. Ernzerhof, “Generalized gradient approximation made simple,” Physical Review Letters 77 (1996).
- Armiento and Mattsson (2005) R. Armiento and A. E. Mattsson, “Functional designed to include surface effects in self-consistent density functional theory,” Physical Review B 72 (2005).
- Perdew et al. (2008) J P. Perdew, A. Ruzsinszky, G. Csonka, O A. Vydrov, G E. Scuseria, L A. Constantin, X. Zhou, and K. Burke, “Restoring the density-gradient expansion for exchange in solids and surfaces,” Physical Review Letters 100 (2008).
- Sun et al. (2015) J. Sun, A. Ruzsinszky, and J P. Perdew, “Strongly constrained and appropriately normed semilocal density functional,” Physical Review Letters 115 (2015).
- Sun et al. (2016) J. Sun, R C. Remsing, Y. Zhang, Z. Sun, A. Ruzsinszky, H. Peng, Z. Yang, A. Paul, U. Waghmare, X. Wu, M L. Klein, and J P. Perdew, “Accurate first-principles structures and energies of diversely bonded systems from an efficient density functional,” Nature Chemistry 8 (2016).
- Sabatini et al. (2013) R. Sabatini, T. Gorni, and S. de Gironcoli, “Nonlocal van der Waals density functional made simple and efficient,” Physical Review B 87 (2013).
- Peng et al. (2016) H. Peng, Z H. Yang, J P. Perdew, and J. Sun, “Versatile van der Waals density functional based on a meta-generalized gradient approximation,” Physical Review X 6 (2016).
- Ambrosetti et al. (2016) A. Ambrosetti, N. Ferri, R A. DiStasio, and A. Tkatchenko, “Wavelike charge density fluctuations and van der Waals interactions at the nanoscale,” Science 351 (2016).
- Lebègue et al. (2010) S. Lebègue, J. Harl, T. Gould, J. G. Ángyán, G. Kresse, and J. F. Dobson, Phys. Rev. Lett. 105, 196401 (2010).
- Björkman et al. (2012) T. Björkman, A. Gulans, A. V. Krasheninnikov, and R. M. Nieminen, “van der waals bonding in layered compounds from advanced density-functional first-principles calculations,” Phys. Rev. Lett. 108, 235502 (2012).
- Peng et al. (2015) H. Peng, Z.H. Yang, J. Sun, and J P. Perdew, “Scan+rvv10: A promising van der Waals density functional,” ArXiv e-prints (2015), arXiv:1510.05712 .
- Zhang et al. (2013) F. Zhang, J. D. Gale, B. P. Uberuaga, C. R. Stanek, and N. A. Marks, “Importance of dispersion in density functional calculations of cesium chloride and its related halides,” Phys. Rev. B 88, 054112 (2013).
- (35) J. Tao, F. Zhen, J. Gebhardt, J. P. Perdew, and A. M. Rappe, “Screened van der waals correction to density functional theory for solids,” submitted .
- Tyson and Miller (1977) W.R. Tyson and W.A. Miller, “Surface free energies of solid metals: Estimation from liquid surface tension measurements,” Surface Science 62 (1977).
- Rohwerder and Turcu (2007) M. Rohwerder and F. Turcu, “High-resolution Kelvin probe microscopy in corrosion science: Scanning Kelvin probe force microscopy (skpfm) versus classical scanning Kelvin probe (skp),” Electrochimica Acta 53 (2007).
- Hölzl and Schulte (1979) J. Hölzl and F. K. Schulte, “Solid surface physics,” (Springer Berlin Heidelberg, 1979) Chap. Work function of metals.
- Helander et al. (2010) M.G. Helander, M.T. Greiner, Z.B. Wang, and Z.H. Lu, “Pitfalls in measuring work function using photoelectron spectroscopy,” Applied Surface Science 256 (2010).
- Noonan and Davis (1990) J. R. Noonan and H. L. Davis, “Confirmation of an exception to the “general rule” of surface relaxations,” Journal of Vacuum Science & Technology A: Vacuum, Surfaces, and Films 8 (1990).
- Nørskov et al. (2011) J K. Nørskov, F. Abild-Pedersen, F. Studt, and T. Bligaard, “Density functional theory in surface chemistry and catalysis,” Proceedings of the National Academy of Sciences 108 (2011).
- Tao et al. (2003) J. Tao, J P. Perdew, V. N. Staroverov, and G. E. Scuseria, “Climbing the density functional ladder: Nonempirical meta-generalized gradient approximation designed for molecules and solids,” Physical Review Letters 91 (2003).
- Skriver and Rosengaard (1992) H. L. Skriver and N. M. Rosengaard, “Surface energy and work function of elemental metals,” Physical Review B 46 (1992).
- Perdew et al. (1991) J P. Perdew, Y. Wang, and E. Engel, “Liquid-drop model for crystalline metals: Vacancy-formation, cohesive, and face-dependent surface energies,” Physical Review Letters 66 (1991).
- Langreth and Perdew (1975) D C. Langreth and J P. Perdew, “The exchange-correlation energy of a metallic surface,” Solid State Communications 17 (1975).
- Staroverov et al. (2004) V N. Staroverov, G E. Scuseria, J. Tao, and J P. Perdew, “Tests of a ladder of density functionals for bulk solids and surfaces,” Physical Review B 69 (2004).
- Pitarke and Perdew (2003) J M. Pitarke and J P. Perdew, “Metal surface energy: Persistent cancellation of short-range correlation effects beyond the random phase approximation,” Physical Review B 67 (2003).
- Fiolhais and Perdew (1992) C. Fiolhais and J P. Perdew, “Energies of curved metallic surfaces from the stabilized-jellium model,” Physical Review B 45 (1992).
- Stroppa and Kresse (2008) A. Stroppa and G. Kresse, “The shortcomings of semi-local and hybrid functionals: What we can learn from surface science studies,” New Journal of Physics 10 (2008).
- Wang and Wang (2014) J. Wang and S. Wang, “Surface energy and work function of fcc and bcc crystals density functional study,” Surface Science 630 (2014).
- Singh-Miller and Marzari (2009) N E. Singh-Miller and N. Marzari, “Surface energies, work functions, and surface relaxations of low-index metallic surfaces from first principles,” Physical Review B 80 (2009).
- Tran et al. (2016) R. Tran, Z. Xu, B. Radhakrishnan, D. Winston, W. Sun, K A. Persson, and S P. Ong, “Surface energies of elemental crystals,” Scientific Data 3 (2016).
- Constantin et al. (2009) L. A. Constantin, J P. Perdew, and J. M. Pitarke, “Exchange-correlation hole of a generalized gradient approximation for solids and surfaces,” Physical Review B 79 (2009).
- Zangwill (1988) A. Zangwill, Physics at surfaces (Cambridge University Press, 1988).
- Boettger et al. (1998) J . Boettger, J R. Smith, U. Birkenheuer, N. Rösch, S B. Trickey, J R. Sabin, and S P. Apell, “Extracting convergent surface formation energies from slab calculations,” Journal of Physics: Condensed Matter 10, 893 (1998).
- Boettger (1994) J. C. Boettger, “Nonconvergence of surface energies obtained from thin-film calculations,” Physical Review B 49 (1994).
- Fiorentini and Methfessel (1996) V. Fiorentini and M. Methfessel, “Extracting convergent surface energies from slab calculations,” Journal of Physics: Condensed Matter 8 (1996).
- Smoluchowski (1941) R. Smoluchowski, “Anisotropy of the electronic work function of metals,” Physical Review 60 (1941).
- De Boer et al. (1988) F. R. De Boer, W.C.M. Mattens, R. Boom, A.R. Miedema, and A.K. Niessen, Cohesion in metals (North-Holland, 1988).
- (60) J. E. Bates, N. Sengupta, and A. Ruzsinszky, In preparation.
- De Waele et al. (2016) S. De Waele, K. Lejaeghere, M. Sluydts, and S. Cottenier, “Error estimates for density-functional theory predictions of surface energy and work function,” Physical Review B 94 (2016).
- Wood et al. (2007b) B. Wood, N. D. M. Hine, W. M. C. Foulkes, and P. García-González, “Quantum monte carlo calculations of the surface energy of an electron gas,” Physical Review B 76 (2007b).
- Vitos et al. (1998) L. Vitos, A.V. Ruban, H.L. Skriver, and J. Kollár, “The surface energy of metals,” Surface Science 411 (1998).
- Pitarke and Eguiluz (1998) J. M. Pitarke and A. G. Eguiluz, “Surface energy of a bounded electron gas: Analysis of the accuracy of the local-density approximation via ab initio self-consistent-field calculations,” Physical Review B 57 (1998).
- Kurth and Perdew (1999) S. Kurth and J P. Perdew, “Density-functional correction of random-phase-approximation correlation with results for jellium surface energies,” Physical Review B 59 (1999).
- Sun et al. (2011) J. Sun, M. Marsman, A. Ruzsinszky, G. Kresse, and J P. Perdew, “Improved lattice constants, surface energies, and CO desorption energies from a semilocal density functional,” Physical Review B 83 (2011).
- Methfessel et al. (1992) M. Methfessel, D. Hennig, and M. Scheffler, “Trends of the surface relaxations, surface energies, and work functions of the 4 d transition metals,” Physical Review B 46 (1992).
- Lozovoi and A (2003) A Y. Lozovoi and Ali A, “Reconstruction of charged surfaces: General trends and a case study of Pt(110) and Au(110),” Physical Review B 68 (2003).
- Yu (1997) M. Yu, B. D.and Scheffler, “Physical origin of exchange diffusion on fcc (100) metal surfaces,” Physical Review B 56 (1997).
- Fall et al. (2001) C. J. Fall, N. Binggeli, and A. Baldereschi, “Theoretical maps of work-function anisotropies,” Physical Review B 65 (2001).
- Fall et al. (2000) C. J. Fall, N. Binggeli, and A. Baldereschi, “Work-function anisotropy in noble metals: Contributions from d states and effects of the surface atomic structure,” Physical Review B 61 (2000).
- Fall et al. (1998) C. J. Fall, N. Binggeli, and A. Baldereschi, “Anomaly in the anisotropy of the aluminum work function,” Physical Review B 58 (1998).
- Grepstad et al. (1976) J.K. Grepstad, P.O. Gartland, and B.J. Slagsvold, “Anisotropic work function of clean and smooth low-index faces of aluminium,” Surface Science 57 (1976).
- Derry et al. (2015) G N. Derry, M E. Kern, and E H. Worth, “Recommended values of clean metal surface work functions,” Journal of Vacuum Science & Technology A: Vacuum, Surfaces, and Films 33 (2015).
- Eastment and Mee (1973) R. M. Eastment and C. H. B. Mee, “Work function measurements on (100), (110) and (111) surfaces of aluminium,” Journal of Physics F: Metal Physics 3 (1973).
- Haas and Thomas (1977) G. A. Haas and R. E. Thomas, “Work function and secondary emission studies of various Cu crystal faces,” Journal of Applied Physics 48 (1977).
- Li and Li (2001) D. Y. Li and W. Li, “Electron work function: A parameter sensitive to the adhesion behavior of crystallographic surfaces,” Applied Physics Letters 79 (2001).
- Gartland et al. (1972) P. O. Gartland, S. Berge, and B. J. Slagsvold, “Photoelectric work function of a copper single crystal for the (100), (110), (111), and (112) faces,” Physical Review Letters 28 (1972).
- Michaelson (1977) H. B. Michaelson, “The work function of the elements and its periodicity,” Journal of Applied Physics 48 (1977).
- Brault et al. (1997) P. Brault, H. Range, J. P. Toennies, and Ch. Wöll, “The low temperature adsorption of oxygen on Rh (111),” Zeitschrift für Physikalische Chemie 198 (1997).
- Vanselow and Li (1992) R. Vanselow and X.Q.D. Li, “The work function of kinked areas on clean, thermally rounded Pt and Rh crystallites: its dependence on the structure of terraces and edges,” Surface Science 264 (1992).
- Peebles et al. (1984) D.E. Peebles, H.C. Peebles, and J.M. White, “Electron spectroscopic study of the interaction of coadsorbed CO and D2 on Rh(100) at low temperature,” Surface Science 136 (1984).
- Fischer et al. (1993) R. Fischer, S. Schuppler, N. Fischer, Th. Fauster, and W. Steinmann, “Image states and local work function for Ag/Pd(111),” Physical Review Letters 70 (1993).
- Sesselmann et al. (1987) W. Sesselmann, B. Woratschek, J. Küppers, G. Ertl, and H. Haberland, “Interaction of metastable noble-gas atoms with transition-metal surfaces: Resonance ionization and auger neutralization,” Physical Review B 35 (1987).
- Gay et al. (1981) J. G. Gay, J. R. Smith, F. J. Arlinghaus, and T. W. Capehart, “Electronic structure of palladium (100),” Physical Review B 23 (1981).
- Farnsworth and Winch (1940) H. E. Farnsworth and R. P. Winch, “Photoelectric work functions of (100) and (111) faces of silver single crystals and their contact potential difference,” Physical Review 58 (1940).
- Giesen et al. (1987a) K. Giesen, F. Hage, F. J. Himpsel, H. J. Riess, and W. Steinmann, “Binding energy of image-potential states: Dependence on crystal structure and material,” Physical Review B 35 (1987a).
- Giesen et al. (1987b) K. Giesen, F. Hage, F. J. Himpsel, H. J. Riess, and W. Steinmann, “Binding energy of image-potential states: Dependence on crystal structure and material,” Physical Review B 35 (1987b).
- Salmerón et al. (1983a) M. Salmerón, S. Ferrer, M. Jazzar, and G. A. Somorjai, “Photoelectron-spectroscopy study of the electronic structure of Au and Ag overlayers on Pt(100), Pt(111), and Pt(997) surfaces,” Physical Review B 28 (1983a).
- Nieuwenhuys (1976) B.E. Nieuwenhuys, “Influence of the surface structure on the adsorption of hydrogen on platinum, as studied by field emission probe-hole microscopy,” Surface Science 59 (1976).
- Drube et al. (1988) R. Drube, V. Dose, and A. Goldmann, “Empty electronic states at the and surfaces of Pt(100): An inverse photoemission study,” Surface Science 197 (1988).
- Pescia and Meier (1982) D. Pescia and F. Meier, “Spin polarized photoemission from gold using circularly polarized light,” Surface Science 117 (1982).
- Hansson and Flodström (1978a) G. V. Hansson and S. A. Flodström, “Photoemission study of the bulk and surface electronic structure of single crystals of gold,” Physical Review B 18 (1978a).
- Hansson and Flodström (1978b) G. V. Hansson and S. A. Flodström, “Photoemission study of the bulk and surface electronic structure of single crystals of gold,” Physical Review B 18 (1978b).
- Bohnen and Ho (1995) K.P. Bohnen and K.M. Ho, “Surface structure of gold and silver (110)-surfaces,” Electrochimica Acta 40 (1995).
- Abernathy et al. (1993) D.L. Abernathy, D. Gibbs, G. Grubel, K.G. Huang, S.G.J. Mochrie, A.R. Sandy, and D.M. Zehner, “Reconstruction of the (111) and (001) surfaces of Au and Pt: thermal behavior,” Surface Science 283 (1993).
- Salmerón et al. (1983b) M. Salmerón, S. Ferrer, M. Jazzar, and G. A. Somorjai, “Core- and valence-band energy-level shifts in small two-dimensional islands of gold deposited on Pt(100): The effect of step-edge, surface, and bulk atoms,” Physical Review B 28 (1983b).
- Burchhardt et al. (1994) J. Burchhardt, M. M. Nielsen, D. L. Adams, E. Lundgren, and J. N. Andersen, Physical Review B 50 (1994).
- Adams et al. (1979) D. L. Adams, H. B. Nielsen, and M. A. Van Hove, “Quantitative analysis of low-energy-electron diffraction: Application to Pt(111),” Physical Review B 20 (1979).
- Ocko et al. (1991) B. M. Ocko, D. Gibbs, K. G. Huang, D. M. Zehner, and S. G. J. Mochrie, “Structure and phases of the Au(001) surface: Absolute x-ray reflectivity,” Physical Review B 44 (1991).
- Ohtani et al. (1987) H. Ohtani, M.A. Van Hove, and G.A. Somorjai, “Leed intensity analysis of the surface structures of Pd (111) and of co adsorbed on Pd (111) in a arrangement,” Surface Science 187 (1987).
- Mohammed and Sahni (1985) A E. Mohammed and V. Sahni, “Image charge at a metal surface,” Physical Review B 31 (1985).
- Ferri et al. (2015) N. Ferri, R A. DiStasio Jr, A. Ambrosetti, R. Car, and A. Tkatchenko, “Electronic properties of molecules and surfaces with a self-consistent interatomic van der Waals density functional,” Physical review letters 114 (2015).
- Lindgren et al. (1984) S. Å. Lindgren, L. Walldén, J. Rundgren, and P. Westrin, “Low-energy electron diffraction from Cu(111): Subthreshold effect and energy-dependent inner potential; surface relaxation and metric distances between spectra,” Physical Review B 29 (1984).
- Soares et al. (2000) E A. Soares, G S. Leatherman, R D. Diehl, and M A. Van Hove, “Low-energy electron diffraction study of the thermal expansion of Ag(111),” Surface Science 468 (2000).
- Wang et al. (2001) Y. Wang, W. Wang, K. Fan, and J. Deng, “Structural and electronic properties of silver surfaces: ab initio pseudopotential density functional study,” Surface Science 490 (2001).
- Noonan and Davis (1984) J. R. Noonan and H. L. Davis, “Truncation-induced multilayer relaxation of the A1(110) surface,” Physical Review B 29 (1984).
- Davis et al. (1979) H.L. Davis, J.R. Noonan, and L.H. Jenkins, “Determination of a Cu(110) surface contraction by LEED intensity analysis,” Surface Science 83 (1979).
- Barnes et al. (1985) C.J. Barnes, M.Q. Ding, M. Lindroos, R.D. Diehl, and D.A. King, “A LEED structural study of the Pd (110)- surface and an alkali-metal-induced surface reconstruction,” Surface Science 162 (1985).
- Kuk and Feldman (1984) Y. Kuk and L. C. Feldman, “Oscillatory relaxation of the Ag(110) surface,” Physical Review B 30 (1984).
- Kiejna et al. (1999) A. Kiejna, J. Peisert, and P. Scharoch, “Quantum-size effect in thin Al(110) slabs,” Surface Science 432 (1999).
- Davis et al. (1992) H. L. Davis, J. B. Hannon, K. B. Ray, and E. W. Plummer, “Anomalous interplanar expansion at the (0001) surface of Be,” Physical Review Letters 68 (1992).
- Davis and Noonan (1983) H.L. Davis and J.R. Noonan, “Multilayer relaxation in metallic surfaces as demonstrated by LEED analysis,” Surface Science 126 (1983).
- Quinn et al. (1990) J. Quinn, Y. S. Li, D. Tian, H. Li, F. Jona, and P. M. Marcus, “Anomalous multilayer relaxation of Pd(001),” Physical Review B 42 (1990).
- Li et al. (1991) H. Li, J. Quinn, Y. S. Li, D. Tian, F. Jona, and P. M. Marcus, “Low-energy electron diffraction and photoemission study of epitaxial films of Cu on Ag(001),” Physical Review B 43 (1991).
- Davies et al. (1981) J.A. Davies, T.E. Jackman, D.P. Jackson, and P.R. Norton, “Surface relaxation of the platinum (100) surface at 175 K,” Surface Science 109 (1981).
- Borg et al. (2004) M. Borg, M. Birgersson, M. Smedh, A. Mikkelsen, D L. Adams, R. Nyholm, C. Almbladh, and Jesper N. Andersen, “Experimental and theoretical surface core-level shifts of aluminum (100) and (111),” Physical Review B 69 (2004).
- Manninen (1986) M. Manninen, “Structures of small alkali-metal clusters,” Physical Review B 34 (1986).
- Ashcroft and Langreth (1967) N. W. Ashcroft and D C. Langreth, “Compressibility and binding energy of the simple metals,” Physical Review 155 (1967).
- Perdew et al. (1990) J P. Perdew, H. Q. Tran, and E D. Smith, “Stabilized jellium: Structureless pseudopotential model for the cohesive and surface properties of metals,” Physical Review B 42 (1990).
- Ziesche and Fiolhais (1994) J P. Ziesche, P.and Perdew and C. Fiolhais, “Spherical voids in the stabilized jellium model: Rigorous theorems and padé representation of the void-formation energy,” Physical Review B 49 (1994).
- Perdew (1995) J P Perdew, “Simple theories for simple metals: Face-dependent surface energies and work functions,” Progress in surface science 48 (1995).
- Hafner (2008) J. Hafner, “Ab-initio simulations of materials using VASP: Density-functional theory and beyond,” Journal of computational chemistry 29 (2008).
- Blöchl (1994) Peter E Blöchl, “Projector augmented-wave method,” Physical Review B 50 (1994).
- Kresse and Joubert (1999) G. Kresse and D. Joubert, “From ultrasoft pseudopotentials to the projector augmented-wave method,” Phyical Review B 59 (1999).
- Harl et al. (2010) J. Harl, L. Schimka, and G. Kresse, “Assessing the quality of the random phase approximation for lattice constants and atomization energies of solids,” Physical Review B 81 (2010).
- Schimka et al. (2013) L. Schimka, R. Gaudoin, Klimeš J., M. Marsman, and G. Kresse, “Lattice constants and cohesive energies of alkali, alkaline-earth, and transition metals: Random phase approximation and density functional theory results,” Physical Review B 87 (2013).