Rathijit Biswas
11institutetext: Centre for Astroparticle Physics and Space Science, Bose Institute, Kolkata, India
11email: rathijit.biswas@cern.ch
Measurement of charged jet cross sections and jet shapes in proton-proton collisions at = 2.76 TeV with the ALICE detector at LHC
Abstract
We present measurements of charged jet cross sections and jet shape observables in leading jet in proton-proton (pp) collisions at = 2.76 TeV with the ALICE detector at LHC. Jets are reconstructed at midrapidity from charged particles using the sequential recombination anti-kT jet finding algorithm for various R values. The results are compared to measurements from HERWIG, PHOJET and different tunes of PYTHIA6 and earlier measurements at 7 TeV.
keywords:
Charged jet, jet shape, ALICE1 Introduction
Jets are defined as the collimated stream of final state hadrons, produced from the fragmentation of hard scattered partons (quarks and gluons) in high energy collisions. Jets serve as tool to connect the final state hadrons with the primarily produced partons and thus they are probe to test perturbative quantum chromodynamics (pQCD). The study of jet shapes provides details of the parton to jet fragmentation with insight to jet tranverse profile. Furthermore, the measurements in pp serves as a baseline reference for similar measurements in heavy-ion (AA) collisions, where a highly dense medium is created, to isolate the hot matter effects.
2 Data analysis, jet reconstruction and observables
For this analysis, 4.4 X 10⁷ minimum bias events recorded by the ALICE detector at the Large Hadron Collider (LHC) during 2011 are used. Events with primary vertex within cm along the beam axis from the geometrical interaction point are analysed. Charged tracks are reconstructed using the combined information from Time Projection Chamber (TPC) and Inner Tracking System (ITS) and tracks with p 150 MeV/c, 0.9 are selected for the analysis. Jets are reconstructed using sequential recombination anti-kT [1] jet clustering algorithm from the FastJet package [2]. The differential charged jet cross sections are measured with R = 0.2, 0.3, 0.4 and 0.6 using the equation
| (1) |
where int is the integrated luminosity (1.3 nb-1 in our case) and Njets the number of jets in the selected intervals of pT and . Jet shape observables such as average numbers of charged tracks in a leading jet (N), leading charged jet size (average radius containing 80% of the total jet pT, R) and radial distribution of pT density about the jet axis (dpTsum/dr) are measured for R = 0.4.
3 Corrections and systematic uncertainties
The jet pT spectra are corrected for instrumental effects by the Bayesian unfolding technique [3] using Monte Carlo (MC) events and full detector simulation with GEANT3 [4]. Jet shape observables are corrected using a bin-by-bin correction technique. All the observables are further corrected for the contribution of the underlying event (UE) from sources other than hard scattering. The UE is estimated following the technique used by ALICE [5] and subtracted event-by-event for jet pT spectra and on a statistical basis for jet shape observables. The sources of systematic uncertainties include finite efficiency and momentum resolution, UE estimation and the dependence of correction factors on MC event generators.
4 Results
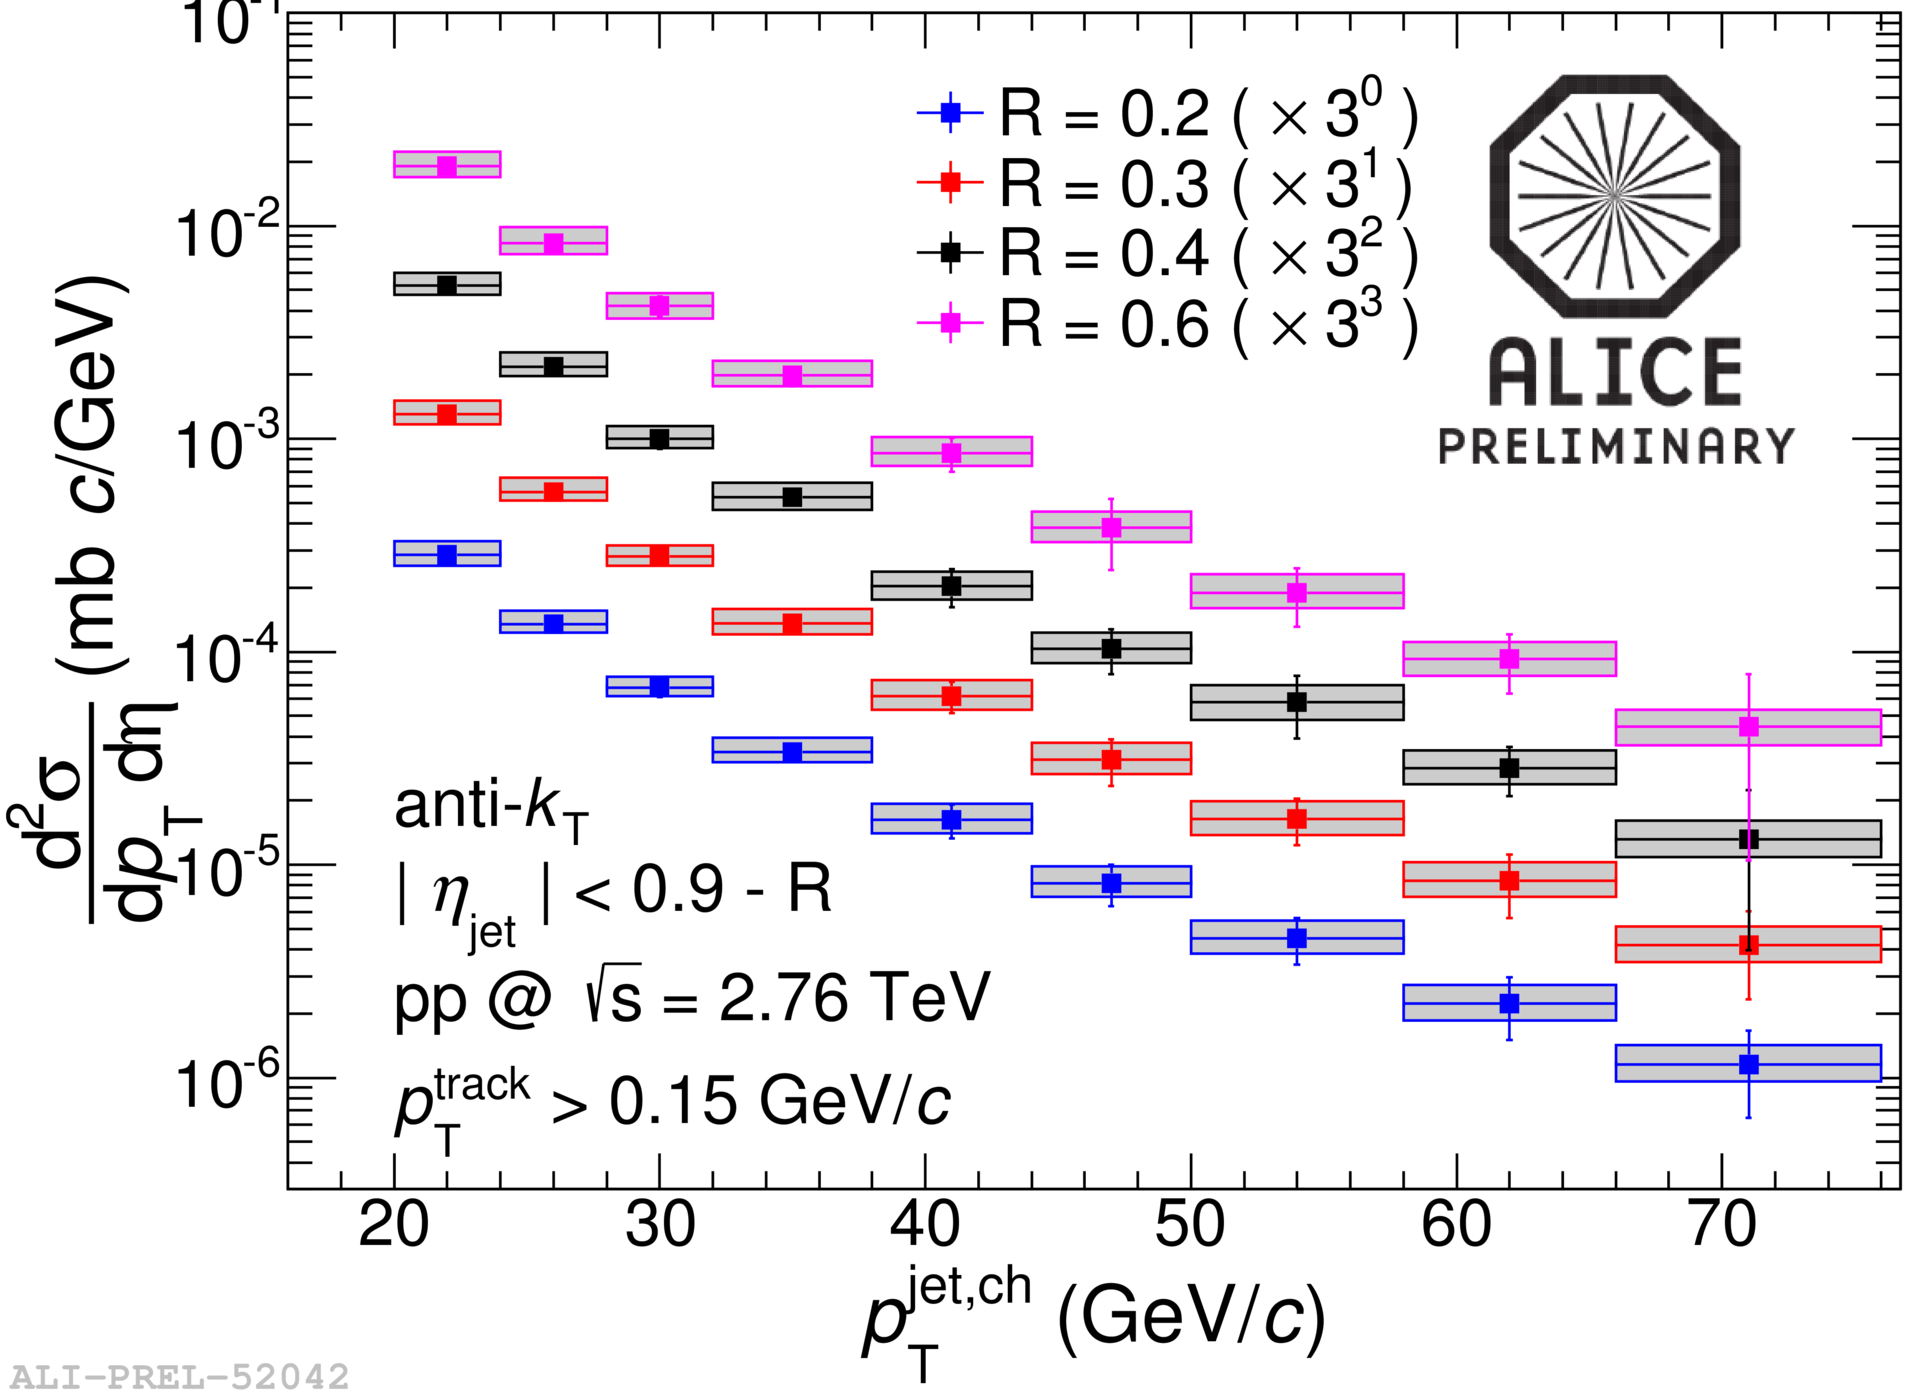
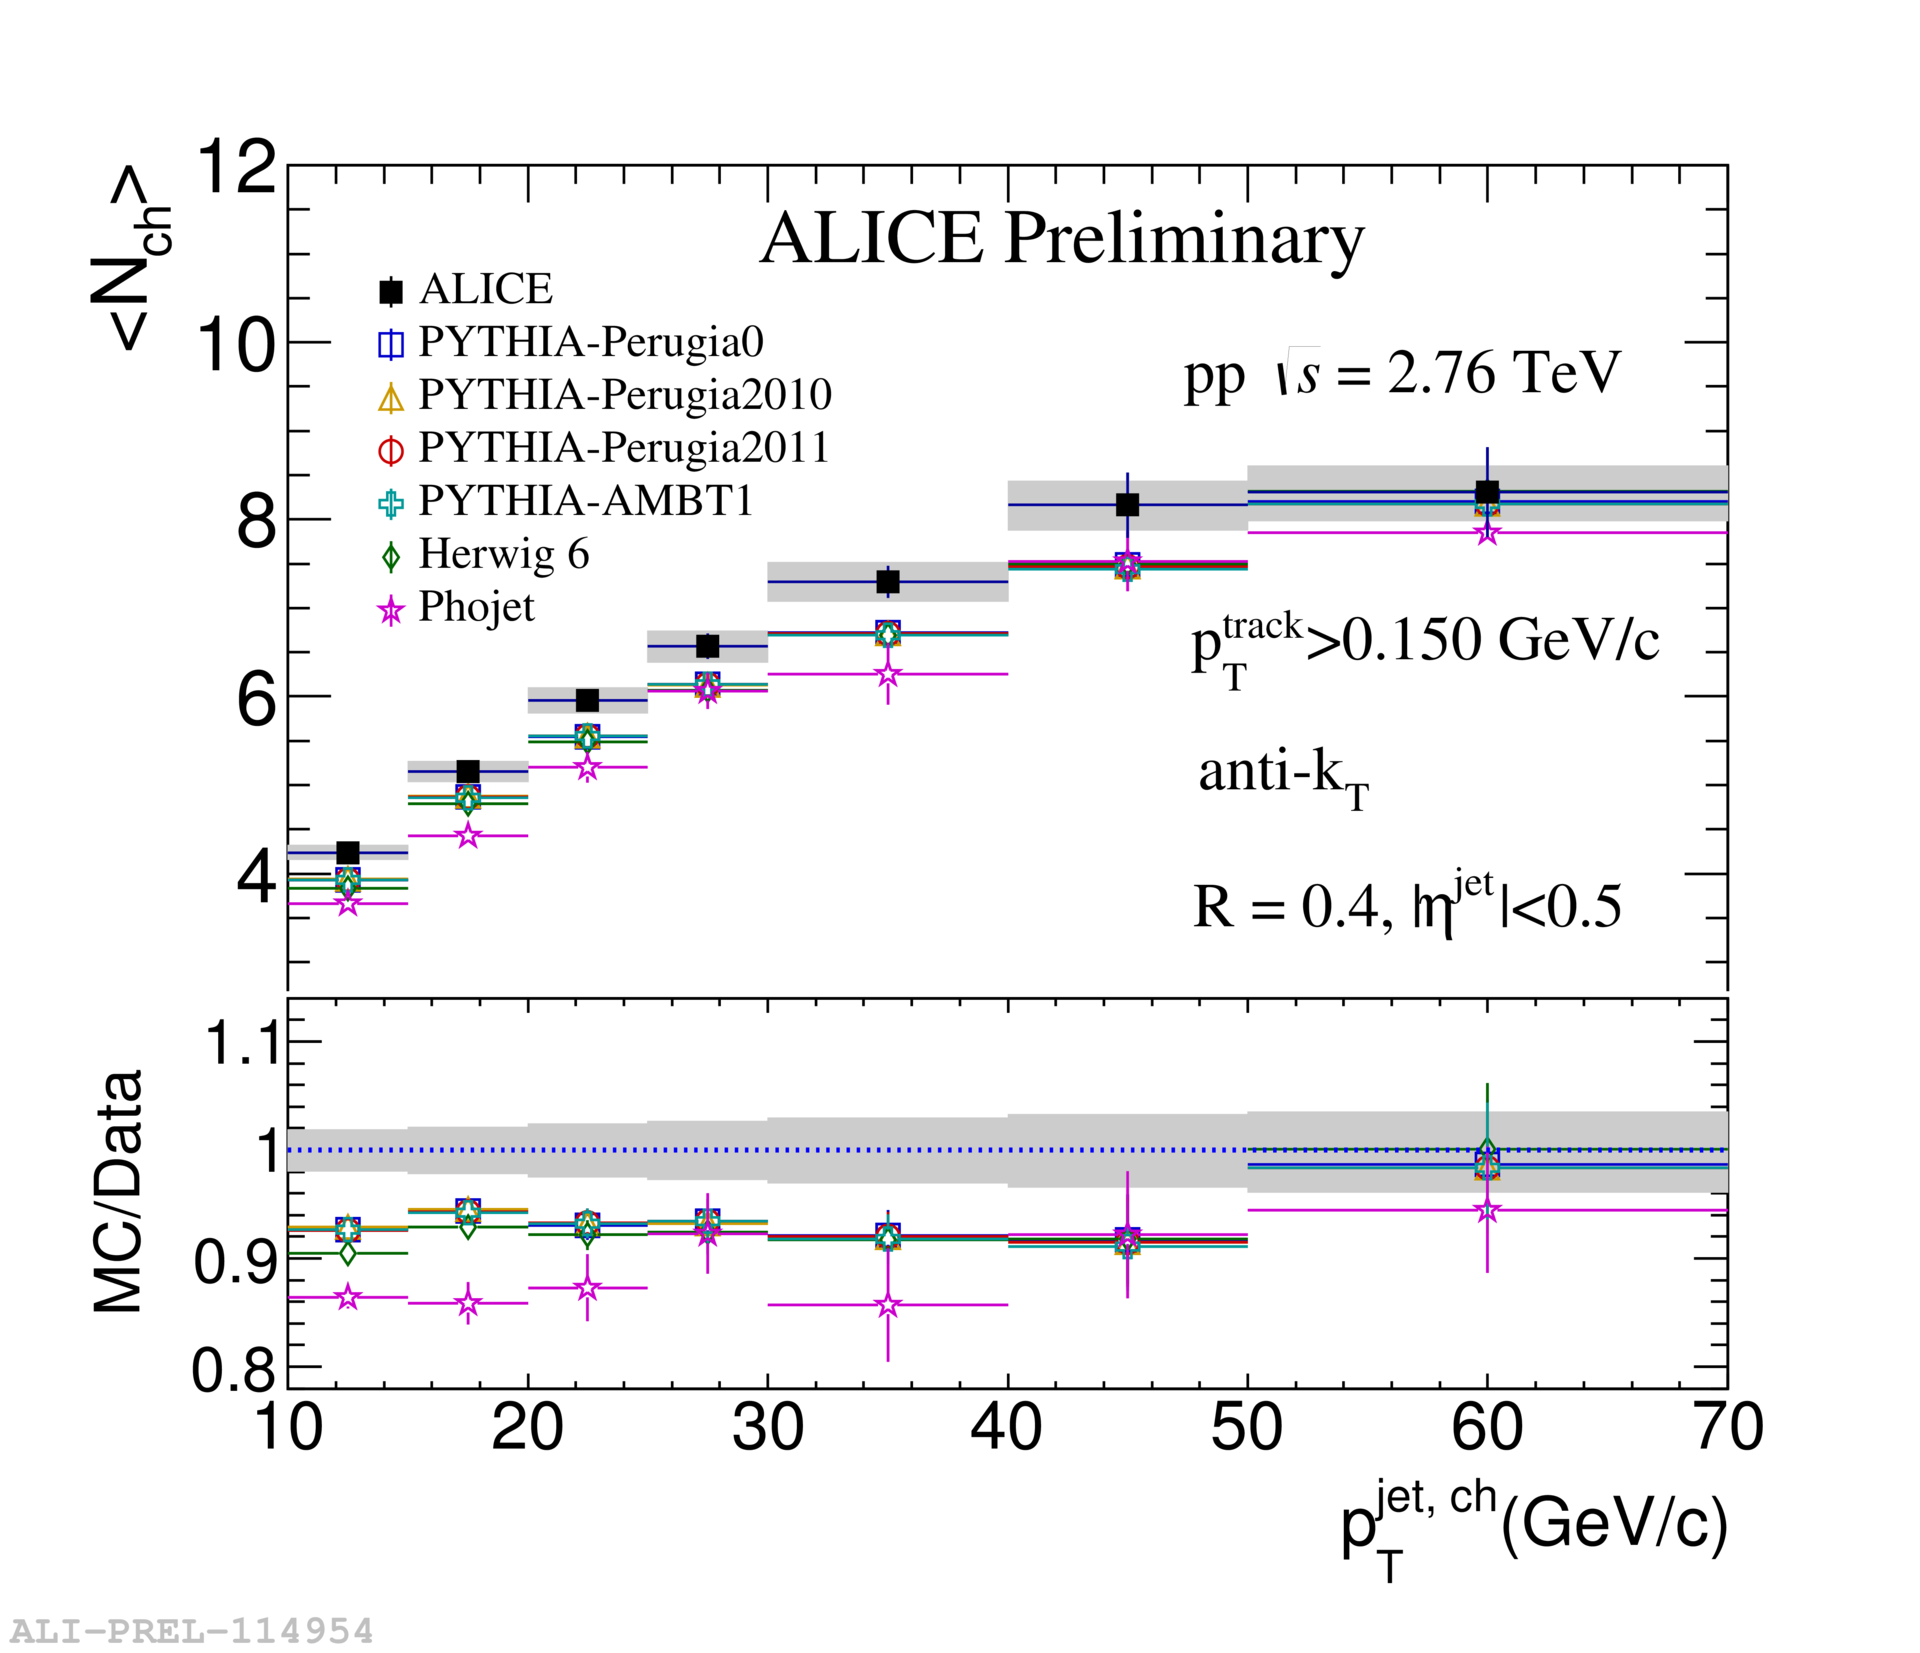
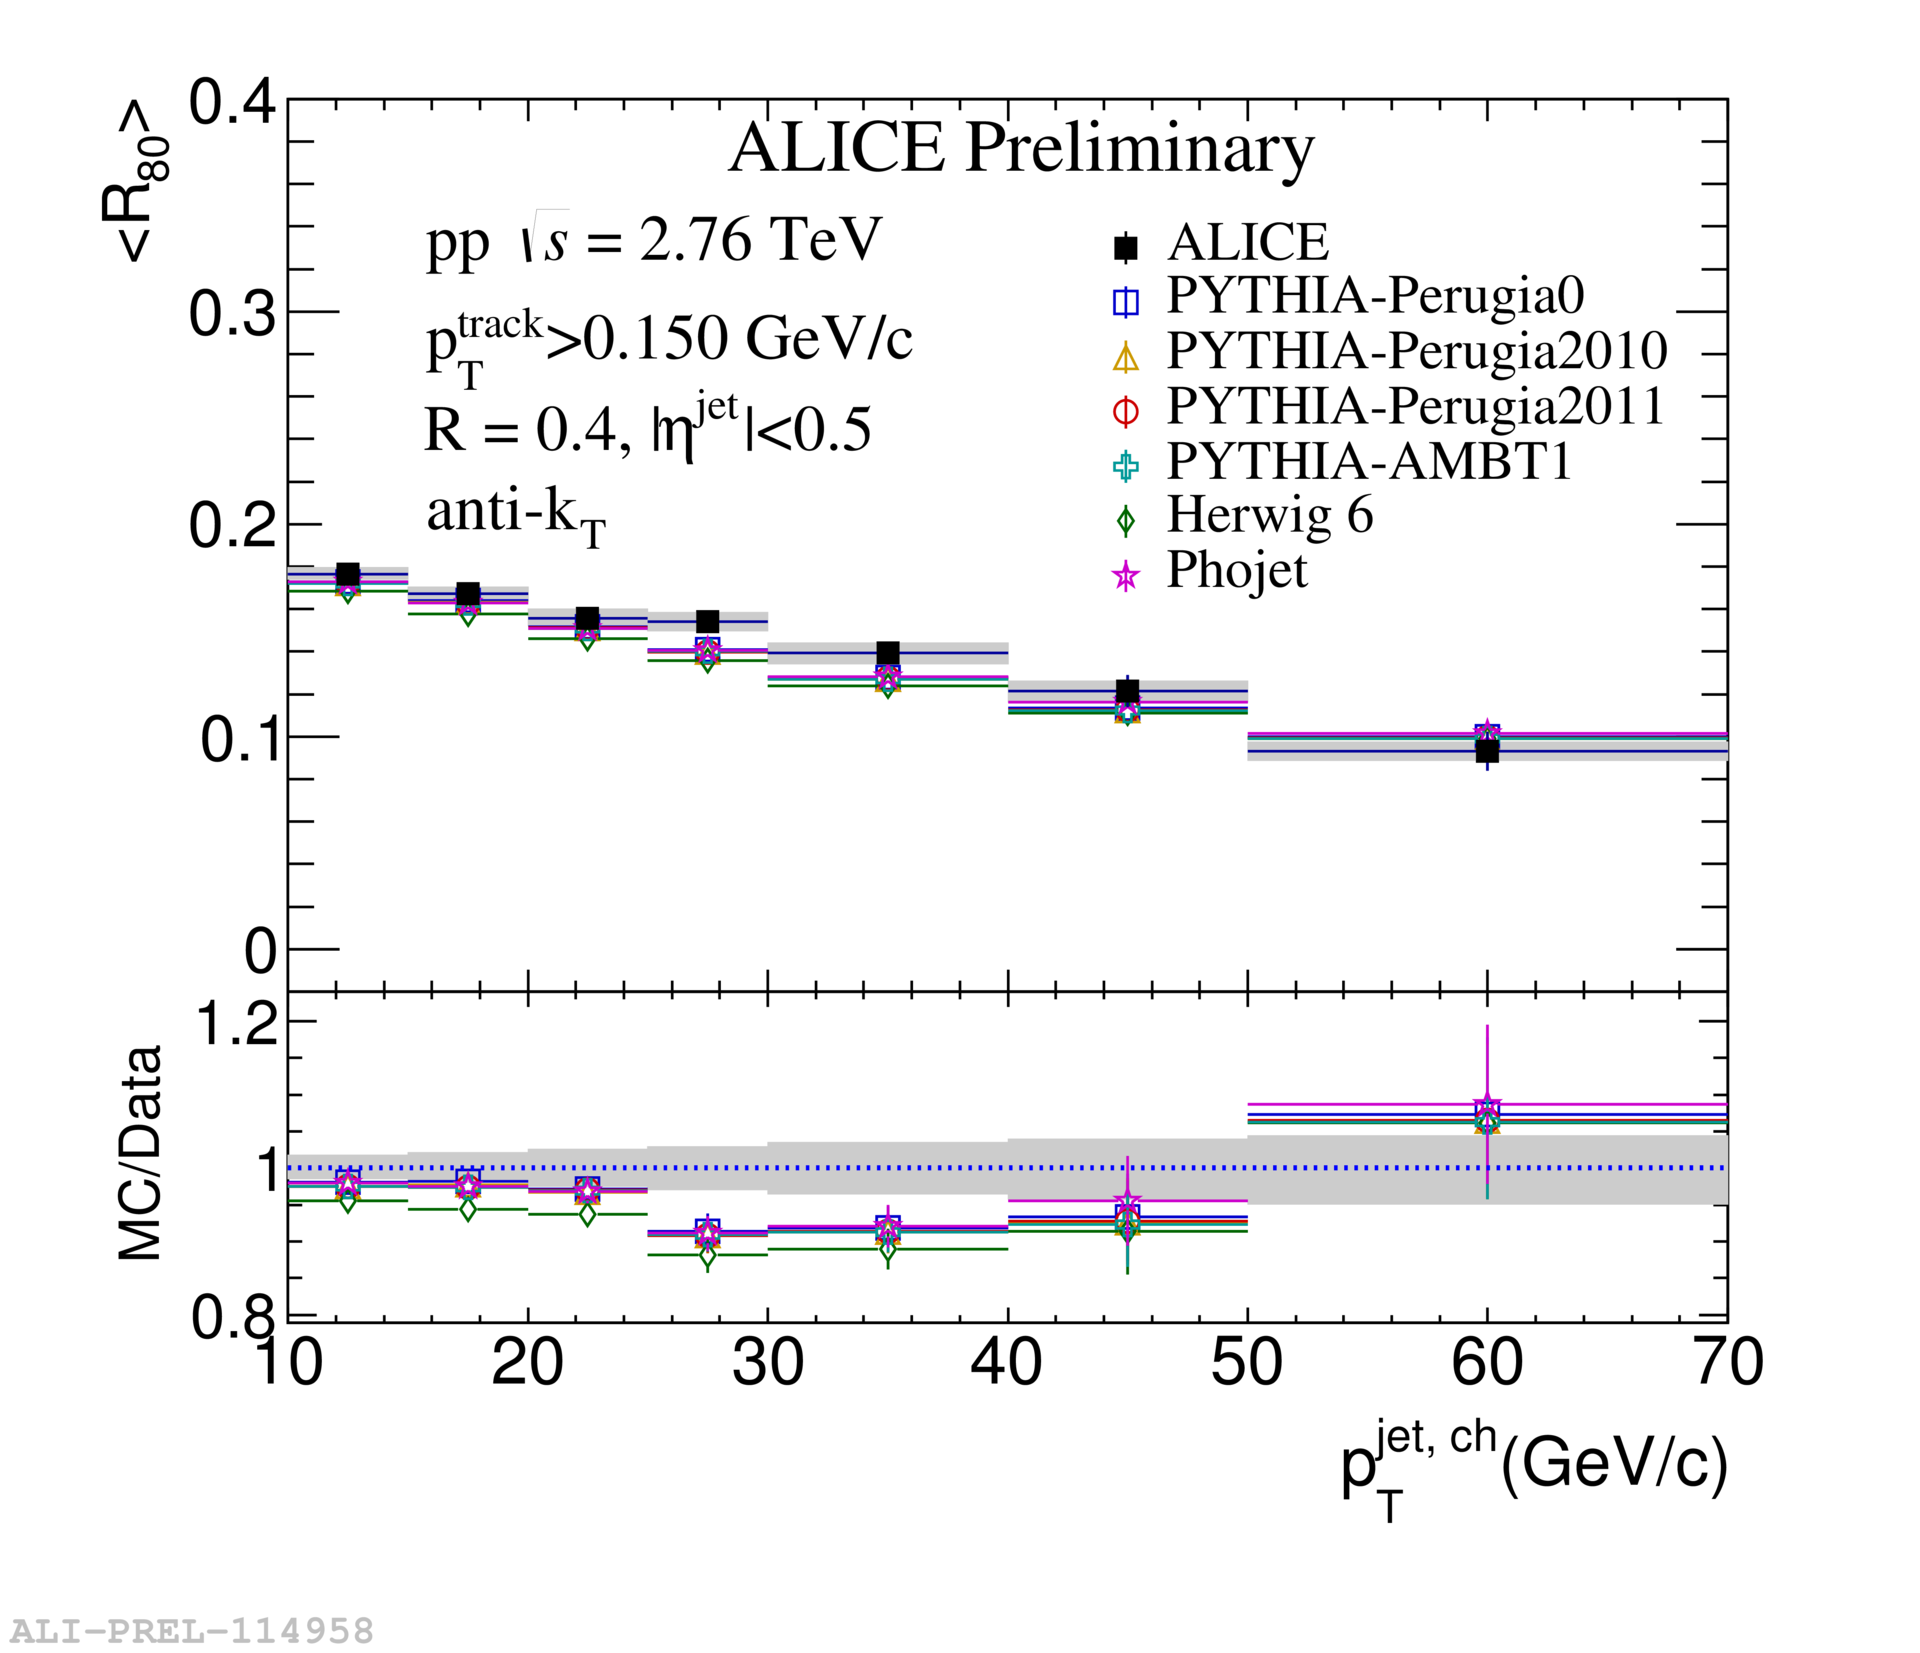
Figure 1 shows jet production cross sections for R = 0.2, 0.3, 0.4 and 0.6 (top), the N distribution for R = 0.4 (bottom left) and the R distribution for R = 0.4 (bottom right) as a function of jet pT. N increases monotonically with increasing jet pT as seen in earlier measurements. R is contained within half of the total radius for the lowest jet pT, and it decreases for higher jet pT. Different MC models such as HERWIG, PHOJET and different tunes of PYTHIA6 describe the data reasonably well. The results for N and R at 2.76 TeV are also compared to earlier measurements at 7 TeV (Fig. 2, top left and right) and as such we do not see any dependence within uncertainties.
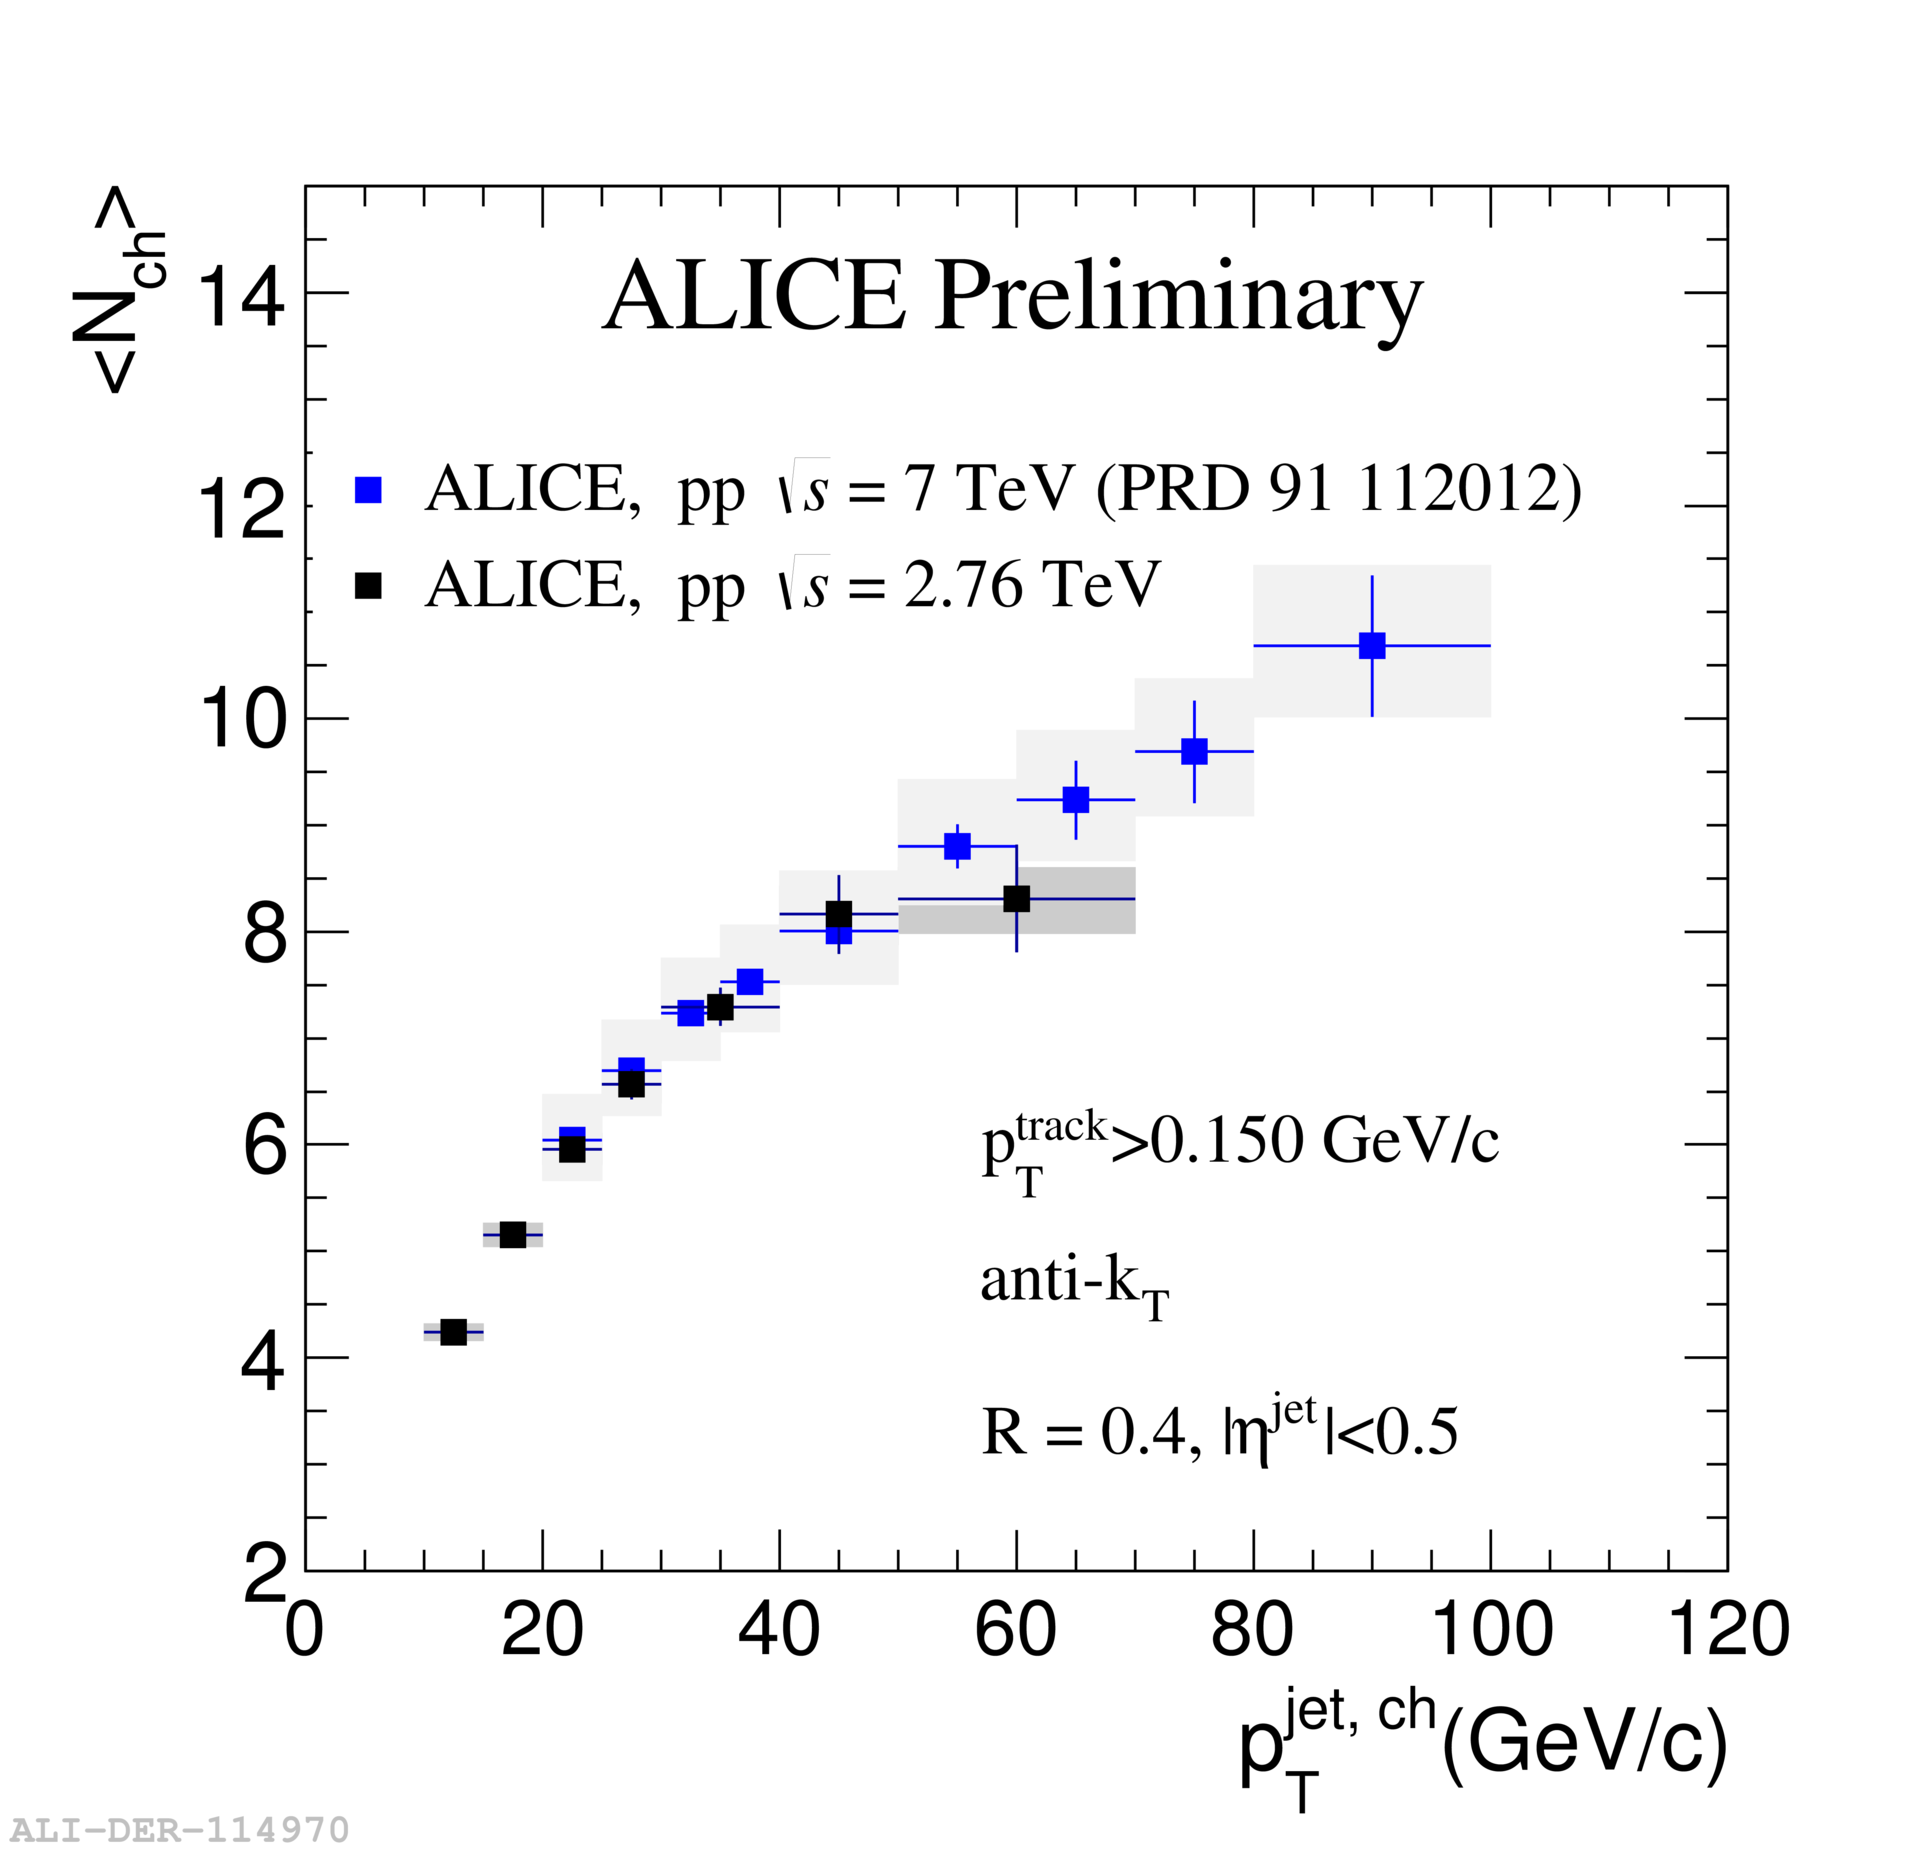
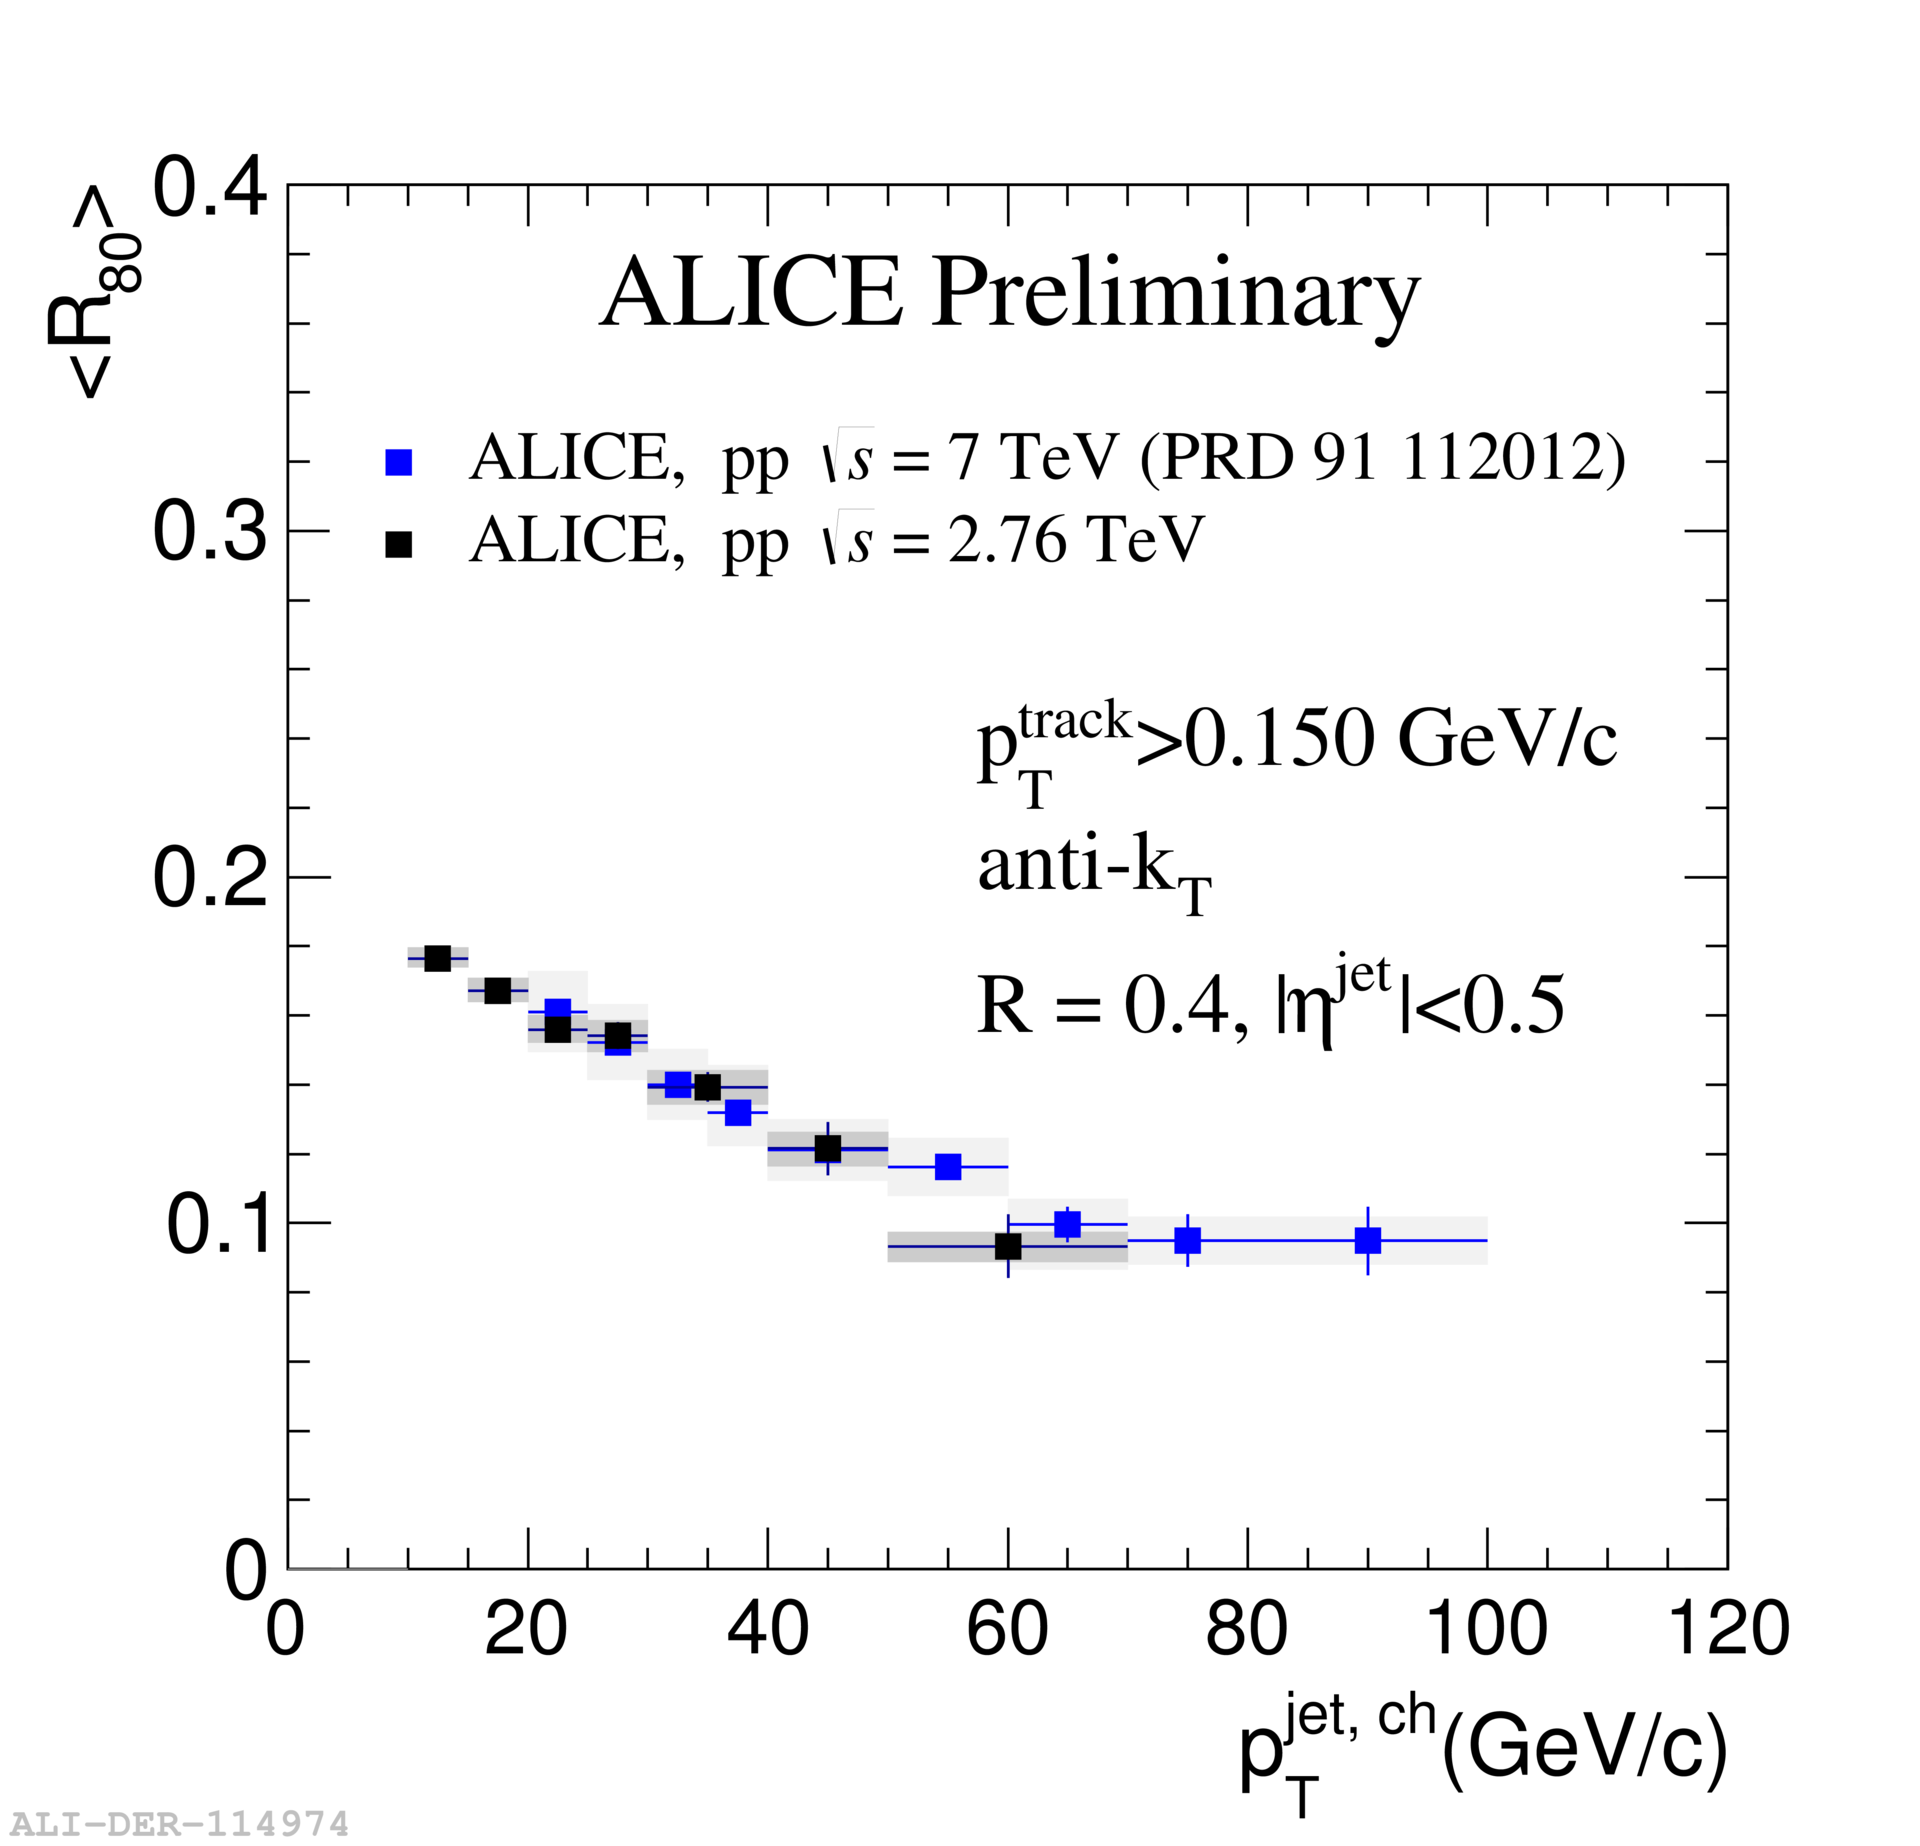
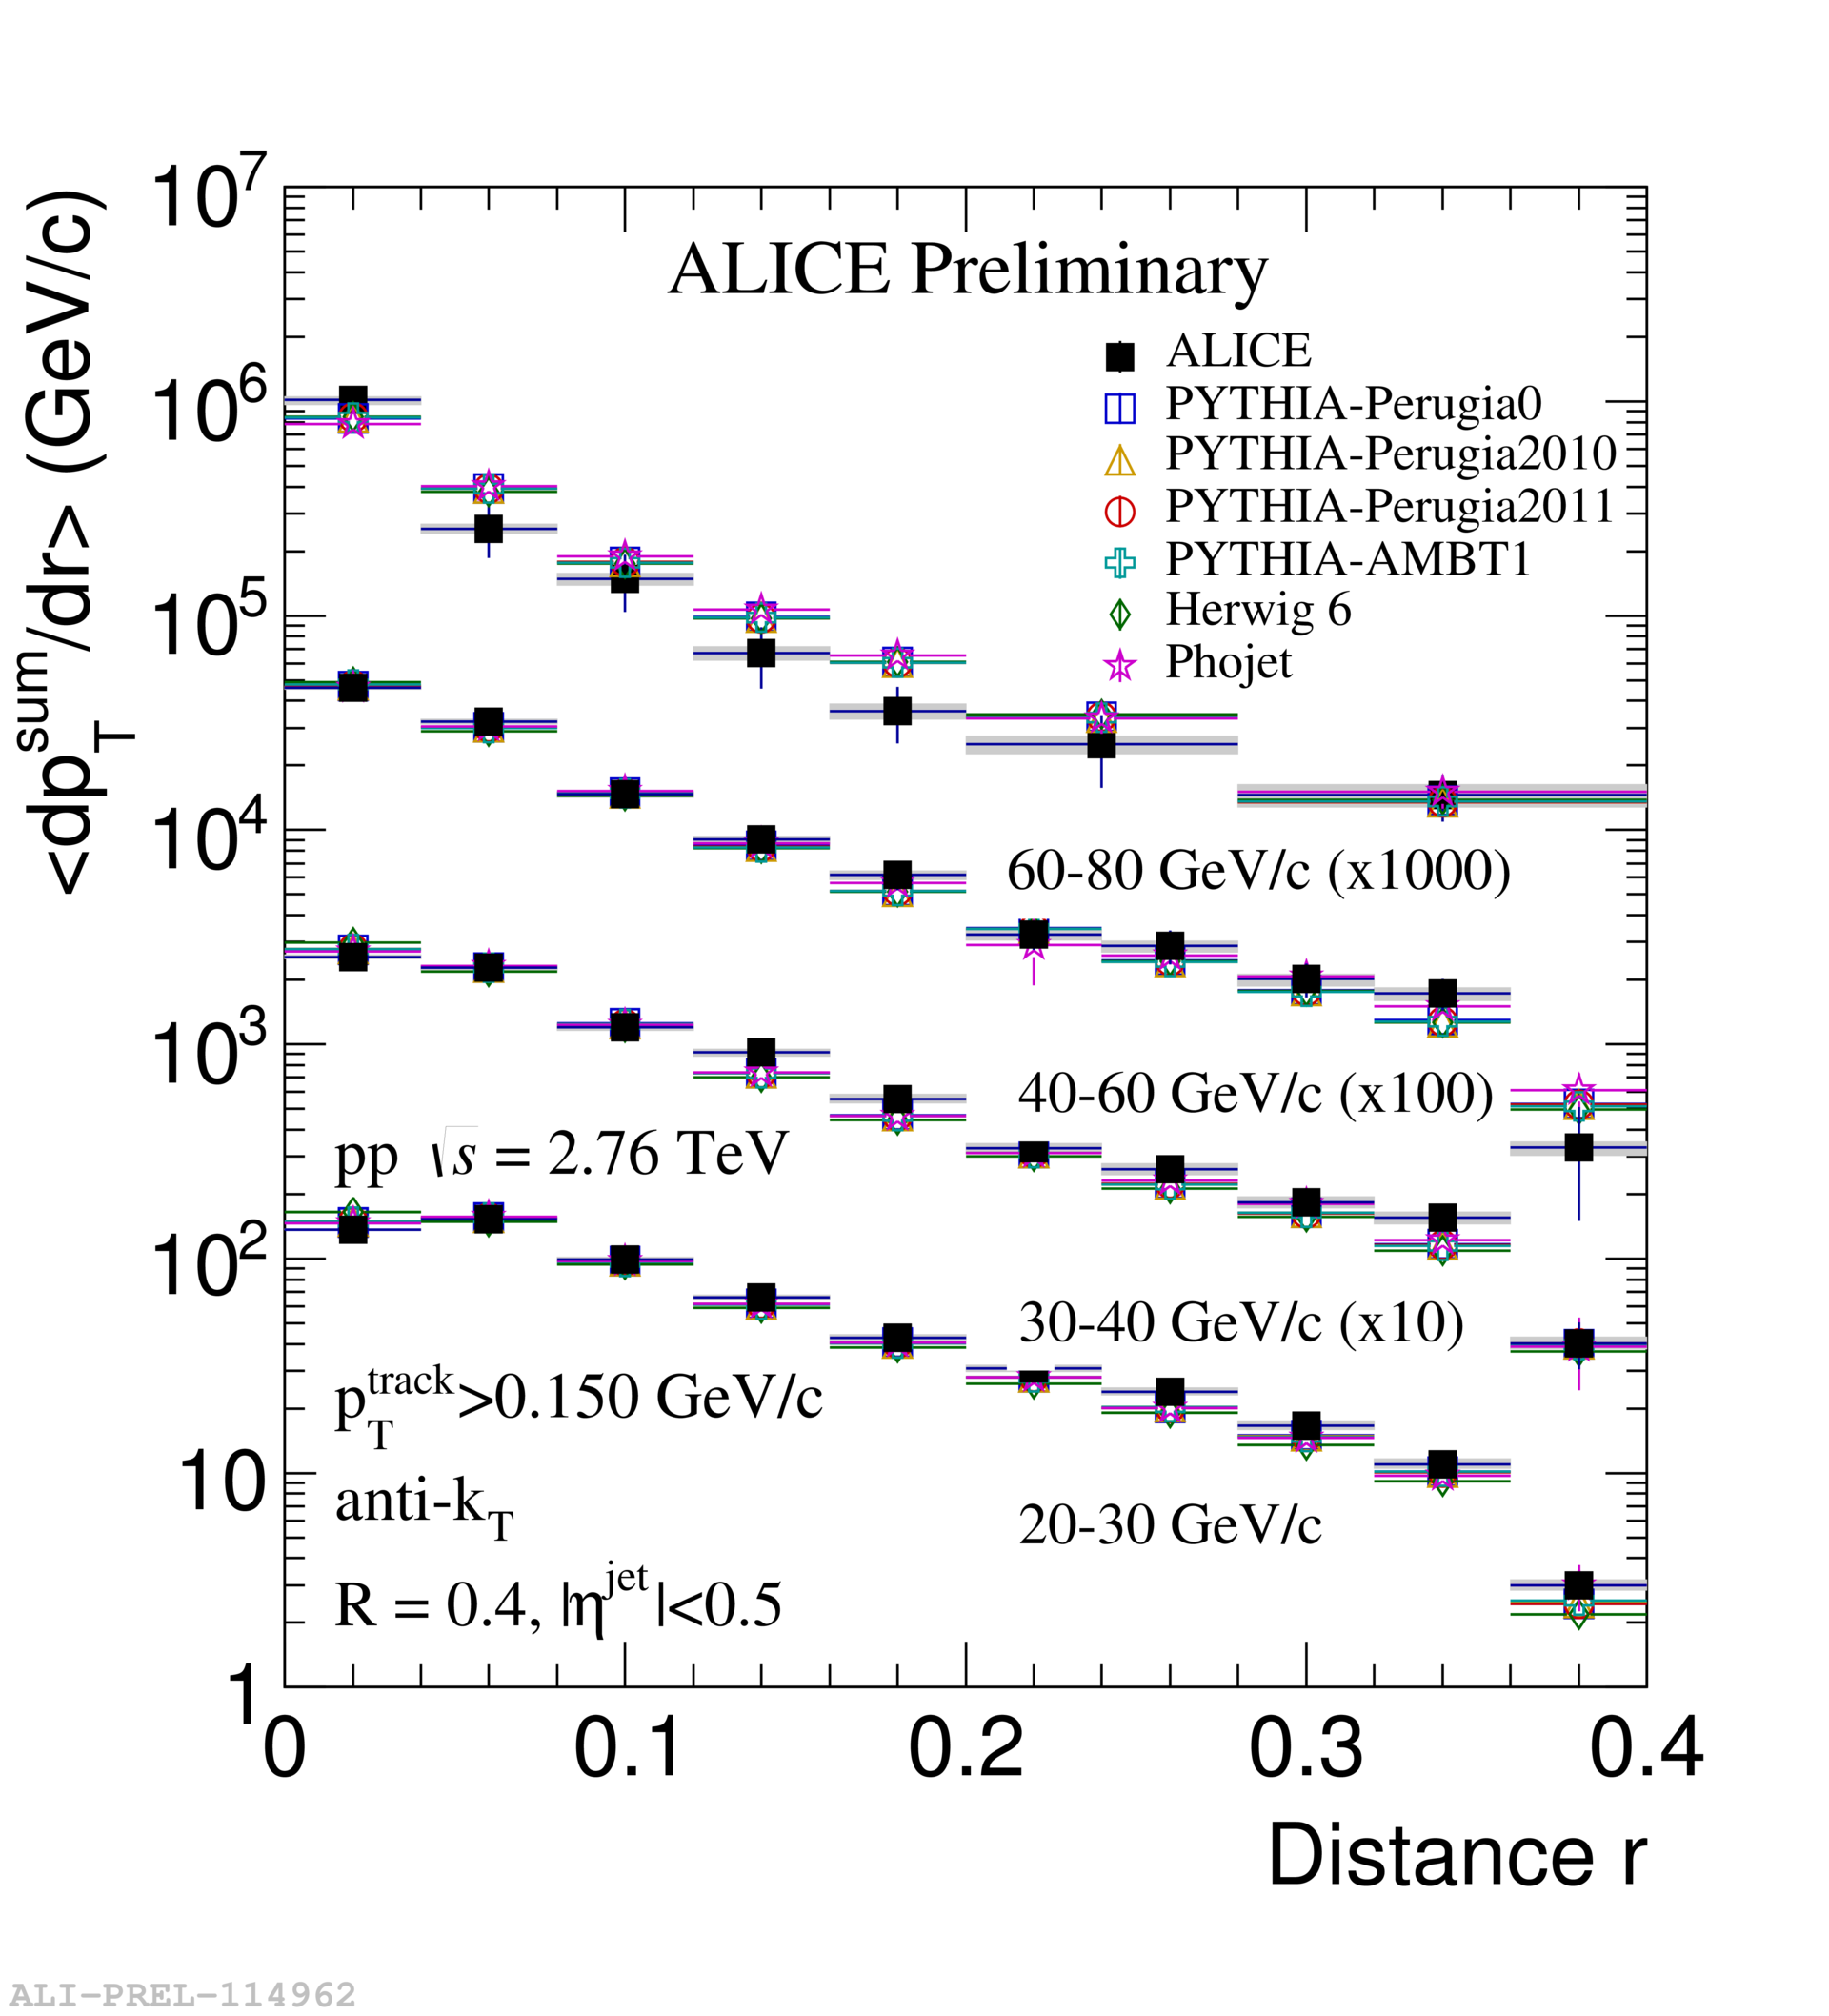
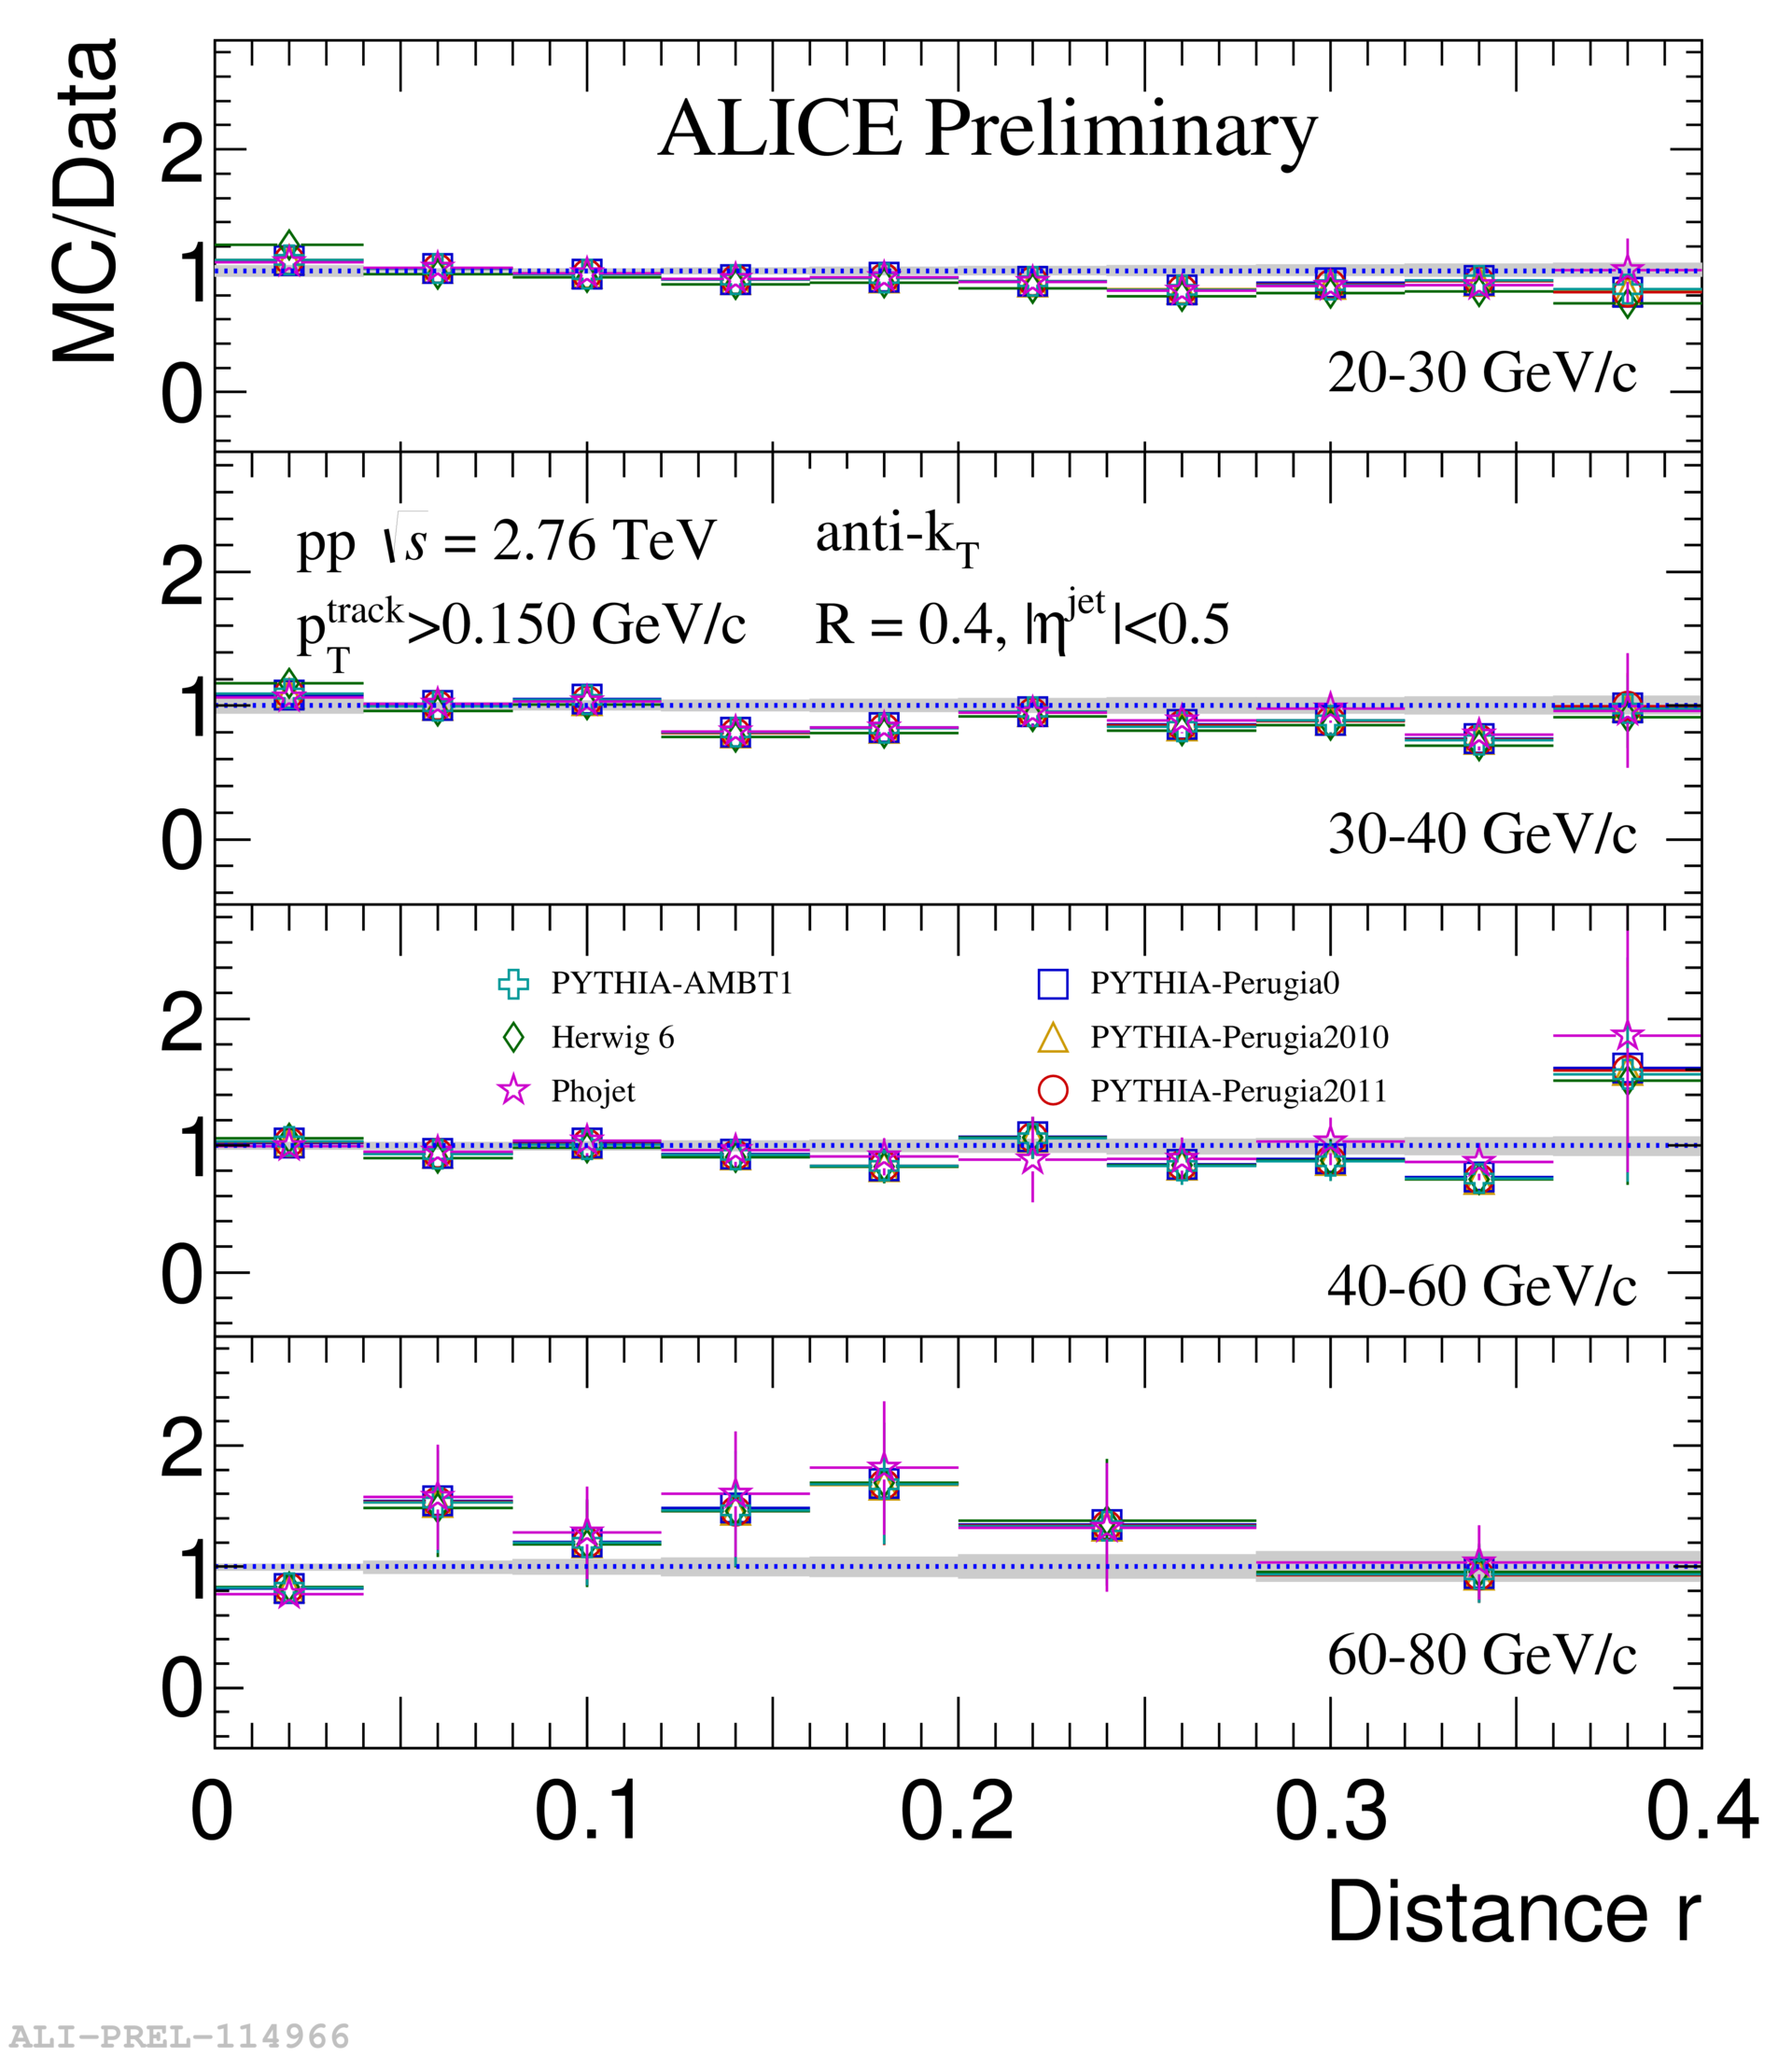
Figure 2 (bottom left) shows radial momentum distributions for four different jet pT bins as a function of distance from the jet axis. dpTsum/dr is largest near the jet axis and it decreases towards the periphery. The measurements from various MC models are in good agreement with the data as shown in Fig 2 (bottom right).
5 Conclusions
We reported measurements of charged jet cross section for R = 0.2, 0.3, 0.4 and 0.6 and jet shapes for R = 0.4 in pp collisions at 2.76 TeV with ALICE. N increases with increasing jet pT. Measurements of R and dpTsum/dr reveal that high pT jets are more collimated. Various MC models well reproduce the data within uncertainties except N which agrees within 15%. No dependence is seen within the measured uncertainties.
References
- [1] Cacciari M, Salam G P and Soyez G, JHEP 0804 (2008) 063
- [2] M. Cacciari and G. P. Salam, Phys.Lett.B 641 (2006) 57–61
- [3] G. D’Agostini, Nucl.Instrum.Meth.A 362 (1995) 487–498
- [4] R. Brun, F. Carminati, and S. Giani, CERN-W5013, CERN-W-5013, https://cds.cern.ch/record/1082634
- [5] ALICE Collaboration, JHEP 1207 (2012) 116