Vol. 000 No.0, 000–000
22institutetext: Central Department of Physics, Tribhuvan University, Kirtipur, Nepal
33institutetext: Institute of Astro-particle Physics, Innsbruck University, A-6020 Innsbruck, Austria
Preferred alignments of angular momentum vectors of galaxies in six dynamically unstable Abell clusters
Abstract
A spatial orientation of angular momentum vectors of galaxies in six dynamically unstable Abell clusters (S1171, S0001, A1035, A1373, A1474 and A4053) is studied. For this, two-dimensional observed parameters (e.g., positions, diameters, position angles) are converted into three-dimensional rotation axes of the galaxy using ‘position angle - inclination’ method. The expected isotropic distribution curves for angular momentum vectors are obtained by performing random simulations. The observed and expected distributions are compared using several statistical tests. No preferred alignments of angular momentum vectors of galaxies are noticed in all six dynamically unstable clusters supporting hierarchy model of galaxy formation. These clusters have a larger value of velocity dispersion. However, local effects are noticed in the clusters that have substructures in the 1D-3D number density maps.
keywords:
galaxies: evolution – galaxies: clusters: general – astronomical databases: miscellaneous.1 Introduction
The formation of galaxy cluster is one of the major unsolved problems of modern astrophysics. The process by which larger structures (e.g., clusters, superclusters) are formed through the continuous merging of smaller structures (e.g., galaxy, galaxy groups) is called hierarchical clustering, which is supported by concordance model (CDM). The study of preferred alignment of angular momentum vectors of galaxies in the clusters is one of the most effective ways of testing the concordance model. Godlowski et al. (2003) described Li (1988) model and showed the relation between the angular momenta and the masses of the large scale structures. This relationship was observationally tested by several authors (Godlowski et al. 2005, Hu et al. 2006, Aryal & Saurer 2006, Aryal et al. 2007, 2008, Godlowski et al. 2010, Godlowski 2012) and found the vanishing angular momenta for less massive structures and non-vanishing for larger structures.
Aryal et al. (2013) studied preferred alignments of angular momentum vectors of galaxies in six rotating clusters (A954, A1139, A1399, A2162, A2169, and A2366) that are dynamically stable and have a single peak in 1D-3D number density maps. These clusters have no substructures. They found a random orientation of angular momentum vectors of galaxies in all six clusters, supporting hierarchy model (Peebles 1969).
In the present work we intend to study preferred alignments of angular momentum vectors of galaxies in six Abell clusters namely S1171, S0001, A1035, A1373, A1474 and A4053 that have multiple peaks in 1D-3D number density maps with a larger value of velocity dispersion. These clusters have substructures. We intend to find out the answer of the following: (1) does the orientation of angular momentum vectors of galaxies that have substructures favor hierarchical clustering? (2) do the clusters with large velocity dispersion prefer a random orientation of angular momentum vectors of galaxies? and finally (3) does the substructure formation cause large velocity dispersion in the cluster? Our aim is to compare results with concordance model. The database and the methods are described in sections 2 and 3. Our results and conclusions are presented in sections 4 and 5.
2 Database
Hwang & Lee (2007, HL hereafter) proposed six rotating clusters (A954, A1139, A1399, A2162, A2169, and A2366) that are in dynamical equilibrium and show a single peak in 1D-3D number density maps. In addition, six dynamically unstable clusters (S1171, S0001, A1035, A1373, A1474 and A4053) that have multiple number-density peaks in 1D-3D maps with a large velocity dispersion are presented. After investigating substructure using Dressler-Scectman, HL classified rotating clusters into two category: (1) clusters with single number density peak and hence are in dynamical equilibrium and (2) clusters with multiple number-density peak and are dynamically unstable. In both cases, clusters have a very large value of velocity dispersion. In this paper we study the preferred alignments of angular momentum vectors of galaxies in the Abell clusters S1171, S0001, A1035, A1373, A1474 and A4053. Table 1 lists the the database (positions, BM type classification, mean redshift, velocity dispersion, number of galaxies in the cluster and its morphology) of six clusters (HL, Hwang 2011) used for this study.
3 Method
The PA-inclination method is used to convert two dimensional given parameters (positions, diameters, position angles) into three dimensional (galaxy rotation axes: angular momentum vectors and its projections) (Flin & Godlowski 1986). The expected isotropic distribution curves for angular momentum vectors and its projections are determined by performing a random simulation (Aryal & Saurer 2000). The observed distributions are compared with the expected using various statistical tests.
3.1 Observed distribution: angular momentum vectors of galaxies
The angular momentum vectors () of galaxies and its projections () to the galactic (G) and supergalactic (S) planes are obtained by using the method described by Flin & Godlowski (1986). For this, SDSS/2dFGRS database (positions, position angles and diameters) provided by Hwang (2011) are used. In the previous works (Godlowski 1994, Baier et al. 2003, Hu et al. 2006, and the references therein), authors have studied the preferred alignments of galaxies in clusters with respect to galactic or supergalactic (or both) system. The formulae to obtain angular momentum vectors () and its projection () in S-system are as follows (Flin & Godlowski, 1986):
| (1) |
| (2) |
The inclination angle () is the angle between line-of-sight and the normal to the plane of the galaxy. This angle can be calculated using Holmberg’s (1946) formula: cos = [–2]/(1–2) where is the measured axial ratio and is the intrinsic flatness of disk galaxies. Since the morphological information of galaxies are not known, therefore the value of intrinsic flatness () is assumed to be 0.2 (Aryal et al. 2007, Godlowski 2011a). The parameters , and are the supergalactic longitude, latitude and position angle, respectively.
The formulae (1) and (2) give two solutions for a galaxy. The reason for this is the approaching and receding sides of a galaxy, which can not be identified in our database. Therefore, there are four solutions for the preferred alignments of a galaxy: two each for angular momentum vectors and its projections. We count all these possibilities independently in the analysis.
3.2 Expected distribution: numerical simulation
Aryal & Saurer (2000) performed random simulations imposing various types of selections in the database and concluded that any selections can cause the changes in the expected isotropic distribution curves for both angular momentum vectors (polar angles) and its projections (azimuthal angles). We noticed following selection effects in our database: (1) the positions of galaxies in the clusters are inhomogeneous. (2) the PAs of face-on ( 0∘) are mostly unknown and (3) the deficiency of high inclination ( 0∘) galaxies. We perform random simulation method proposed by Aryal & Saurer (2000) in order to find expected isotropic distribution curves ( and ) by removing above mentioned selection effects. We apply cosmological principle by assuming isotropic distribution of angular momentum vectors of 107 virtual galaxies and use the formulae (1) and (2) in the random simulation. Therefore, the inclination angle () and latitude () are distributed as and , respectively and the variables longitude () and position angle (PA) are distributed randomly (Aryal & Saurer 2000).
3.3 Statistical tests
We perform chi-square, autocorrelation, Fourier (Godlowski 1993), Kolmogorov-Smirnov (K-S) (Press et al. 1992, Kanji 1995) and Kuiper-V (Kuiper 1962) tests in order in the observed and expected distributions to discriminate anisotropy from isotropy. The details about these statistical tests are given in the appendix of Aryal et al. (2007). The limits for anisotropy are as follows:
-
•
chi-square probability (P) 0.050,
-
•
auto-correlation coefficient (C/C()) 1,
-
•
first order Fourier coefficient (/()) 1,
-
•
Fourier probability (P()) 0.150,
-
•
K-S = 1
-
•
Kuiper-V = 1.
In last two statistical tests, null hypothesis (isotropy) is represented by “0” that can not be rejected at the chosen significance level whereas the value “1” designates that the null hypothesis can be rejected (anisotropy).
The first order Fourier coefficient () provides information regarding preferred alignments. A positive (negative) value of first order Fourier coefficient () in the -distribution suggests that the angular momentum vectors of galaxies tend to orient parallel (perpendicular) with respect to the reference coordinate system. Similarly, a positive (negative) in the -distribution indicates that the projections of angular momentum vectors of galaxies in the galactic (G) or supergalactic (S) planes tend to point radially (tangentially) towards the center of the reference coordinate system.
4 Results
Table 2 shows the values of statistical parameters with respect to galactic (G) and supergalactic (S) coordinate systems. In this section we discuss polar () and azimuthal () angle distributions of galaxies in each clusters separately.
4.1 Abell S1171
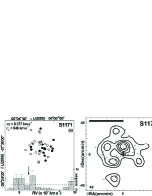
Abell S1171 is the spherically shaped nearby ( = 8 377 km s-1) cluster in our database (Table 1). HL noticed that a few galaxies have a large velocity deviations ( – 1 400 km s-1) from the cluster main body ( 8 400 km s-1). The position and radial velocity () distributions of member galaxies show a bimodal velocity distribution (Fig. 1a). A large number of substructures with central condensation can be seen in the number density map (Fig. 2b).
Figure 1c,d shows the polar () and azimuthal angle () distributions of member galaxies in S1171. The solid and dashed curves represent the expected isotropic distribution curves obtained from random simulation. The polar angle, = 0∘ (90∘) corresponds to the angular momentum vector tends to lie parallel (perpendicular) to the galactic/Supergalactic plane. All six statistical parameters suggest isotropy in the -distribution (see Table 2). No preferred alignment of angular momentum vectors of galaxies is observed with respect to the G- and S-coordinate systems. Therefore, a random orientation of angular momentum vectors of galaxies is noticed in the cluster.
In the -distribution, 0∘ corresponds to the projections of angular momentum vectors tend to point radially towards centre of the reference coordinate system (centre of the Milky way in G-system and Virgo cluster center in S-system). No humps and dips are observed in Fig. 1d, suggesting no preferred alignments. It can be concluded that the galaxies with a large velocity dispersion cause the cluster dynamically unstable as discussed by Godlowski (2011b).
4.2 Abell S0001
HL noticed substructures in 2D and 3D number density maps. A low-velocity tail at 7 800 km s-1 which is far from the mean radial velocity of the cluster can be seen in Fig. 2a. Fig. 2b shows two widely separated local minima, strongly suggests that the cluster might not be in the dynamical equilibrium.
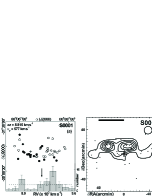
All six statistical parameters show isotropy in both the - and -distributions (Table 2). A very good correlation between the expected and observed distribution can be seen in the histograms (Fig. 2c,d), suggesting a random orientation of angular momentum vectors of galaxies. No preferred alignments of angular momentum vectors of galaxies in the cluster Abell S0001 is found.
4.3 Abell 1035
This cluster has the largest velocity dispersion with two subclusterings along north and south (Fig. 3a,b). HL found substructures in all maps (1D, 2D and 3D), suggesting a large but unequal velocity dispersion causing dynamically unstable. Using photometric database (Lauberts 1982), Aryal and Saurer (2006) studied the preferred alignments in this cluster and found that the angular momentum vector of galaxies tend to lie in the Local Supercluster (LSC) plane, supporting pancake model (Doroshkevich 1973) of galaxy formation. HL found that the angle between the rotation axes and the LSC plane is about 56∘, suggesting a bimodal distribution.
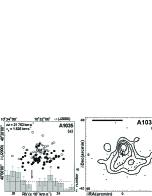
In the present study we used spectroscopic database (SDSS and 2dFGRS) and verified the prediction made by HL by observing a significant hump at 35∘ (1) in the -distribution (Fig. 3c), supporting bimodal distribution: angular momentum vectors of galaxies tend to lie both parallel and perpendicular with respect to the plane of the Milky way. In the -distribution, isotropy is noticed (Fig. 3d), suggesting that the choice of co-ordinate system is independent of preferred alignments.
4.4 Abell 1373
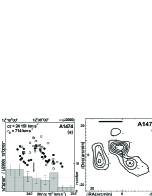
This cluster is the most distant ( = 37 595 km s-1) with bimodal velocity distribution spatially separated by the rotation axes (Fig. 4a). The number density map is similar to that of the cluster Abell 1035, i.e., substructure is seen in 1D-3D (HL).
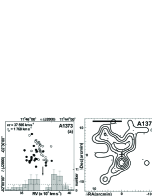
All statistical tests suggest isotropy in both the - and -distributions, advocating hierarchy model (Peebles 1969) of galaxy evolution. In the -distribution, a significant hump at 75∘ (1.5) can be seen (Fig. 4c). In addition, a dip at 45∘ (1.5) is followed by the hump. Therefore, a local tidal effect, probably due to the substructure formation, is noticed. In the -distribution, a hump at 85∘ ((2) and dips at 65∘ (1.5) and 75∘ (1.5) supports local effect (Fig. 4d).
4.5 Abell 1474
Einasto et al. (2001) studied Virgo-Coma supercluster and concluded that Abell 1474 is the member cluster of of that supercluster. HL noticed three substructures in the number density map (Fig. 5b), suggesting dynamically unstable rotating cluster which is not in the dynamical equilibrium because of large value of –.
The chi-square and autocorrelation tests show anisotropy in the -distribution, whereas isotropy is noticed in the Fourier, KS and Kuiper V tests. A hump at 25∘ (2) and a dip at 45∘ (1) suggest a local tidal effect because of the subsclustering (Fig. 5c). In the -distribution, significant humps at 45∘ (2) and 90∘ (1.5) supports it (Fig. 5d). Therefore, the spatial orientation of galaxies in the cluster Abell 1474 shows a weak preference in the alignments.
4.6 Abell 4053
Porter & Raychaudhury (2005) reported that the cluster A4053 is a member clusters of Pisces-Cetus supercluster. HL found that the cluster shows substructures in 1D and 3D maps. The number density map (Fig. 6b) shows elongation along north-east and south-west direction.
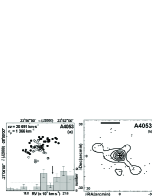
In the histogram of polar () angle distribution, a good agreement between the expected and observed distribution is noticed, suggesting no preferred alignments (Fig. 6c). All statistical tests support this. In the -distribution, humps (70∘, 50∘) and dips (20∘, 20∘) at 1.5 level are significant (Fig. 6d), suggesting anisotropy. Statistical tests support this result. Therefore, projections of angular momentum vectors of galaxies in A4053 tend to be oriented perpendicular towards the plane of the Milky way, whereas no preference is noticed with respect to Virgo cluster centre. Therefore a local effect can not be ruled out in the cluster which has a multiple number-density peaks and large value of velocity dispersion.
5 Conclusion
The preferred alignments of angular momentum vectors of galaxies in six clusters having multiple number-density peaks with a spatial segregation of high- and low-velocity galaxies are studied. We adopted ‘position angle - inclination’ method (Flin & Godlowski 1986) to compute three dimensional parameters (polar and azimuthal angles of the galaxy rotation axes) using two-dimensional observed parameters (e.g., positions, diameters, position angles). To remove selection effects from the database, a numerical simulation is performed, as proposed by Aryal & Saurer (2000). The observed and expected isotropic distributions are compared using five statistical tests namely, chi-square, auto-correlation, Fourier, K-S and Kuiper V.
In general, no preferred alignments is noticed for all six clusters supporting hierarchy model as predicted by Peeples (1969). However, local effects are noticed in the clusters that have substructures in 1D, 2D and 3D analysis (HL). Therefore, a large value of velocity dispersion with substructures in the clusters do not lead their galaxies to support pancake (Doroshkevich 1973) and primordial vorticity theory (Ozernoy 1978). A very good correlation between the hierarchy (Peebles 1969) and Li model (1998) is found, as in our previous work (Aryal et al. 2013). Therefore, vanishing angular momenta favor the formation of substructures in the clusters that have large velocity dispersion. The preferred alignment is found to increase with the cluster richness. Therefore it can be interpreted as an effect of tidal forces mechanism (Heavens & Peacock 1988, Catela & Theuns 1996, Stephanovich & Godlowski, 2015), but also is in agreement with Li’s (1998) model in which galaxies form in the rotating universe.
The tidal torque naturally arises in the hierarchical clustering scenario and hence the distribution of angular momentum vectors of galaxies becomes random. However, a tidal torque shear tensor (due to gravitational effect) can cause a local preference on angular momentum vectors as predicted by Lee (2004) and Trujillo et al. (2006).
Acknowledgements.
The authors thank the anonymous referee whose remarks contributed to improve the paper. We acknowledge Dr. Ho Seong Hwang of Department of Physics and Astronomy, Seoul National University, Korea, for providing database. One of the authors (SNY) acknowledges Central Department of Physics, Tribhuvan University, Nepal for all kinds of support for his Ph.D. work.References
- [1989] Abell G.O., Corwin H.G., Olowin R.P., 1989, ApJS, 70, 1
- [2013] Aryal B., Bhattarai H., Dhakal S., Rajbahak C., Saurer W., 2013, MNRAS, 434, 1939
- [2008] Aryal B., Kafle P., Saurer W., 2008, MNRAS, 389, 741
- [2007] Aryal B., Paudel S., Saurer W., 2007, MNRAS, 379, 1011
- [2006] Aryal B., Saurer W., 2006, MNRAS, 366, 438
- [2000] Aryal B., Saurer W., 2000, A&A, 364, L97
- [2003] Baier F.W., Godlowski W., MacGillivray H.T., 2003, A&A, 403, 847
- [1970] Bautz L.P., Morgan W.W., 1970, ApJ, 162, L149
- [1996] Catelan, P., Theuns, T., 1996, MNRAS, 282, 2, 436
- [2001] Colless M., Dalton G., Maddox S., Sutherland W., Norberg P., Cole S., Bland-Hawthorn J., et al., 2001, MNRAS, 328, 1039
- [1973] Doroshkevich A.G., 1973, ApJ, 14, L11
- [2001] Einasto M., Einasto J., Tago E., Mueller V., Andernach, H., 2001, AJ, 122, 2222
- [1986] Flin P., Godlowski W., 1986, MNRAS, 222, 525
- [2012] Godlowski W., 2012, ApJ, 747, 1, 7
- [2012] Godlowski W., 2011a, Acta Physica Polonica B, 42, 2323
- [2012] Godlowski W., 2011b, IJMDP, 20, 9, 1643
- [1993] Godlowski W., 1993, MNRAS, 265, 874
- [2012] Godlowski W., Piwowarska, P., Panko, E., Flin, P., 2010, ApJ, 723, 2, 985
- [2003] Godlowski W., Szydlowski, M., Flin, P., Biernacka, M., 2003, General Relativity and Gravitation, 35, 907
- [2005] Godlowski W., Szydlowski, M., Flin, P., 2005, General Relativity and Gravitation, 37, 615
- [1988] Heavens, A., Peacock, J., 1988, MNRAS, 232, 339
- [1946] Holmberg E., 1946, Medd. Lund. Astron. Obs., Ser. VI, No. 117
- [1993] Hu F.X., Wu G.X., Song G.X., Yuan Q.R., Okamura S., 2006, Ap&SS, 302, 43
- [2010] Hwang H.S., 2011, private communication
- [2007] Hwang H.S., Lee, M.G., 2007, ApJ, 662, 236 (HL)
- [1962] Kuiper N.A., 1962, in Proc. Kononklijke Ned. Akad.Wetenschappen, A 63, 38
- [1982] Lauberts, A. 1982, ESO/Uppsala Survey of the ESO B Atlas. ESO, Garching bei Muenchen
- [2004] Lee J, 2004, ApJ, 614, L1
- [1998] Li, L.-X. 1998, General Relativity and Gravitation, 30, 497
- [1978] Ozernoy L.M., 1978, In: Longair M.S., Einasto J., eds, Proc. IAU Symp. 79, The Large Scale Structure of the Universe. Reidel, Dordrecht, p.427
- [1969] Peebles P.J.E., 1969, ApJ, 155, 393
- [2005] Porter S.C., Raychaudhuary S., 2005, MNRAS, 364, 1387
- [1992] Press W.H., Teukolsky, S.A., Vetterlin, W.T., Flannery, B.P., 1992, in Numerical Recipes in C, 2nd ed. Cambridge University Press, Cambridge
- [2015] Stephanovich, V., Godlowski, W., 2015, ApJ, 810, 2, 14
- [1992] Trujillo I., Carretero C., Patiri S.G., 2006, ApJ, 640, L111