Triaging Content Severity in Online Mental Health Forums††thanks: This is a preprint of an article accepted for publication in Journal of the Association for Information Science and Technology © 2017 (Association for Information Science and Technology).
Abstract
Mental health forums are online communities where people express their issues and seek help from moderators and other users. In such forums, there are often posts with severe content indicating that the user is in acute distress and there is a risk of attempted self-harm. Moderators need to respond to these severe posts in a timely manner to prevent potential self-harm. However, the large volume of daily posted content makes it difficult for the moderators to locate and respond to these critical posts. We present a framework for triaging user content into four severity categories which are defined based on indications of self-harm ideation. Our models are based on a feature-rich classification framework which includes lexical, psycholinguistic, contextual and topic modeling features. Our approaches improve the state of the art in triaging the content severity in mental health forums by large margins (up to 17% improvement over the F-1 scores). Using the proposed model, we analyze the mental state of users and we show that overall, long-term users of the forum demonstrate a decreased severity of risk over time. Our analysis on the interaction of the moderators with the users further indicates that without an automatic way to identify critical content, it is indeed challenging for the moderators to provide timely response to the users in need.
1 Introduction
Mental health is an increasingly important health-related challenge in society; mental health conditions are associated with impaired health-related quality of life and social functioning (Saarni et al., 2007; Strine et al., 2015). Self-harm and suicide, as serious mental health conditions, are leading reasons of death world-wide (Nock et al., 2008; American Foundation for Suicide Prevention, 2016). Each year an estimated number of 43,000 Americans die by suicide, on average there are 117 suicides per day, and about 500,000 people visit hospital for injuries due to self-harm (Karch et al., 2009; Centers for Disease Control and Prevention, 2015; American Foundation for Suicide Prevention, 2016).
Despite its pervasiveness, our understanding of suicide and self-harm related issues is limited. A notable reason for this is lack of large scale data on suicide. Most existing research on suicide is based on sparse curated data from a limited number of health-care centers. Furthermore, detecting and preventing potential self-harm acts remain a significant challenge due to reasons including lack of real-time data, privacy and confidentiality issues, and existence of bias in studies (Coppersmith et al., 2016a).
As social media usage has increased dramatically, individuals have tried to resolve their health problems by sharing them online, asking other users’ opinions and seeking support. Therefore, social media have provided a valuable platform for large-scale analysis of mental health data and this analyses have offered great insights into mental health. Generally, it has been shown that social media can have broad applicability for public health research as the data from social media can reflect a variety of characteristics about individuals (Paul and Dredze, 2011; Eichstaedt et al., 2015).
Online forums are a type of social media which are essentially communities in which users engage in discussion about topics of common interest. Mental health forums are centered around users who have directly or indirectly been involved in mental health conditions.
General social media platforms such as Twitter and Facebook are less topic-centric and more general purpose, in the sense that millions of users use them to discuss mundane events in their lives. While the signals coming from general social systems such as Twitter and Facebook are subtle and not directly about mental health, they are relevant and they have been previously utilized to support certain important tasks (e.g. Coppersmith et al. (2015); Tsugawa et al. (2015); Schwartz et al. (2014)). On the other hand, online forums are specifically designed for discussion around specific topics and they attract users with similar interests and goals De Choudhury and De (2014). Some users in general social media such as Twitter can choose to be pseudonymous or anonymous, however, the identity of majority of the users are known. On the other hand, to protect their users, many online mental health forums such as ReachOut specifically ask their users to have anonymous profiles. The moderators in many of these forums further actively redact any post that could reveal the identity of the user. Such support for anonymity further encourages users to engage in sensitive mental health discussions and express their real thoughts and feelings. In this paper, we are focusing on online mental health forums as anonymous support platforms centered around people with similar experiences and problems.
There are three stages that lead to suicidal action among individuals who are in some sort of mental distress (Silverman and Maris, 1995; De Choudhury et al., 2016): 1- thinking, 2- ambivalence and 3- decision making. In the first two stages the individual is experiencing thoughts of distress, hopelessness, and low self-esteem. In the decision making stage, the individual might show explicit plans of taking their life. Individuals might seek support in any of these stages and online health forums are a ready platform enabling these individuals to ask for support. In many online mental health forums, there are moderators or more senior members who help the users with mental distress. Troubled users who are at risk of self-harm need to be attended to as quickly as possible to prevent a potential self-harm act. However, the volume of newly posted content each day makes it difficult for the moderators to locate and respond to more critical posts. Effective online manual triaging of all the forum contents is highly costly and not scalable.
We propose an approach for automated triaging of the severity of user content in online forums based on indication of self-harm thoughts. Triaging the content severity makes it possible for moderators to identify critical posts and help a troubled user in a timely manner to hopefully reduce the risk of self-harm to the user. We propose a feature-rich supervised classification framework that takes advantage of various types of features in the forums. The features include lexical, psycholinguistic, contextual, topic modeling, and dense representation features. We evaluate our approach on data provided by ReachOut111www.ReachOut.com, a large mental health forum. We show that our approach can effectively identify the critical content which will assist the moderators in attending to the in-need users in a timely manner. We show that without an automatic way for identifying critical posts, the moderator’s response time does not correlate with the severity of the posts, which further confirms that manually identifying these posts is a challenge for moderators. Finally, analysis of the user content on this forum shows that on average, the content severity of users tends to decline as they interact with the forum which is evidenced by the transition from more critical to less critical content.
The contributions of this work are as follows: (i) an effective approach for triaging the content severity in online mental health forums based on indication of self-harm ideation; (ii) providing insight into the effect of online mental health forums on users through analysis of their content; (iii) analyzing the interaction of moderators with users; and (iv) extensive evaluation of the proposed approach on a real-world dataset.
2 Related Work
2.1 Healthcare and Mental Health through Social Media
In recent years, healthcare has benefited enormously from social media data (Dredze, 2012). Many studies have investigated public health surveillance by utilizing the Twitter public data (Paul and Dredze, 2011; Lamb et al., 2013; Parker et al., 2015; Chen et al., 2016; Paul et al., 2016). Results of these studies show consistency with other information resources for public health such as official reports released by governments, reports released by Centers for Disease Control and Prevention (CDC) and other online sources such as Google Flu Trends111https://www.google.org/flutrends/.
Social media has also become a popular platform for people with mental health conditions to express their feelings and seek support from other users. It has helped individuals with depression by providing them means to connect to people with shared experiences who can answer their questions (Dao et al., 2015; Olteanu et al., 2016). Consequently, the information from social media has become a significant resource providing more insight into psychological and mental conditions and problems. De Choudhury et al. (2013b) explored social media to identify and diagnose depression among individuals. They analyzed the posting of a set of Twitter users through time and identified signals for characterizing the onset of depression in individuals. Park et al. (2013) showed that depressed individuals perceived social media (Twitter) as a tool for social awareness and emotional interaction while non-depressed individuals are mostly regular information consumers. Schwartz et al. (2014) used Facebook data to build a regression model to predict degree of depression in individuals. Portier et al. (2013) conducted sentiment analysis on the cancer survivor forum content and compared the sentiment change of the user content before and after interaction with the community. There exist many other works on analysis of social media for mental health problems such as depressive disorders De Choudhury et al. (2013a); Tsugawa et al. (2015), addiction (Murnane and Counts, 2014), insomnia (Jamison-Powell et al., 2012), schizophrenia (Mitchell et al., 2015) and various other conditions (Coppersmith et al., 2015).
While many of the aforementioned mental health disorders are closely related to suicidal behaviors and could lead to suicidal ideation, our focus in this paper is to identify the severity of the content based on indication of self-harm risk to individuals.
2.2 Social Media and Suicide
Previous work has studied self-harm and suicidal behavior through text analysis. Some researchers explored the language usage in content relating to suicide to identify signals of this behavior to predict suicidal actions. Thompson et al. (2014) predicted the risk of suicide in military personnel and veterans using the clinical notes and online social media data (Facebook posts). They used a model based on Random Forest classifier (Breiman, 2001) with bag-of-words features. Jones and Bennell (2007) developed statistical prediction rules to discriminate between genuine and simulated suicide notes. Lester (2010) analyzed the language of suicide notes to better understand suicidal behaviors in individuals. Coppersmith et al. (2016b) examined data from Twitter users who have attempted to take their life and provided an exploratory analysis of patterns in language around their attempt. . Some researchers have analyzed suicidal behaviors through detecting sentiment and emotional variations of the content (Cherry et al., 2012; Pestian et al., 2012; Desmet and Hoste, 2013). Prior work has also explored classification of suicidal content. Burnap et al. (2015) proposed an ensemble classification approach to classify tweets into suicide related topics such as suicidal ideation, reporting of a suicide, memorial, campaigning and support. Braithwaite et al. (2016) conducted a user study on a group of individuals and analyzed their Twitter posts using Decision Tree classifier to differentiate individuals with higher suicide risks from individuals who are not at risk. Finally De Choudhury et al. (2016) proposed that social media could be used to predict shifts from mental health discussions to expression of suicide thoughts. Specifically, they analyzed language in Reddit222https://www.reddit.com/mental health community and employed a framework based on propensity score matching (Rosenbaum and Rubin, 1984) to predict suicidal shifts in users. Unlike these works, our focus is triaging the content severity in mental health online forums based on the risk of self-harm to the users.
The closest work to ours is the recent shared task (Milne et al., 2016) on automatic identification of content severity in mental health forums by the 2016 Computational Linguistics and Clinical Psychology Workshop (Hollingshead and Ungar, 2016). 16 teams participated in this challenge and a variety of methods have been proposed. Most of the systems, generally used Support Vector Machine (SVM) classifiers (Cortes and Vapnik, 1995) or an ensemble of some other standard classifiers for identifying the content severity. We briefly describe the top 3 approaches: Kim et al. (2016) used a Stochastic Gradient Decent classification framework. They utilized the body of the text as the main source for feature extraction and represented the post by weighted TF-IDF333Term Frequency - Inverse Document Frequencyunigrams and distributed representation of documents (Le and Mikolov, 2014). Malmasi et al. (2016) used a hierarchical classification framework. They employed a Random Forest meta-classification approach on top of a set of base classifiers. Finally, Brew (2016) used SVM with Radial Basis Function (RBF) kernel; they utilized TF-IDF unigram and bigram features, author type, post information and position of the post in the thread as the features for the classifier.
In contrast to these works, our approach is feature-rich; many features that we use are not present in the aforementioned prior work, such as psycholinguistic, contextual, topic modeling and skip thought features (see the Methods section for details). We also utilize an ensemble classifier using different subsets of features. Our proposed model outperforms the state-of-the-art by large margins.
This work extends our earlier effort in the CLPsych workshop where we used a Logistic Regression classifier to identify the severity of the posts (Cohan et al., 2016). We achieve up to 24% F1 score improvements over our previous results at CLPsych 2016. The improvements are due to utilizing a better learning algorithm, extending the feature sets and introducing our new ensemble model. Our models outperforms the state-of-the-art by large margins.
While the aforementioned works only focus on triaging the content severity, we further utilize the triaging model to perform analysis of user interactions in this forum to gain insight on the impact of the forum on the users with mental health issues. We analyze the moderators’ response time to users and show that without an accurate and efficient content triaging system, manually identifying severe posts in forums with large number of users is indeed difficult.
3 Severity Triaging
Our main objective is to determine the severity of the mental health forum posts based on signs of self-harm thoughts in the content. Triaging content severity enables moderators to attend to severe cases in a timely manner and hopefully prevent a potential self-harm attempt.
Our approach for triaging the content severity is a supervised learning framework. In the following, we first define the severity categories, then we explain the features that we use for the classification and finally, we describe the learning algorithm.
3.1 Severity categories
We consider the following 4 levels of severity for the post content, as defined by (Milne et al., 2016):
-
•
Green - posts that do not show any signs or discussions about self-harm and thus do not require direct input from the moderators. These posts are usually general statements or follow up discussions that do not reflect any major concern.
-
•
Amber - posts that include minor clues that might indicate signs of struggle by the user. These posts need the moderator’s attention at some point, but prompt intervention is not necessary.
-
•
Red - posts indicating that the user is in acute distress and moderators should attend to them as soon as possible.
-
•
Crisis - posts indicating that the user is in imminent risk of self-harm. These posts could be about the authors themselves or someone that the author of the post knows. Moderators should prioritize these cases above all others.
Table 1 shows synthesized examples of posts in each of these severity categories444The provided examples throughout this paper are very similar to the ones in the ReachOut forum. According to the data collection policies on protecting users’ identities, we are unable to include the exact posts from the forum.. Following the terminology used by Milne et al. (2016), we consider the union of crisis, red and amber categories as flagged posts, because they indicate that user might be at risk and needs attention at some point. Similarly, we consider the union of two more critical categories, i.e crisis and red as urgent.
| green | amber | red | crisis | |||||||||||||||||||
|---|---|---|---|---|---|---|---|---|---|---|---|---|---|---|---|---|---|---|---|---|---|---|
|
|
|
|
Due to large volume of posts produced each day, it is not possible for moderators to identify all the critical posts in a timely manner. Our goal is to predict the severity of the forum posts’ content so that the moderators can locate critical cases and attend to them as soon as possible. We propose a feature-rich machine learning approach utilizing psycholinguistic, topic modeling and contextual features.
3.2 Features
Since the forum posts are written in unstructured raw text, we extract representative features from the text that are helpful for the supervised learning. Particularly, we extract the following categories of features:
-
•
Bag of words An standard approach for text representation is to model the text with bag of its constituent words. This results in a sparse vector for each text in which each element associates with a word in the vocabulary and is weighted according to some weighting scheme. We use the unigram and bigram bag of words representation of text with frequency of terms as their weights. Throughout the paper, when we refer to some textual content (e.g. post body) as features, we are essentially referring to the unigram and bigram bag of words representation of that text, unless otherwise noted. Before representing the text with bag of words features, we perform standard minimal preprocessing on it by lowercasing and removing stopwords.
-
•
Psycholintuistic The psycholinguistic features are meant to capture the different dimensions of a user’s mental state through analysis of their language usage.
-
–
LIWC: Linguistic Inquiry and Word Count (LIWC) (Pennebaker et al., 2015) is a tool that captures quantitative data regarding various psychological dimensions given the user’s textual writings. It utilizes several psychological lexicons along with a text analysis module that associates text with different psychologically-relevant categories. We use this tool to extract different psychological attributes from the language expressed in the users’ posts. While LIWC provides over 100 distinct attributes, our experimentation showed that the affective attributes, drive attributes, tonality, informal language usage, anxiety attributes and negation are the most helpful for this task.
-
–
Emotions: Emotions are very closely related to suicide. Therefore, the emotion that is reflected by the post can be a good indicator about level of severity of the content. For example, if a user’s post indicates the “anger” emotion, it is more likely to be severe in comparison with a post that shows the “happiness” emotion. To quantify the emotions associated with a specific post, we use DepecheMood (Staiano and Guerini, 2014), a lexicon with emotional probabilities associated with more than 37000 terms. The emotions considered by the lexicon are “fear”, “amusement”, “anger”, “annoy”, “apathy”, “happiness”, “inspiration” and “sadness”. To obtain the overall distribution of emotion over these categories for a post, we average the emotion distribution of all words in the post to obtain probability of each emotion given the post. We use these probabilities as features for the classification. In addition to the specific probabilities, we also consider the dominant emotion of the post as a separate feature.
-
–
Subjectivity: Similarly, subjective posts are more likely to be related to a severe post than an objective post. We utilize the MPQA subjectivity lexicon (Wilson et al., 2005) to differentiate between the subjective and objective posts. This lexicon contains contextual subjectivity about words or phrases that indicates expression of an emotion, opinion, stance, etc.
-
–
-
•
Contextual One characteristic of online forums is that they are designed to support user discussion. Therefore, having information about the context of a given post in the discussion thread provides additional information about its content. We extract the following contextual features:
-
–
Author’s prior posts: Author’s prior posts in the thread captures the development of thoughts by the user and also in combination with the body of the post captures whether the post deviates from the author’s prior posts in a significant way.
-
–
Prior discussion: The posts preceding a target post and written by other users help in capturing surrounding discussion and development of thoughts for the target user. Specifically, we consider a window of 3 posts by other users preceding the target post as the context of the post in the thread. Limiting the window size to 3 is due to our observation that in long threads, the discussion usually deviates after a few posts, hence considering all the posts would introduce noise to the model555We experimented with context window of sizes 1 to 5. The best performance was for context size of 3, therefore we chose window of 3 posts as the context size.. We could also consider the posts succeeding the target post as additional features, however, that would not correspond to a real-world scenario. In a realistic setting, the goal is to triage the content on the forum as soon as they are posted and therefore, to comply with this setting, we do not consider any features relating to content submitted after the target post.
-
–
Last sentence: Finally, some critical posts are long, and mostly about some mundane and usual events that happen; in these posts, there is a sudden change at the end of the post indicating that the user might be at risk. Take the following example which is a snippet from the beginning and ending part of a longer post (Parts indicated with […] are omitted for brevity):
“Now, I think we all know what it’s like to be rejected by friends, dates, etc. While I have been stood up by a certain friend a few times, this really got to me. My dad said on tuesday […]
… I woke up today and I since morning just don’t know what to do anymore. I feel like I have nothing to live for and nothing makes me happy anymore.”In this example, most of the body of the post does not indicate any immediate risk to the user. However, this sudden change in the user’s mental state shows that this content is potentially a severe case. If we only rely on the features capturing the entire post, the mental state shift will not be apparent as most of the post do not show any signs of risk. Therefore, we also consider the last sentence as a separate feature; we utilize the liwc attributes for the last sentence to focus on the final mental state of the user and to eliminate some of the dilution that may occur in longer posts.
-
–
-
•
Topic modeling We use the abstract “topics” that occur in the collections of posts as another set of features for classification. Topic modeling Blei (2012) is a widely used approach for discovering the latent semantic structures (“topics”) in a text body. Latent Dirichlet Allocation (LDA) Blei et al. (2003) is a generative model that describes how the documents in a dataset are created. A brief description of the LDA generative process is as follows:
-
1.
For each document:
-
(a)
Draw a distribution over topics
-
(b)
Generate each word in the document by:
-
i.
Drawing a topic according to the distribution selected in step (a).
-
ii.
Drawing one word from the words in the topic
-
i.
-
(a)
Using this generative process, the LDA model tries to find a set of topics that are likely to have generated the collection. We trained the LDA topic model on the entire forum posts to obtain the latent topics associated with each post and we used these topics as additional features666We limited the number of topics to 100. We experimented with 20,50,100, and 200 topics and 100 topics was the optimal choice..
-
1.
-
•
Skip thought vectors Bag of words representation of the post is a sparse representation in which most of the entries are zero. More recently, approaches have been proposed for obtaining a dense representation of sentences that can encode syntactic and semantic properties of sentences in vectors. Skip thought vectors (Kiros et al., 2015) are one such model that use “sequence to sequence” models on pairs of consecutive sentences to learn the sentence encoding. Their model consist of a encoder-decoder framework in which the encoder maps words to a sentence vector and a decoder is used to generate the surrounding sentences. By analysis through several tasks, Kiros et al. (2015) showed that this approach results in good sentence encodings when trained on a sufficiently large corpus. We use this model to encode the forum posts in dense representations. We average the vector representation of all sentences in the post to encode the entire post.
-
•
Forum metadata Forum metadata such as number of post views, length of the thread, and number of post “kudos”, a ReachOut feature similar to “likes” on Facebook, are additional features that we considered. Motivated by previous research that identified the time of day of online activity as a useful mental health signal (Coppersmith et al., 2014; De Choudhury et al., 2013c), we also consider the broad temporal categories (day and night) as well as more fine-grained intervals (morning, afternoon, evening, and night). However, we did not observe an increase in the classifier’s performance with the addition of the temporal metadata attributes.
3.3 Learning algorithm
After extracting features, we use supervised multi-class classification for triaging the user posts into different severity categories. We use the XGBoost Tree Boosting (Chen and Guestrin, 2016) as the learning algorithm. We experimented with several other standard classifiers such as logistic regression, random forest, and SVM, but XGBoost showed the best results.
Let the dataset consist of different training instances in which the th instance is represented by a feature vector and label . In matrix notation, the entire feature vector and the labels are represented as . Given this dataset , the XGBoost tree ensemble model uses an ensemble of additive functions (regression trees) to predict the output :
| (1) |
where represents the model that predicts the output given the feature vector , is the space of all regression trees, and is the total number of regression trees used. The essential part of the model is regression trees . To learn , given the model output and the true class labels , the following regularized objective function is optimized over the training data:
| (2) |
where is a differentiable convex loss function (e.g. squared loss ), and is the regularizing function that penalizes the complexity of the functions to prevent overfitting. The model is trained additively by greedily adding that most improves the model based on equation 2. The additive function is also learned by a greedy tree growth algorithm. Several approximations are used that can quickly optimize the objective function. For more details on these steps, refer to the XGBoost reference Chen and Guestrin (2016).
In addition to the single classification model, we also utilize the ensemble of several XGBoost classifiers, each trained on a different subset of features from the entire feature space. We empirically determine the optimal subsets of features. By ensembling, we use multiple classifiers to obtain better performance than individual classifiers. Intuitively, we take advantage of several conceptually different models (each of which obtained by training on a different feature set), and we aggregate their predictions to obtain the final class label. We use the majority voting ensembling approach which has been shown to balance out the weaknesses of individual classifiers Lam and Suen (1997); Opitz and Maclin (1999).
| Train set | Test set | Total | ||||
|---|---|---|---|---|---|---|
| Severity Category | # posts | % posts | # posts | % posts | # posts | % posts |
| crisis | 39 | 4 | 1 | 0 | 40 | 3 |
| red | 110 | 12 | 27 | 11 | 137 | 12 |
| amber | 249 | 26 | 47 | 19 | 296 | 25 |
| green | 549 | 58 | 166 | 69 | 715 | 60 |
| Total | 947 | 100 | 241 | 100 | 1188 | 100 |
Formally, let {, …, } be models obtained by training the classifier on different feature sets {, … ,}. Similarly let , …, represent the output predicted by models {, …, }. For the th instance in the dataset, the majority voting ensembling approach predicts the class label according to the following:
| (3) |
where is the set of all possible class labels.
XGBoost has several hyperparameters including the learning rate (), the minimum sum of the weigths of all observations in a child (-), and the maximum depth of the tree (-). We used the default parameters which are , - and -. We did not observe any performance gain by modifying the default recommended hyperparameters.
4 Experimental setup
4.1 Data
The data that we use in this research are forum posts from ReachOut.com which is a very large and popular mental health forum in Australia and receives about 1.8 yearly visits (Millen, 2015). While this forum provides a discussion platform for ordinary topics such as life, family and friendship, its main purpose is to support discussions around more critical topics such as addiction, sexuality, identity and mental health problems. Most of the users and visitors are young people aging between 14 to 25 years old. ReachOut employs several senior moderators as well as younger people who volunteer for forum moderation. These moderators focus on cases that require attention and try to help these individuals by engaging in the discussion, showing compassion and support, and providing links and resources to the individuals.
We use a subset of the ReachOut forum containing 65,755 posts, 1,188 of which had been labeled by moderators based on 4 different categories of severity. The dataset contains separate training and testing sets; its characteristics are outlined in Table 2. The posts occurred between July 2012 and June 2015, with labeled posts being from May 2015 to June 2015. The posts were written by 1,647 unique authors. Each post contains several fields such as the post date and time, username of the author, number of kudos, subject of the thread, and the textual body of the post.
Data collection.
The full details of the data collection and the discussion on the ethical issues are discussed by Milne et al. (2016). While analysis of the mental health forum data provides many benefits, there are always trade-offs between the benefits and the risk to the privacy of the individuals. Milne et al. (2016) identified three groups of participants to whom the data collection and annotation process could cause harm: to the researchers who annotated the data, to the researchers who accessed the data, and to the people who authored the content. The data collection process ensured that the researchers were aware of the distressing nature of the content. To protect its users, forum members of the ReachOut are instructed to keep themselves safe and anonymous. Furthermore, the moderators in the forum actively redact any content that might reveal the identity of the users. The organizers further protected the forum member’s anonymity by restricting researchers in contacting the individuals in the forum, distributing the data, and cross-referencing individuals against other social media.
| Methods |
|
|
|
|||||||||
|---|---|---|---|---|---|---|---|---|---|---|---|---|
| F1 | Acc | F1 | Acc | F1 | Acc | |||||||
| Baseline | 31 | 78 | 75 | 86 | 38 | 89 | ||||||
| Cohan et al. (2016) | 41 | 80 | 81 | 87 | 67 | 92 | ||||||
| Brew (2016) | 42 | 79 | 78 | 85 | 69 | 93 | ||||||
| Malmasi et al. (2016) | 42 | 83 | 87 | 91 | 64 | 93 | ||||||
| Kim et al. (2016) | 42 | 85 | 85 | 91 | 62 | 91 | ||||||
| This work (Single model) | 47.2 | 93.9 | 90.0 | 91.7 | 73.1 | 92.9 | ||||||
| This work (Ensemble model) | 50.5 | 94.7 | 92.2 | 93.4 | 75.5 | 94.6 | ||||||
| Methods |
|
|
|
|||||||||
|---|---|---|---|---|---|---|---|---|---|---|---|---|
| F1 | Acc | F1 | Acc | F1 | Acc | |||||||
| Baseline | 29.0 | 87.4 | 78.2 | 80.6 | 64.2 | 86.7 | ||||||
| This work (single model) | 43.0 | 89.6 | 85.1 | 86.1 | 78.3 | 90.8 | ||||||
| This work (ensemble model) | 44.5 | 90.6 | 88.1 | 88.8 | 77.6 | 91.4 | ||||||
4.2 Evaluation
Following Milne et al. (2016), we use the accuracy and F-1 scores for evaluating the classification performance to be able to directly compare the performance of our approach with the state-of-the-art. To aggregate the scores for the individual categories, Milne et al. (2016) used the macro average of F-scores for the non-green (critical) categories as the official metric for the CLPsych 2016 shared task. This metric emphasizes the importance of triaging among the critical categories. They also consider the F-1 and accuracy scores for binary classification of flagged (i.e. crisis red amber) vs. green, and urgent (i.e. crisis red) vs. non-urgent categories to capture the performance of systems in identifying critical posts. We also use these additional metrics to further evaluate the performance of our approach. flagged classification shows that the post contains content indicating risk of self-harm to the user while urgent indicates that the user is at a more imminent risk and needs prompt attention (see the Method Section for complete definitions of severity categories).
| Model | Features | ||||||
|---|---|---|---|---|---|---|---|
| Single model |
|
||||||
| Ensemble model |
|
4.3 Baselines and comparison
We compare our methods with the top 4 performing systems among 16 total participating teams in the CLPsych 2016 shared task. To better evaluate our methods, we also consider a simple baseline which is SVM classifier with unigram and bigram bag-of-words features extracted from the body of the post (refer to bag-of-words features explained in Methods section for details).
5 Results and analysis
The results of our models for triaging the content severity compared with the baseline and state of the art systems is presented in Table 3; it includes results on the test set 3(a), as well as stratified cross-validation777The stratified cross validation in contrast to the regular cross validation preserves the distribution of the classes when splitting the data into train and test sets. results on the training set 3(b). For prior work, we report the official results that are percentages without any precision points. The single model indicates the performance of our proposed model using a single classifier while the ensemble model is a model based on 6 different classifiers. The features used in each of the models are presented in Table 4. In the Analysis Section, we will discuss the effect of different features on the performance. As illustrated in Table 3(a), our models outperform the baseline and all top performing state of the art systems by large margins. We observe that the non-green macro average F1 score for the individual and ensemble models improves over the best system (Kim et al., 2016) by +12% and +17%, respectively. Similarly, we observe that the F1 scores for the flagged category is 3% and 5% higher than the best system with the individual and ensemble models, respectively. Finally, in urgent category, the individual and ensemble models achieve 73.1% and 75.1% F1 scores respectively, which shows large improvement over the state of the art. We observe similar improvements in the cross-validation results on the training set (Table 3(b)). Since we have 10 different folds on the training set, we also perform a statistical significance test and we observe statistically significant improvement over the baseline for both the single and ensemble methods (Student’s t-test); the ensemble method also outperforms the single method statistically in virtually all metrics. In particular, the single and ensemble models achieve 48% and 53% improvements over the baseline based on non-green macro average F1 scores.
| Methods | crisis | red | amber | green |
|---|---|---|---|---|
| Baseline | 5.3 | 31.5 | 50.7 | 85.5 |
| This work (single model) | 17.0 | 53.0 | 63.2 | 89.0 |
| This work (ensemble model) | 21.3 | 55.3 | 69.1 | 91.1 |
Table 5 shows the breakdown of results by each category. We present results on the test set in Table 5(a) and cross validation results on training set in Table 5(b). It should be noted that there was only 1 crisis case in the test set and no team out of 16 teams were able to correctly identify this case. While our models were also unable to find the single crisis case, they show improvements over the state of the art in other categories. Specifically, we observe that the ensemble model achieves F1 score of 75.5% in red which improves over the best performance (65%) by 16%. Similarly, we observe large improvement of F1 for the amber category (10%). Finally, our model also slightly improves upon the state of the art on the green category. We also report results on the training set evaluated by 10 fold stratified cross validation (Table 5(b)). As illustrated, our methods achieve statistically significant improvement over the baseline in all severity categories. The overall lower performance on the crisis category is mainly due to the limited training data in this category. As shown in Table 2, there are only 40 crisis posts in the training set which is not enough for a supervised learning model to accurately estimate the optimal parameters.
Overall, the results show that both our single and ensemble models can effectively identify posts with critical content (flagged) with F1 and accuracy of 92% and 93%, respectively, on the test set, providing large improvements over the state of the art.
In the rest of this section, we first analyze the effect of different features that we proposed to use for triaging the content severity. Then we analyze the types of errors that our model makes to better understand the robustness of our proposed approach. Finally, using the proposed triaging model, we investigate the potential effect of the mental health forum on the individuals.
5.1 Feature Analysis
In the “Severity Triaging” Section, we presented our proposed features for the task of triaging the content severity. Table 6 shows the effect of each of the features when added to the classification model. We do not show the combinations of features that perform significantly worse than the body of the text. As illustrated, we observe that most of the proposed features have a positive effect on the performance of the system with the exception of skip thought vectors. The bag of words features of the body of the text achieve F1 score of 34.8% on the test set. Adding contextual features (prior posts by other users and user’s previous posts in the thread) improves the results to 38.5%. Similarly, we observe that addition of forum metadata features (length, kudos, and post views), subjectivity and emotion features, and features from the last sentence also improve the performance. Topic modeling yields further boost to the performance of the system which indicates the effectiveness of latent topics inferred from the forum posts using the LDA model. We observe that liwc features by themselves do not improve the results as much as topic modeling, however when combined with topic modeling features, greatest improvement is achieved (47.2% F1). This row (indicated by ) comprises all features in the single model reported in tables 3 and 5.
| Macro average over non-green categories | ||||
|---|---|---|---|---|
| Features | Acc | F1 | P | R |
| baseline (body) | 87.6 | 34.8 | 33.5 | 36.6 |
| skip thought | 87.5 | 33.5 | 33.4 | 34.1 |
| body+contextual | 90.3 | 38.5 | 36.5 | 40.8 |
| +meta+subj | 90.5 | 38.8 | 36.5 | 41.6 |
| +lexical clues | 90.9 | 40.2 | 38.3 | 41.3 |
| +last sentence | 92.3 | 42.8 | 43.0 | 42.8 |
| +emotion | 92.7 | 44.1 | 44.6 | 44.0 |
| +topic | 92.9 | 45.8 | 45.5 | 46.2 |
| topic+liwc | 91.8 | 41.9 | 41.7 | 42.6 |
| +topic () | 93.9 | 47.2 | 48.9 | 45.8 |
| Ensemble model | 94.7 | 50.5 | 51.6 | 49.5 |
We build an ensemble of distinct models each of which trained on a different feature set. We experimented with various ensembles of the features. Last row of Table 6 shows the performance of the best ensemble model. We do not report other ensembles that resulted in suboptimal performance. The ensemble model that obtains the best results is comprised of 6 different feature sets outlined in Table 4. As evidenced by Table 6, each of these sets are helpful features that can capture different characteristics of the associated forum post; therefore when combined by ensembling, the weaknesses of single set of features on some instances are compensated by the others. Therefore, as the results show, the ensemble model is more effective in comparison with the single models.
We note that skip thought vectors (second row in Table 6) did not improve the baseline. We also experimented with encoding the prior posts and authors posts with skip thought vectors but we did not observe any improvements. As shown by Kiros et al. (2015), when trained on a sufficiently large data, skip thought vectors encode text in dense vectors that can capture underlying semantic and syntactic properties of the text; and thus useful to be used as features for classification. However, in this task we observe that classification using skip thought vectors does not result in any improvements. The lack of improvement by these vectors indicates that the vectors are not able to capture any information beyond what is provided by other features. This could be due to averaging the sentence vectors. We represent the post which consists of several sentences by averaging the vectors corresponding to each sentence; some of the information of the individual sentences might be lost when averaged with other sentences. Therefore, a better approach for composing the post vectors of its constituent sentence vectors could lead to better results.
5.2 Error Analysis
Error analysis shows that misclassification of content severity is mainly due to the following reasons:
-
1.
Brevity of the posts and lack of sufficient background context.
Some urgent categories that were misclassified are associated with a rather short post from which limited information can be obtained. For example, the following post is taken from a long discussion thread and is labeled as green by the classifier while the actual label is red.
“I got the reply from x about my complaint. All they did was make excuses for themselves. no help at all.”
This post on its own does not show any risk to the user. However, reading the entire associated thread in the forum reveals that the author of the post had experienced a problem with their counseling service for their mental distress, and they were in need for mental help and support. To infer this context about this specific post, the immediate surrounding posts are not sufficient and one needs to read the entire conversation.
In the model, we already consider the immediate surrounding posts as the context for the post. However, this may not capture the context in very long discussion threads (such as the above example). When we increased the number of previous posts to be considered as the context, we observed an overall suboptimal performance. This is because, generally, in long threads the discussion tends to change after a few posts. Thus, considering longer window of posts in a thread as context for a target post might result in adding posts that are not necessarily relevant to the target post and consequently introduce noise to the model.
-
2.
Variations in tone.
In some misclassification cases, we observe sudden changes and variations in the tone of the post expressed by the user and that makes it difficult for the learning algorithm to correctly classify the associated severity. For instance consider the following post:
“ I went to my favorite show last week and it was amazing. I usually feel very low, specially at nights. This was one of the rare times that I was actually happy for some time… Five days ago at school one classmate of mine bullies me and he shouts that he wishes me dead. I ignored him completely at the moment and I was totally fine. But when I got back home I felt like a total loser and the bad thoughts about myself started coming back.”
In this post we observe that the user starts with a positive tone and then it changes to negative. Then the tone switches between positive and negative multiple times. This specific example is an amber case and the classifier mislabeled it as red.
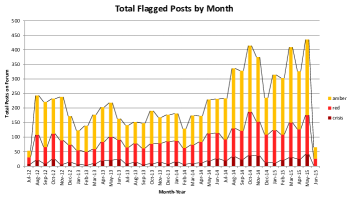
Figure 1: Volume of flagged posts on the forum from the time period contained in the dataset First post Last post flagged green Total flagged 93 37 127 green 105 220 325 Total 198 254 (a) flagged First Post Last Post urgent non-urgent Total urgent 30 16 46 non-urgent 126 280 406 Total 156 296 (b) urgent Table 7: The number of users by the flagged 7(a) or urgent 7(b) post severity of their first post and their last post. Numbers in cells show the number of users whose first and last post severity corresponds to the associated column and row, respectively. For example 105 in table flagged 7(a) corresponds to the number of users whose first post was flagged and last post was green. First month Last month flagged green Total flagged 120 46 166 green 78 208 286 Total 198 254 (a) flagged First month Last month urgent non-urgent Total urgent 40 31 71 non-urgent 64 317 381 Total 104 348 (b) urgent Table 8: The number of users by average severity of posts in their first and last month of activity in the forum. Numbers in cells show the number of users with average post severity in the first and last month corresponding to the associated column and row. For example 46 in Table (a) corresponds to the number of users whose average post severity in first month was green and last month was flagged. In the proposed triaging model, we capture the user’s final state of the mind by considering features from the last sentence. However, when there are too many tone variations in the post, the exact severity of the post might be misclassified. We note that the size of the training dataset was limited and therefore capturing these subtle cases requires more of similar training instances. Future work could investigate whether these variability of various psychological variables (e.g. tone) can be considered as a risk factor for individuals.
-
3.
Long posts with only a small part containing concerning content.
In a few long posts, we observe only a small part showing signs of distress to the user, while the rest of the post has a neutral to positive tone. A misclassified example with actual label of red is shown below (Parts indicated with […] are omitted for brevity):
“This book series is a roller coaster. Maze runner series, I’m onto the prequel book now. They are amazing […] I’ve always been too resilient. I just hate everything and it confuses me. Maybe I’m tired of all this and want to do something.. I just… nothing is set. Yesterday Lora called and we talked like a lot about school, friends […] It feels good to say, or type, all this.”
This snippet is from a much longer post and as it can be observed, only the underlined part contains content that indicate mental distress to the user.
In such posts, the effect of the small negative part of the post is played down by the larger dominant neutral tone and therefore the model could mispredict this. In this case although still correctly identified as critical, the classifier misclassifies the severity level as amber instead of red.
Overall, most of classification errors occur within the flagged category; there are very few cases in the flagged posts that are missed by the classifier and labeled as green. This can also be observed in Table 3 in flagged category performance which obtains F1 and accuracy scores of 92.2% and 93.4%, respectively. Our results are encouraging since they show that the model can effectively capture flagged posts, i.e. all posts that indicate some signs of harm to the user.
5.3 User Analysis
We study the user content severity in the forum over time to analyze if it is helpful to the individuals. For the purposes of user analysis, we mostly rely on the binary classification of urgent (crisis and red) vs. non-urgent, and flagged (crisis red amber) vs. green categories. In these categories, as shown in Tables 3 (a and b), the ensemble classification model obtains F-1 scores of 90% and 75% respectively (accuracy of 91% and 93%) and thus it is relatively reliable for studying larger scale trends of content severity in the entire forum. Figure 1 shows the results of severity triaging throughout all the posts in the dataset. As illustrated, there is a steady increase in the amount of flagged posts. Given this trend, we examine patterns of post severity to understand the effects that the forum might have on the individuals. Specifically, we investigate the following research questions:
-
Q-1.
Does engaging with the forum have a positive effect on the users?
Our analysis indicated a decline in the average content severity over time, which may indicate a positive effect of the forum on its users. This correlative effect suggests that further controlled trials should be conducted to carefully ascertain the causal nature of this relationship.
The dataset includes posts from the forum in a time window of 36 months during which we quantify the behavior of users. To measure the relation of user interaction with the forum, we split the users into two groups. Users are considered active if they have posted for two or more months on the forum, and inactive if they had only posted during a single month. We only consider active users for the analysis because for inactive users, the activity period of one month is too short to present a significant relation. In these 36 months, there are a total of 452 active users and 1,195 inactive users. We analyze the severity of the first post and last posts of users, average post severity during their first and last months of activity and finally, the trend lines of severity during entire time of interaction with the forum.
Tables 7(a) and 7(b) show the number by the severity of their first and last posts on the forum. A Chi-square test on the contingency tables was performed to ensure that the difference between the cells are interpretable. For both table 7(a) and 7(b) we found significant interaction, , and , , respectively. In general, we observe that the users’ last posts tend to be of lower severity than their first post. 81% of users whose first post received an urgent label had a final post with a non-urgent label. Only 10% of users whose first post was non-urgent had a final post of urgent. In both the flagged and urgent matrices, there were more users whose final posts was green or non-urgent than users who had flagged or urgent first posts.
Tables 8(a) and 8(b) show the comparison of the average user content severity in the first and last month of users’ activity in the forum (Chi-square test showed that the results are interpretable with a significant difference of =86.47 () and =52.82 () for Tables 8(a) and 8(b), respectively.). We observe a similar positive trend in the urgent category; in the flagged category, the number of users whose average initial content and last content is flagged (120 users) is more than those whose content is shifted from flagged to green (78 users). However, there are very few green users whose content eventually turned flagged (46 users). Furthermore, the total number of users with first month flagged posts (198) is higher than number of users with last month flagged posts (166). These results also indicate that users’ last posts tend less severe than their first posts.
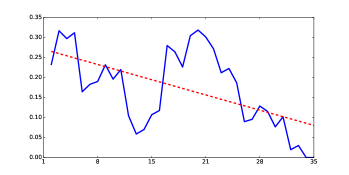
Figure 2: Example trend line of user post severity over time. axis shows the month of activity. is the average content severity in the month. Avg. Std dev. Positive trend 0.68 0.34 Negative trend -0.72 0.32 Table 9: The average (Avg.) and standard deviation (Std dev.) of the r values of the trend lines for the positive and negative trends. flagged vs green Fine-grained severity Threshold Avg. Stdev. # positive # negative Avg. Stdev. # positive # negative 0.02 -0.096 0.370 90 113 -0.068 0.236 76 120 0.05 -0.134 0.430 60 86 -0.104 0.285 43 84 0.10 -0.177 0.458 41 72 -0.129 0.320 32 65 0.15 -0.224 0.510 30 57 -0.159 0.350 23 53 None -0.044 0.221 167 272 -0.032 0.151 153 298 Table 10: Analysis of trend lines of severity over time for active users. flagged vs green indicates the trend change between flagged and green categories while fine-grained severity is for all 4 severity categories. Avg. shows the average of the slope of the trendlines. Stdev. is the standard deviation of the slope of the trendlines. #positive shows the number of users with positive slope of trendline. #negative shows the number of users with negative slope of trendline. Negative (positive) slope of trend line shows decreased (increased) content severity of the user over time. Threshold is used to filter out the effect of the flat trendlines; the considered trend lines in each row have an absolute value of slope greater than the value of the threshold in that row. Overall, the Table indicates that the content severity for majority of the users with non-flat trend line has decreased over time. We believe this is because many users join this type of forums to get immediate support for a moment of crisis or acute mental distress. After some time, this initial distress is decreased, as reflected in the patterns of post severity. That is why the initial activity of users in general tend to be more severe than their final posts. We believe this could be for the following reasons: (i) Pattern of post severity drops off once the user is in a more stable mental state compared with their initial state of crisis. (ii) Interaction with the forum and engaging in discussion with other forum users might have resulted in reducing the acute distress in users (verifying the exact causal relation requires further user level controlled trials).
In addition to first and last months of activity, we also analyze the trends throughout the entire time of user activity. To do so, we consider the average severity of the posts in each month as a data point for that month, and we then fit a trend line to the data points. We consider the following numeric values for each category to be able to quantify the average severity in each month: crisis = 1.0, red = 0.66, amber = 0.33, green = 0.0. Using these numeric equivalent of severity classes, for each user, we associate an average severity for all their posts in each month. Then, we fit a linear model on this data to show the trend line of the content severity over time. Figure 2 shows a sample plot of the post severity for a user over time and its associated trend line.
To fit an appropriate trend line to the data, we minimize the squared error between the target trend line and the actual severity data points. Specifically, the equation of a trend line for variable is given by where and are the slope and intercept of the line, respectively. A negative (positive) trend line slope indicates that overall, the severity of user content has declined (increased). Given severity data points , the values of and are found by minimizing the squared error over the data:
(4) First Month Last Month flagged green flagged 3.47 5.15 green 3.62 7.02 (a) flagged First Month Last Month urgent Non-urgent urgent 3.14 5.11 Non-urgent 3.28 6.48 (b) urgent Table 11: The average number of months the users stayed active in the forum based on the average severity of their content in the first and last months of activity. Moderator Response Time Total Number Percentage Average Time Stdev Time crisis 608 147 24.18% 4.21 5.71 red 2798 931 33.27% 4.53 6.17 amber 4642 1435 28.05% 4.46 6.60 green 57707 892 1.55% 3.76 6.07 urgent 3406 1078 37.96% 4.37 5.94 flagged 8048 2513 37.88% 4.40 6.16 Table 12: Time in hours. Average response time when a moderator was the first to respond. To check if a linear model is a applicable for our case, we calculated the r values associated with the trendlines. In particular, for each user we calculated the r value of their content severity trend lines and we calculated the average and the standard deviation of these values (Table 9). As illustrated, the average of r values are 0.68 (-0.72) for the positive (negative) trends which is around 0.7 (-0.7). Absolute r values greater than 0.5 indicate high to strong linear relationship in the data Tabachnick et al. (2001). Thus, linear trend analysis is a reasonable fit to this data.
To analyze overall trends in the content severity, we calculate the content severity trend line for each user and then analyze the overall trend line statistics for the users. We observed that many users have steady trend lines with a slope of near zero. To eliminate the noise caused by these neutral trends from our analysis, we filter out the users whose content severity trend lines are essentially flat. These users are either the moderators of the forum or are users that show consistent behavior over time. We then analyze how the content severity of the other users with varying content severity changes over time. Table 10 shows the statistics for all the trends lines among all the active users. To eliminate trend lines having a slope near zero, we consider a threshold. We analyze results based on different values of this threshold. For example, for the threshold , the corresponding row on the Table only considers trend lines with slope such that or and filters out all other lines having . We also show the results in the case that there is no threshold (last row of the Table). flagged vs green corresponds to plots with numeric severity value of 1.0 for a flagged post and 0.0 for a green post; Fine-grained severity categories corresponds to plots with following numerics severity values: crisis = 1.0, red = 0.66, amber = 0.33, green = 0.0. As illustrated in Table 10, we observe an average negative trend line slope for all the values of the threshold. This indicates a decline of average content severity among all the users. Furthermore, we observe that majority of users have a trend line with a negative slope and thus, decreasing severity of content.
These results indicate that overall there is a decline in the content severity of the users as they interact with the forum, which could be due to the potential positive effect of the forum on its users. This effect could be attributed to the users expressing their feelings and emotions, receiving support and feedback from the moderators, and discussing issues with users experiencing similar problems. However, we note that here we only observe the negative trend of content severity; to study the exact causal relationship between interaction with the forum and content severity, further controlled trials on the forum users should be conducted.
-
Q-2.
What effect does the duration of engagement with the forum have on the users?
We analyze how the duration of a user’s engagement with the forum impacts the severity of their posts over time. Tables 11(a) and 11(b) show that users with a first month severity of flagged or urgent posts interacted with the forum for 3-4 months, while other users interacted with the forum for 5-7 months. These tables are essentially showing that users with less critical posts in the first month tend to interact with the forum in a more long-term basis in comparison with users whose initial posts are critical. The difference in the duration of user interaction by their initial content severity indicates that there are users who visit the forum for immediate assistance in a critical moment and those who use the forum as a longer-term support resource. This result suggests that users whose first posts are more severe could be on the forum for immediate support and will only stay active until their critical mental state reaches a safe equilibrium again. In contrast, the users whose first month is green or non-urgent may be seeking a long-term resource and a community of users with shared experiences.
This difference between the activity period of users by their initial content reveals an opportunity for moderators to improve their response time to flagged and urgent posts. Faster moderator attention to flagged and urgent posts would provide better quality of help to these short-term users and encourage them to further interact with the forum for receiving support. Triaging the forum posts to allow moderators improve their response time would benefit all user groups, and particularly users who currently visit the forum for an immediate support.
-
Q-3.
What is the effect of moderator response time on the user’s forum behavior?
Since the focus of this research is on triaging the severity of mental health forum posts, we seek to understand how quickly moderators are currently responding to posts by their severity. Table 12 shows the average time for a moderator to respond, as well as the percentage of cases in which the moderators were the first to respond to a user. It shows that in cases where a moderator was the first to respond to a flagged or urgent post, they took on average more than four hours to respond. Unfortunately, four hours might be too long for users with imminent risks and it is very important to reduce this response time to prevent a potential self harm. Additionally, we observe that moderators are the first responders on less than 33% of non-green posts, meaning the other forum users responded to majority of posts earlier than moderators. This further stresses the value of triaging content severity, so that moderators can quickly respond to critical posts rather than having to identify such posts on the forum manually.
6 Conclusions
We presented an approach for triaging the content severity in mental peer support forums with a specific goal of identifying cases with potential risk of self-harm. Triaging the content severity helps the forum moderators to locate the critical cases and attend to them as soon as possible. We used a feature-rich classifier with various sets of features including psycholinguistic, contextual, topic modeling and forum metadata features for triaging the content into different severity categories. In addition to a single classifier, we also built an ensemble classifier by using different sets of features. We evaluated our approach on the data from ReachOut.com, a large mental health forum. We showed that our approaches can effectively improve over the state-of-the-art by large margins (up to 17% macro-average F1 scores of critical categories). We showed that the content severity of the users tend to decrease as they interact with the forum. Results further indicated that there is a need for effective and efficient triaging of forum post data to assist the moderators in attending the users with potential risk of self-harm.
The impact of this research is important from two perspectives. It stresses the importance of mental health forums as a support platform for users with mental health problems. It furthermore provides an efficient and effective way for moderators to asses the content severity of the forum, and consequently help individuals in need and prevent self harm incidents.
7 Acknowledgments
This work was partially supported by National Science Foundation (NSF) through grant CNS-1204347.
References
- American Foundation for Suicide Prevention (2016) American Foundation for Suicide Prevention. 2016. Suicide statistics 2016. AFSP; New York, NY .
- Blei (2012) David M Blei. 2012. Probabilistic topic models. Communications of the ACM 55(4):77–84.
- Blei et al. (2003) David M Blei, Andrew Y Ng, and Michael I Jordan. 2003. Latent dirichlet allocation. Journal of machine Learning research 3(Jan):993–1022.
- Braithwaite et al. (2016) Scott R Braithwaite, Christophe Giraud-Carrier, Josh West, Michael D Barnes, and Carl Lee Hanson. 2016. Validating machine learning algorithms for twitter data against established measures of suicidality. JMIR mental health 3(2):e21.
- Breiman (2001) Leo Breiman. 2001. Random forests. Machine learning 45(1):5–32.
- Brew (2016) Chris Brew. 2016. Classifying reachout posts with a radial basis function svm. In Proceedings of the Third Workshop on Computational Lingusitics and Clinical Psychology. Association for Computational Linguistics, San Diego, CA, USA, pages 138–142.
- Burnap et al. (2015) Pete Burnap, Walter Colombo, and Jonathan Scourfield. 2015. Machine classification and analysis of suicide-related communication on twitter. In Proceedings of the 26th ACM Conference on Hypertext & Social Media. ACM, pages 75–84.
- Centers for Disease Control and Prevention (2015) Centers for Disease Control and Prevention. 2015. Suicide facts at a glance 2015. CDC; Atlanta, GA: Department of Health and Human Services http://www.cdc.gov/violenceprevention/suicide/statistics/.
- Chen et al. (2016) Liangzhe Chen, K. S. M. Tozammel Hossain, Patrick Butler, Naren Ramakrishnan, and B. Aditya Prakash. 2016. Syndromic surveillance of flu on twitter using weakly supervised temporal topic models. Data Mining and Knowledge Discovery 30(3):681–710. https://doi.org/10.1007/s10618-015-0434-x.
- Chen and Guestrin (2016) Tianqui Chen and Carlos Guestrin. 2016. Xgboost: A scalable tree boosting system. In Proceedings of the 22th ACM SIGKDD International Conference on Knowledge Discovery and Data Mining. ACM, New York, NY, USA, KDD ’16.
- Cherry et al. (2012) Colin Cherry, Saif M Mohammad, and Berry De Bruijn. 2012. Binary classifiers and latent sequence models for emotion detection in suicide notes. Biomedical Informatics Insights 5(Suppl 1):147.
- Cohan et al. (2016) Arman Cohan, Sydney Young, and Nazli Goharian. 2016. Triaging mental health forum posts. In Proceedings of the Third Workshop on Computational Lingusitics and Clinical Psychology. Association for Computational Linguistics, San Diego, CA, USA, pages 143–147.
- Coppersmith et al. (2014) Glen Coppersmith, Mark Dredze, and Craig Harman. 2014. Quantifying mental health signals in twitter. In Proceedings of the Workshop on Computational Linguistics and Clinical Psychology: From Linguistic Signal to Clinical Reality. pages 51–60.
- Coppersmith et al. (2015) Glen Coppersmith, Mark Dredze, Craig Harman, and Kristy Hollingshead. 2015. From adhd to sad: Analyzing the language of mental health on twitter through self-reported diagnoses. In Proceedings of the 2nd Workshop on Computational Linguistics and Clinical Psychology: From Linguistic Signal to Clinical Reality. Association for Computational Linguistics, Denver, Colorado, pages 1–10.
- Coppersmith et al. (2016a) Glen Coppersmith, Kim Ngo, Ryan Leary, and Anthony Wood. 2016a. Exploratory analysis of social media prior to a suicide attempt. In Proceedings of the Third Workshop on Computational Lingusitics and Clinical Psychology. Association for Computational Linguistics, San Diego, CA, USA, pages 106–117.
- Coppersmith et al. (2016b) Glen Coppersmith, Kim Ngo, Ryan Leary, and Anthony Wood. 2016b. Exploratory analysis of social media prior to a suicide attempt. In Proceedings of the Third Workshop on Computational Linguistics and Clinical Psychology. Association for Computational Linguistics, San Diego, CA, USA, pages 106–117.
- Cortes and Vapnik (1995) Corinna Cortes and Vladimir Vapnik. 1995. Support-vector networks. Machine Learning 20(3):273–297. https://doi.org/10.1007/BF00994018.
- Dao et al. (2015) Bo Dao, Thin Nguyen, Svetha Venkatesh, and Dinh Phung. 2015. Nonparametric discovery of online mental health-related communities. In International Conference on Data Science and Advanced Analytics. IEEE, DSAA ’15, pages 1–10.
- De Choudhury et al. (2013a) Munmun De Choudhury, Scott Counts, and Eric Horvitz. 2013a. Social media as a measurement tool of depression in populations. In Proceedings of the 5th Annual ACM Web Science Conference. ACM, New York, NY, USA, WebSci ’13, pages 47–56. https://doi.org/10.1145/2464464.2464480.
- De Choudhury and De (2014) Munmun De Choudhury and Sushovan De. 2014. Mental health discourse on reddit: Self-disclosure, social support, and anonymity. In ICWSM.
- De Choudhury et al. (2013b) Munmun De Choudhury, Michael Gamon, Scott Counts, and Eric Horvitz. 2013b. Predicting depression via social media. In Proceedings of the Seventh International AAAI Conference on Weblogs and Social Media (ICWSM). AAAI.
- De Choudhury et al. (2013c) Munmun De Choudhury, Michael Gamon, Scott Counts, and Eric Horvitz. 2013c. Predicting depression via social media. In ICWSM. page 2.
- De Choudhury et al. (2016) Munmun De Choudhury, Emre Kiciman, Mark Dredze, Glen Coppersmith, and Mrinal Kumar. 2016. Discovering shifts to suicidal ideation from mental health content in social media. In Proceedings of the 2016 CHI Conference on Human Factors in Computing Systems. ACM, New York, NY, USA, CHI ’16, pages 2098–2110. https://doi.org/10.1145/2858036.2858207.
- Desmet and Hoste (2013) Bart Desmet and Véronique Hoste. 2013. Emotion detection in suicide notes. Expert Systems with Applications 40(16):6351–6358.
- Dredze (2012) Mark Dredze. 2012. How social media will change public health. IEEE Intelligent Systems 27(4):81–84.
- Eichstaedt et al. (2015) Johannes C Eichstaedt, Hansen Andrew Schwartz, Margaret L Kern, Gregory Park, Darwin R Labarthe, Raina M Merchant, Sneha Jha, Megha Agrawal, Lukasz A Dziurzynski, Maarten Sap, et al. 2015. Psychological language on twitter predicts county-level heart disease mortality. Psychological science 26(2):159–169.
- Hollingshead and Ungar (2016) Kristy Hollingshead and Lyle Ungar, editors. 2016. Proceedings of the Workshop on Computational Linguistics and Clinical Psychology: From Linguistic Signal to Clinical Reality. North American Association for Computational Linguistics, San Diego, California, USA.
- Jamison-Powell et al. (2012) Sue Jamison-Powell, Conor Linehan, Laura Daley, Andrew Garbett, and Shaun Lawson. 2012. I can’t get no sleep: discussing# insomnia on twitter. In Proceedings of the SIGCHI Conference on Human Factors in Computing Systems. ACM, pages 1501–1510.
- Jones and Bennell (2007) Natalie J Jones and Craig Bennell. 2007. The development and validation of statistical prediction rules for discriminating between genuine and simulated suicide notes. Archives of Suicide Research 11(2):219–233.
- Karch et al. (2009) Debra L Karch, Linda L Dahlberg, Nimesh Patel, Terry W Davis, Joseph E Logan, Holly A Hill, L Ortega, et al. 2009. Surveillance for violent deaths—national violent death reporting system, 16 states, 2006. MMWR Surveill Summ 58(1):1–44.
- Kim et al. (2016) Sunghwan Mac Kim, Yufei Wang, Stephen Wan, and Cecile Paris. 2016. Data61-csiro systems at the clpsych 2016 shared task. In Proceedings of the Third Workshop on Computational Lingusitics and Clinical Psychology. Association for Computational Linguistics, San Diego, CA, USA, pages 128–132.
- Kiros et al. (2015) Ryan Kiros, Yukun Zhu, Ruslan Salakhutdinov, Richard S Zemel, Antonio Torralba, Raquel Urtasun, and Sanja Fidler. 2015. Skip-thought vectors. arXiv preprint arXiv:1506.06726 .
- Lam and Suen (1997) Louisa Lam and SY Suen. 1997. Application of majority voting to pattern recognition: an analysis of its behavior and performance. IEEE Transactions on Systems, Man, and Cybernetics-Part A: Systems and Humans 27(5):553–568.
- Lamb et al. (2013) Alex Lamb, Michael J. Paul, and Mark Dredze. 2013. Separating fact from fear: Tracking flu infections on twitter. In Proceedings of the 2013 Conference of the North American Chapter of the Association for Computational Linguistics: Human Language Technologies. Association for Computational Linguistics, Atlanta, Georgia, pages 789–795.
- Le and Mikolov (2014) Quoc V Le and Tomas Mikolov. 2014. Distributed representations of sentences and documents. In ICML. volume 14, pages 1188–1196.
- Lester (2010) David Lester. 2010. The final hours: A linguistic analysis of the final words of a suicide. Psychological reports 106(3):791–797.
- Malmasi et al. (2016) Shervin Malmasi, Marcos Zampieri, and Mark Dras. 2016. Predicting post severity in mental health forums. In Proceedings of the Third Workshop on Computational Lingusitics and Clinical Psychology. Association for Computational Linguistics, San Diego, CA, USA, pages 133–137.
- Millen (2015) Doug Millen. 2015. Reachout annual report 2013/2014. http://about.au.reachout.com/us/annual-reports-financials.
- Milne et al. (2016) David N. Milne, Glen Pink, Ben Hachey, and Rafael A. Calvo. 2016. Clpsych 2016 shared task: Triaging content in online peer-support forums. In Proceedings of the Third Workshop on Computational Lingusitics and Clinical Psychology. Association for Computational Linguistics, San Diego, CA, USA, pages 106–117.
- Mitchell et al. (2015) Margaret Mitchell, Kristy Hollingshead, and Glen Coppersmith. 2015. Quantifying the language of schizophrenia in social media. Proceedings of the 2nd Workshop on Computational Linguistics and Clinical Psychology: From Linguistic Signal to Clinical Reality pages 11–20.
- Murnane and Counts (2014) Elizabeth L Murnane and Scott Counts. 2014. Unraveling abstinence and relapse: smoking cessation reflected in social media. In Proceedings of the 32nd annual ACM conference on Human factors in computing systems. ACM, pages 1345–1354.
- Nock et al. (2008) Matthew K Nock, Guilherme Borges, Evelyn J Bromet, Jordi Alonso, Matthias Angermeyer, Annette Beautrais, Ronny Bruffaerts, Wai Tat Chiu, Giovanni De Girolamo, Semyon Gluzman, et al. 2008. Cross-national prevalence and risk factors for suicidal ideation, plans and attempts. The British Journal of Psychiatry 192(2):98–105.
- Olteanu et al. (2016) Alexandra Olteanu, Onur Varol, and Emre Kıcıman. 2016. Towards an open-domain framework for distilling the outcomes of personal experiences from social media timelines. In Proceedings of International AAAI Conference on Web and Social Media. AAAI, ICWSM ’16’.
- Opitz and Maclin (1999) David Opitz and Richard Maclin. 1999. Popular ensemble methods: An empirical study. Journal of Artificial Intelligence Research 11:169–198.
- Park et al. (2013) Minsu Park, David W McDonald, and Meeyoung Cha. 2013. Perception differences between the depressed and non-depressed users in twitter. In Proceedings of International AAAI Conference on Web and Social Media (ICWSM).
- Parker et al. (2015) Jon Parker, Andrew Yates, Nazli Goharian, and Ophir Frieder. 2015. Health-related hypothesis generation using social media data. Social Network Analysis and Mining 5(1):1–15. https://doi.org/10.1007/s13278-014-0239-8.
- Paul and Dredze (2011) Michael J Paul and Mark Dredze. 2011. You are what you tweet: Analyzing twitter for public health. International Conference On Web And Social Media (ICWSM) 20:265–272.
- Paul et al. (2016) Michael J Paul, Abeed Sarker, John S Brownstein, Azadeh Nikfarjam, Matthew Scotch, Karen L Smith, and Graciela Gonzalez. 2016. Social media mining for public health monitoring and surveillance. In Pacific Symposium on Biocomputing. Pacific Symposium on Biocomputing. volume 21, page 468.
- Pennebaker et al. (2015) James W Pennebaker, Ryan L Boyd, Kayla Jordan, and Kate Blackburn. 2015. The development and psychometric properties of liwc2015. UT Faculty/Researcher Works .
- Pestian et al. (2012) John P Pestian, Pawel Matykiewicz, Michelle Linn-Gust, Brett South, Ozlem Uzuner, Jan Wiebe, Kevin B Cohen, John Hurdle, and Christopher Brew. 2012. Sentiment analysis of suicide notes: A shared task. Biomedical Informatics Insights 5(Suppl. 1):3.
- Portier et al. (2013) Kenneth Portier, Greta E Greer, Lior Rokach, Nir Ofek, Yafei Wang, Prakhar Biyani, Mo Yu, Siddhartha Banerjee, Kang Zhao, Prasenjit Mitra, et al. 2013. Understanding topics and sentiment in an online cancer survivor community. JNCI Monographs 47:195–198.
- Rosenbaum and Rubin (1984) Paul R Rosenbaum and Donald B Rubin. 1984. Reducing bias in observational studies using subclassification on the propensity score. Journal of the American statistical Association 79(387):516–524.
- Saarni et al. (2007) Samuli I Saarni, Jaana Suvisaari, Harri Sintonen, Sami Pirkola, Seppo Koskinen, Arpo Aromaa, and JOUKO LÖNNQVIST. 2007. Impact of psychiatric disorders on health-related quality of life: general population survey. The British journal of psychiatry 190(4):326–332.
- Schwartz et al. (2014) H Andrew Schwartz, Johannes Eichstaedt, Margaret L Kern, Gregory Park, Maarten Sap, David Stillwell, Michal Kosinski, and Lyle Ungar. 2014. Towards assessing changes in degree of depression through facebook. In Proceedings of the Workshop on Computational Linguistics and Clinical Psychology: From Linguistic Signal to Clinical Reality. Citeseer, pages 118–125.
- Silverman and Maris (1995) Morton M Silverman and Ronald W Maris. 1995. The prevention of suicidal behaviors: An overview. Suicide and Life-Threatening Behavior 25(1):10–21.
- Staiano and Guerini (2014) Jacopo Staiano and Marco Guerini. 2014. Depeche mood: a lexicon for emotion analysis from crowd annotated news. In Proceedings of the 52nd Annual Meeting of the Association for Computational Linguistics. Association for Computational Linguistics, Baltimore, Maryland, pages 427–433.
- Strine et al. (2015) Tara W Strine, Ali H Mokdad, Lina S Balluz, Olinda Gonzalez, Raquel Crider, Joyce T Berry, and Kurt Kroenke. 2015. Depression and anxiety in the united states: findings from the 2006 behavioral risk factor surveillance system. Psychiatric Services .
- Tabachnick et al. (2001) Barbara G Tabachnick, Linda S Fidell, and Steven J Osterlind. 2001. Using multivariate statistics .
- Thompson et al. (2014) Paul Thompson, Craig Bryan, and Chris Poulin. 2014. Predicting military and veteran suicide risk: Cultural aspects. In Proceedings of the Workshop on Computational Linguistics and Clinical Psychology: From Linguistic Signal to Clinical Reality. Association for Computational Linguistics, Baltimore, Maryland, USA, pages 1–6.
- Tsugawa et al. (2015) Sho Tsugawa, Yusuke Kikuchi, Fumio Kishino, Kosuke Nakajima, Yuichi Itoh, and Hiroyuki Ohsaki. 2015. Recognizing depression from twitter activity. In Proceedings of the 33rd Annual ACM Conference on Human Factors in Computing Systems. ACM, pages 3187–3196.
- Wilson et al. (2005) Theresa Wilson, Janyce Wiebe, and Paul Hoffmann. 2005. Recognizing contextual polarity in phrase-level sentiment analysis. In Proceedings of the conference on human language technology and empirical methods in natural language processing. Association for Computational Linguistics, pages 347–354.