Phoretic Interactions Between Active Droplets
Abstract
Concentration gradients play a critical role in embryogenesis, bacterial locomotion, as well as the motility of active particles. Particles develop concentration profiles around them by dissolution, adsorption, or the reactivity of surface species. These gradients change the surface energy of the particles, driving both their self-propulsion and governing their interactions. Here we uncover a regime in which solute-gradients mediate interactions between slowly dissolving droplets without causing autophoresis. This decoupling allows us to directly measure the steady-state, repulsive force, which scales with interparticle distance as . Our results show that the process is diffusion rather than reaction rate limited, and the theoretical model captures the dependence of the interactions on droplet size and solute concentration, using a single fit parameter, nm, which corresponds to the lengthscale of a swollen micelle. Our results shed light on the out-of-equilibrium behavior of particles with surface reactivity.
pacs:
Concentration gradients develop around particles that locally alter the composition of their solvent. This can occur if the particles dissolve in the solvent, if they adsorb other species in solution, or if their surfaces catalyze chemical reactions. Examples include heterogeneous catalysts Wang2013 ; Soto2014 , droplets undergoing Ostwald ripening, silica particles dissolving in a strong base, ion-exchange resin particles Reinmüller2013 and microbes that are consuming nutrients or excreting signaling proteins Kravchenko-Balasha2016 ; Kravchenko-Balasha2014 . These concentration profiles can affect the behavior of the dispersed particles if their surface tension couples to the solute concentration Soto2014 ; Abécassis2008 ; Cira2015 ; Toyota2009 . The most studied example is given by autophoretic swimmers, which form asymmetric concentration profiles and subsequently swim in response to the gradients Elgeti2015 ; Abbott2016 ; Paxton2006 ; Sengupta2012 . As a result they move in a directional manner which has been shown to cause the formation of dynamic patterns Wang2013 ; Palacci2012 ; Thutupalli2011 ; Buttinoni2013 . Currently there is considerable interest in self-propelled particles because they constitute model systems for studying collective behavior from a range of fields and disciplines. Examples include pattern formation Sanchez2012 , dynamic clustering Palacci2012 ; Buttinoni2013 ; Theurkauff2012 and anomalous density fluctuations Schaller2013 with connections to glassy behavior and jamming Ni2013 . Despite this interest, the propulsion mechanism of many important model systems is not well understood Brown2014 , and their mutual interactions even less so.
In the case of particles that are self-propelled by chemical gradients, it is clear that overlap of concentration profiles around two or more particles results in mutual interactions Soto2014 ; Cira2015 . These concentration gradients evolve as the particles swim, which precludes a precise definition of the interparticle potential (and in particular, the motion of the particle is non-Markovian). To this end, we uncover the regime in which active droplets do not swim, but do exude concentration profiles. This system allows us to measure these gradient-mediated interactions between pairs of droplets in the absence of autophoresis. We then develop a theoretical model based on steady-state diffusion profiles to the functional form for the interaction and thus fit the data as a function of droplet size and solute concentration. This ‘static’ case improves our understanding of the mechanism that leads to a threshold concentration above which droplets begin to swim.
We employ a simple model system of droplets of di-ethyl phthalate (DEP) oil dispersed in an aqueous solution of the surfactant sodium dodecyl sulphate (SDS). The DEP droplets slowly dissolve in the medium, giving rise to local concentration gradients. DEP is only marginally soluble in water (0.2 mg/mL SM ). Above a threshold SDS concentration of mM, surfactant molecules and DEP molecules from the droplet coassemble to form oily micelles, causing the droplets to shrink further at a rate that depends on the SDS concentration. This process, schematically depicted in Fig. 1a, depletes the surfactant molecules near the surface and results in a radially symmetric concentration profile of SDS. Figure 1b shows that the surface tension between water and DEP decreases with increasing SDS monomer concentration, as measured using the pendant drop method Faour1996 . This coupling between the surface free energy of the particle and the surfactant monomer causes droplets to move towards higher SDS concentrations in the bulk.
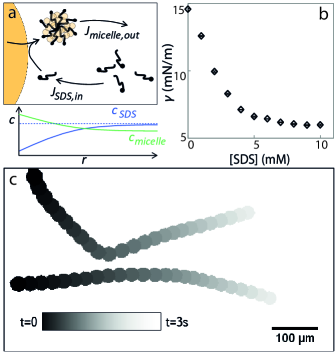
Initially, the dissolution leads to an isotropic concentration profile and no net force acts on the particle. Beyond a cutoff dissolution rate, however, the isotropic state becomes unstable and any fluctuation gives rise to self-sustained motion in a random direction Izri2014 ; Michelin2013 . These ballistic trajectories repel one another, as shown in the example of two swimming DEP droplets in Fig. 1c and in Supplementary Movie 1. To develop an understanding of the interparticle coupling, here we focus on the regime of SDS concentrations in which the droplets are surrounded by a symmetric concentration profile and do not swim. Experimentally, this regime exists between mM SDS, below which the droplets are insoluble, and mM SDS, above which the droplets swim.
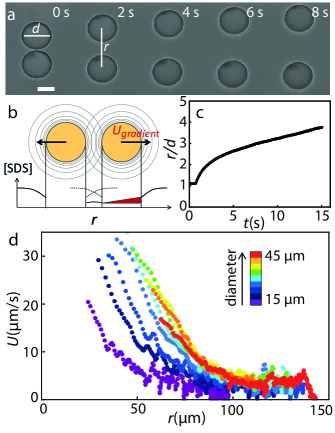
In this regime we measured the interaction strength between dissolving droplets using blinking optical tweezers Crocker1994 ; Krishnatreya2014 . Two holographically projected optical traps were used to bring two droplets close together and then released to allow the particles to move under the influence of the interaction force. Figure 2a and Supplementary Movie 2 show a typical time sequence as the particles move apart during one such cycle. Figure 2b gives a schematic overview of the overlapping concentration profiles that induce an effective interaction. We obtain an estimate for the interaction force by analyzing images of the particle motion. The time trace of the center-to-center separation, , is plotted in Fig. 2c. The derivative of this trajectory yields the relative separation speed,, examples of which are plotted in Fig. 2d as a function of droplet size. The droplets range in diameter from m, and so exhibit no Brownian motion. They move with maximum speeds below m/s, and thus still have a low Reynolds number. Their relative speed is therefore directly proportional to their effective interaction force.
The larger the droplets, the stronger the repulsive interaction, as shown by the data in Fig. 2d. In all cases, the range of the interaction exceeds m, which is longer than that expected for electrostatic interactions. The Debye-Huckel screening length is less than nm at the ionic strengths of our experiments. The typical velocity scale of m/s corresponds to forces on the order of pN. The fact that experiments performed at SDS concentrations below mM show no repulsion confirms that the repulsion is concomitant with the formation of DEP-swollen micelles of SDS. As the SDS concentration is increased, the DEP dissolves faster into the micelles, creating a steeper gradient, which results in an increased interaction strength SM .
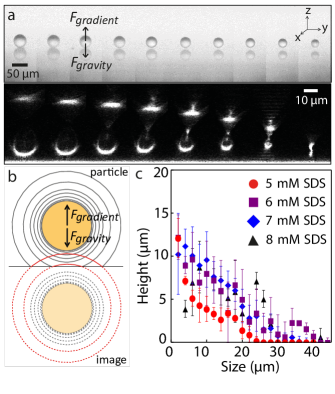
The force mediated by solvent gradients is of the same order of magnitude as the gravitational force acting on individual droplets. This allows for an alternative measurement of the strength of a solute-mediated interaction by balancing it with gravity. Figure 3a shows images of dissolving droplets through a tilted microscope. The top feature is an image of the actual droplet and the bottom feature is an optical reflection in the glass slide. The droplet height is then half the distance between the droplet and its image. Figure 3a shows that particles with a diameter over 30 m make contact with the glass slide because their weight is larger than the gradient force, which repels the particles from the glass wall. For smaller particles, however, the two forces are comparable, resulting in an equilibrium hovering height above the glass cover slide at which the two forces balance.
The lower panel in Fig. 3a shows the same set of experiments performed using confocal microscopy in reflection mode. The elongated shape of the image is caused by internal reflection inside the droplet and the correct measure of the droplet size is the width of the bottom half-sphere SM . The schematic drawing in Fig. 3b indicates how the same solute-mediated interaction that causes repulsion between two droplets is responsible for the hovering above a glass surface. The SDS concentration around the droplet is lower near the glass slide, because no influx of SDS molecules is possible through the glass. This decreased SDS concentration also occurs between two dissolving droplets, as shown in Fig. 2b, so the two situations result in a similar solute-mediated force. Figure 3c shows the equilibrium height of droplets of various SDS concentrations and various sizes, highlighting the trend that smaller active droplets at higher SDS concentrations hover at higher altitude.
Next, we present a theoretical model that predicts the functional form of the interaction and compare it with our measurements of the interaction strength between two droplets. The speed of a droplet in the concentration profile of its neighbor is proportional to the product of the concentration gradient and the particle mobility . The mobility is given by Michelin2013
| (1) |
where is the droplet radius, is the slope of the surface tension versus SDS concentration graph in Fig. 1b, and and are the viscosities of the continuous and dispersed phases, respectively. Assuming steady-state, and imposing the general boundary condition that the diffusive SDS flux to the surface must equal the rate at which SDS is consumed to form swollen micelles SM , the gradient is given by
| (2) |
where is the bulk SDS concentration and is a threshold concentration, which is similar to the critical micelle concentration, but applies to DEP-swollen micelles of SDS. For these micelles, mM SM . The quantity is a length obtained by dividing the diffusion coefficient by the dissolution speed , i.e. the speed at which oil moves across the droplet surface.
Whether the process is limited by a reaction or by diffusion manifests itself in this length scale . The limit corresponds to a constant surface concentration and thus to diffusion-limited dissolution. The opposite limit, , corresponds to a constant dissolution rate, so a reaction-limited system. Plotting the size of the DEP droplets as a function of time reveals a linear dependence of , which is consistent with a diffusion limited process SM . By contrast, previous work assumes a reaction limited process Izri2014 ; Michelin2013 , which gives rise to a linear relation of versus time.
Since the active droplet is also dissolving and creating its own gradient of the same solute, its speed in Eq. (2) is somewhat modified. The surface reaction modifies the external gradient at the particle surface in a way that depends on the value of . By solving the steady-state diffusion equation in the presence of an external gradient SM we find that the bare given in Eq. (2) must be multiplied by the factor
| (3) |
where is the surface gradient corresponding to the back-front asymmetry in the solute concentration on the droplet surface, and is the externally applied gradient. Note that in the case where the surface gradient is enhanced by the surface reaction, whereas in our case and the surface gradient is smaller than the external gradient, highlighting the importance of distinguishing between the two regimes. This effect modifies the concentration profile by a factor , which is independent of the droplet separation .
In addition, the fact that the particle is in motion at a given velocity further enhances the response to the external gradient. As an active particle moves, advection causes accumulation of the solute at the back of the particle, which leads to a back-front asymmetry in the solute concentration around the particle. This asymmetry directs the self-sustained motion at a high enough surfactant concentration Michelin2013 and this coupling between flow and solute gradient gives rise to the swimming instability for isotropic particles. Even below the self-propulsion threshold for a single particle, the speed at which two particles move away from each other is enhanced by this effect. We consider the solute gradient around an active particle moving with a constant velocity and find that the external gradient increases linearly with the particle speed SM . Above a threshold speed, the motion becomes self-sustained. For a diffusion-limited process, the Peclet number of this transition is independent of droplet size and only scales with solute concentration. Indeed, unlike any other known swimmers, experimentally we show that droplets of all sizes swim above the SDS concentration of mM. These results are the first to demonstrate a system in which active particles are not simply on or off, but only swim above a given concentration.
In terms of the droplet-droplet repulsive interaction, this effect gives rise to a nonlinear correction factor to ,
| (4) |
Interestingly, the correction due to the presence of the wall turns out to be negligible SM . On the one hand, the hydrodynamic drag on the particles slows them down, depending on the distance to the wall. Assuming the heights of a moving and a stationary droplet are comparable, we use the data in Fig. 3c to calculate this correction due to the drag. On the other, the depletion of surfactant near the wall, responsible for the hovering effect shown in Fig. 3, enhances the repulsion and speeds up the droplets. These two effects are of comparable magnitude and therefore cancel each other out.
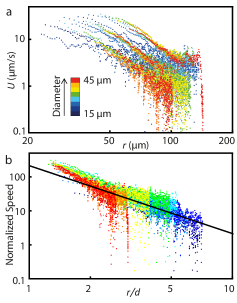
Including correction factors due to the concentration profile of the second droplet, as well as the autophoretic effect, we obtain the droplet velocity as a function of droplet-droplet separation:
| (5) |
where we used the fact that . The lengthscale is the only unknown parameter and all the others are fixed either by the experiment or obtained from the literature. Using this equation, we rescale all the data shown in Fig. 4a onto the mastercurve in Fig. 4b. The log-log plot reveals a consistency with the predicted power law scaling with distance as (black line).
Using that mN m-1 mM-1 from the fit to the high SDS concentration regime of Fig. 1b, we find that nm, in agreement with the earlier observation that and that the dissolution process is diffusion limited. This length scale coincides with the size of an oily micelle, to within an order of magnitude. The obtained value for the fit parameter can be related to the critical Peclet number at which self-propulsion occurs. When , the critical Peclet number can be estimated by
| (6) |
where we evaluated at . Using the diffusion coefficient of oily micelles m2 s-1 Clifford1966 , we find , which is in good agreement with the theoretically predicted value of in Michelin2013 .
An interesting consequence of the fact that active droplets remove SDS from solution as they dissolve and move is that they leave behind them regions depleted of SDS that take time to equilibrate with their surroundings Kranz2016 . As a result, we see memory effects, in which moving droplets can be repelled by the SDS-depleted trails of particles that had previously been at the same location. Supplementary Movie 3 shows an example of this type of memory effect.
These nonequilibrium interactions are relevant to both reactive and dissolving particles, while their strength depends on the rate at which the process occurs and the sensitivity of the particles to the surrounding gradient. The functional form is general for isotropic particles in a steady state and is expected to be universally applicable.
Acknowledgements.
We thank Mike Cates, Wilson Poon, and especially Eric Vanden-Eijnden for insightful discussions. We thank Gerhard Blab for providing the ray tracing simulations. This work was supported by the Materials Research Science and Engineering Center (MRSEC) program of the National Science Foundation under Award Number DMR-1420073 and by the NWO Graduate Program. E.W. and A.B. acknowledge financial support from the European Research Council under the European Union Seventh Framework Programme (FP/2007-2013)/ERC Grant Agreement no. [291667] HierarSACo.References
- (1) W. Wang, W. Duan, A. Sen, and T. E. Mallouk, Proc. Natl. Acad. Sci. U. S. A.110, 17744 (2013).
- (2) R. Soto and R. Golestanian, Phys. Rev. Lett. 112, 1 (2014).
- (3) A. Reinmüller, H.J.vSchöpe and T. Palberg, Langmuir 29, 1738 (2013).
- (4) N. Kravchenko-Balasha, Y. S. Shin, A. Sutherland, R. D. Levine and J. R. Heath. Proc. Natl. Acad. Sci. 113, 02171 (2016).
- (5) N. Kravchenko-Balasha, J. Wang, F. Remacle, R. D. Levine and J. R. Heath, Proc. Natl. Acad. Sci. 111 6521 (2014).
- (6) B.Abécassis, C. Cottin-Bizzone. C. Ybert, A. Ajdari and L. Bocquet, Nat. Mater. 7, 785 (2008)
- (7) N. J. Cira, A. Benusiglio and M. Prakash, Nature 519, 446 (2015)
- (8) see Supplementary Materials
- (9) T. Toyota, N. Maru, M. M. Hanczyc, T. Ikegami and T. Sugawara, J. Am. Chem. Soc. 131, 5012 (2009)
- (10) J. Elgeti, R. G. Winkler and G. Gompper, Rep. Prog. Phys. 78, 56601 (2015)
- (11) N. L. Abbott and O. D. Velev, Curr. Opin. Colloid Interface Sci. 21, 1 (2016)
- (12) W. F. Paxton, S. Sundarajan, T. E. Mallouk and A. Sen, Angew. Chemie - Int ed. 45, 5420 (2016)
- (13) S. Sengupta. M. E. Ibele and A. Sen, Angew. Chemie - Int. Ed. 51, 8434 (2012)
- (14) J. Palacci, S. Sacanna, A. P. Steinberg, D. J. Pine and P. M. Chaikin, Science 579, 6122 (2012)
- (15) S. Thutupalli, R. Seemann and S. Herminghaus, New J. Phys. 13, 073021 (2011)
- (16) I. Buttinoni, J. Bialké, F. K. Kömmel, H. Löwen, C. Bechinger and T. Speck, Phys Rev. Lett. 110, 1 (2013)
- (17) T. Sanchez, D. T. N. Chen, S. J. DeCamp, M. Heymann and Z. Dogic, Nature 491, 431 (2012)
- (18) I. Theurkauff, C. Cottin-Bizonne, J. Pallaci, C. Yert and L. Bocquet, Phys. Rev. Lett 108, 1 (2012)
- (19) V. Schaller and A. R. Bausch, Proc. Natl. Acad. Sci. 110, 4488 (2013)
- (20) R. Ni, M. A. Cohen Stuart and M. Dijkstra, Nat. Commun. 4, 2704 (2013)
- (21) A. Brown and W. Poon, Soft Matter10, 4016 (2014)
- (22) G. Faour, M. Grimaldi, J. Richou and A. Bois, J. Colloid Interface Sci. 181 385 (1996)
- (23) Z. Izri, M. N. Van der Linden. S. Michelin and O. Dauchot. Phys. Rev. Lett. 113, 1 (2014)
- (24) S. Michelin, E. Lauga and D. Bartolo, Phys. Fluids 25, 1 (2013)
- (25) J. C. Crocker and D. G. Grier, Phys. Rev. Lett 73, 352 (1994)
- (26) B. J. Krishnatreya, A. Colen-Landy, P. Hasebe, B. A. Bell, J. R. Jones, A. Sunda-Meya and D. G. Grier, Am. J. Phys. 82, 23 (2014)
- (27) J. Clifford and B. A. Pethica, J. Phys. Chem 70, 3345 (1966)
- (28) W. T. Kranz, A. Gelimson, K. Zhao, G. C. L Wong and R Golestanian, Phys. Rev. Lett 117, 1 (2016)