Asymmetric Expansion of the Youngest Galactic Supernova Remnant G1.9+0.3
Abstract
The youngest Galactic supernova remnant (SNR) G1.9+0.3 (catalog ), produced by a (probable) SN Ia that exploded CE, is strongly asymmetric at radio wavelengths, much brighter in the north, but bilaterally symmetric in X-rays. We present the results of X-ray expansion measurements that illuminate the origin of the radio asymmetry. We confirm the mean expansion rate (2011 to 2015) of 0.58% yr-1, but large spatial variations are present. Using the nonparametric “Demons” method, we measure the velocity field throughout the entire SNR, finding that motions vary by a factor of 5, from to yr-1. The slowest shocks are at the outer boundary of the bright northern radio rim, with velocities as low as 3,600 km s-1 (for an assumed distance of 8.5 kpc), much less than – km s-1 along the X-ray-bright major axis. Such strong deceleration of the northern blast wave most likely arises from the collision of SN ejecta with a much denser than average ambient medium there. This asymmetric ambient medium naturally explains the radio asymmetry. In several locations, significant morphological changes and strongly nonradial motions are apparent. The spatially-integrated X-ray flux continues to increase with time. Based on Chandra observations spanning 8.3 yr, we measure its increase at yr-1. The SN ejecta are likely colliding with the asymmetric circumstellar medium ejected by the SN progenitor prior to its explosion.
Astrophysical Journal Letters
1 Introduction
The youngest Galactic supernova remnant G1.9+0.3 (Reynolds et al., 2008) has provided important new information on the very early development of a supernova remnant (SNR) as it interacts with the immediate SN environment. Its rapid expansion ( km s-1, for a presumed distance of 8.5 kpc; Carlton et al., 2011, hereafter C11) allows the study of expansion over relatively short time baselines. In C11, we compared observations in 2007 (Epoch I) and 2009 (Epoch II) in X-rays to obtain a mean expansion rate of 0.642% 0.049% yr-1, or a mean expansion age of yr. Assuming a mean deceleration rate () of about , this implies a remnant age of 100 yr. However, the expansion is far from uniform. A much longer (1 Ms) observation in 2011 (Epoch III) allowed the detection of departures from uniformity in expansion along the major axis (Fig. 1): the expansion varies systematically with radius, decreasing from yr-1 to yr-1 (Borkowski et al., 2014, hereafter B14). This difference was ascribed either to asymmetry in the surrounding medium, or in the ejecta themselves, indicating a significantly anisotropic explosion. We have now obtained an additional observation in X-rays of 400 ks (2015) which allows the further study of nonhomologous expansion in G1.9+0.3. These observations should inform ongoing work on modeling G1.9+0.3 (e.g., Yang et al., 2016; Chakraborti et al., 2016; Tsebrenko & Soker, 2015a, b).
The high expansion velocities, absence of an obvious pulsar-wind nebula, and bilateral symmetry of the X-ray emission (as in SN 1006; Winkler et al., 2014) suggest that G1.9+0.3 originated in a Type Ia event. The detailed dynamics can then provide clues to the nature of these explosions, at an age when ejecta still dominate the dynamics. Thermal emission from Si, S, and Fe in isolated regions has allowed a picture to be drawn of highly anisotropic, overturned material (Borkowski et al., 2013).
One mystery, evident from the earliest X-ray observations, was the difference in morphology between radio and X-ray. The radio image (Fig. 1) shows a broad maximum across the northern rim, rather than bilaterally symmetric rims in the SE and NW. Since all the emission is synchrotron, this morphological contrast is puzzling. SN 1006, for instance, has virtually identical images in radio and nonthermal X-rays (Winkler et al., 2014). The simplest explanation involves assuming that radio-bright but X-ray faint regions result from an energy distribution of relativistic electrons that is larger than that from X-ray bright regions at radio-emitting energies of order 1 GeV, but which cuts off before reaching X-ray emitting energies. One must then search for a mechanism to produce such differences.
2 Observations
2.1 X-ray
| Date | Observation ID | Roll Angle | Effective exposure time |
|---|---|---|---|
| (deg) | (ks) | ||
| May 04–05 | 16947 | 87 | 39 |
| May 05–07 | 17651 | 87 | 111 |
| May 09–10 | 17652 | 87 | 26 |
| May 20 | 16949 | 75 | 9 |
| Jul 14–15 | 16948 | 272 | 40 |
| Jul 15 | 17702 | 272 | 37 |
| Jul 17 | 17699 | 272 | 20 |
| Jul 24 | 17663 | 272 | 57 |
| Jul 25 | 17705 | 272 | 10 |
| Aug 31 | 17700 | 260 | 15 |
| Sep 01–02 | 18354 | 260 | 29 |
The most recent (Epoch IV) Chandra observations of G1.9+0.3 (catalog ) took place in 2015 Spring and Summer in 11 individual pointings (Table 1) with a combined effective exposure time of 392 ks, with the remnant again placed on the Advanced CCD Imaging Spectrometer (ACIS) S3 chip. In order to reduce particle background, Very Faint Mode was used. All observations were reprocessed with CIAO v4.7 and CALDB 4.6.7, then spatially aligned to the longest pointing from early May (Obs. ID 17651) using photons from the remnant itself (see C11 and B14 for description of the alignment method). Numerous point sources present near G1.9+0.3 (catalog ) were then used to perform the final alignment to the deep (977 ks) Epoch III observation. The exposure-weighted time interval between Epochs III and IV is 4.057 yr. While shorter 49.6 ks Epoch I and 237 ks Epoch II observations provide longer time baselines (8.331 yr and 5.918 yr, respectively), this advantage is more than offset by the increased counting noise compared to the long Epoch III observations. Therefore, the expansion measurements described here are based on the Epoch III and IV observations alone.
Images, in size, were extracted from the merged event files by binning event positions to half the ACIS pixel size, so one image pixel is . We also extracted data cubes, in size, using the same spatial pixel size, while spectral channels from 76 to 555 (1–8 keV energy range) were binned by a factor of 32.
X-ray spectra were extracted from individual rather than merged event files, and then summed (response files were averaged). Spectral analysis was performed with XSPEC v12.8.1 (Arnaud, 1996), using C-statistics (Cash, 1979). Background was modeled rather than subtracted. Spectra of G1.9+0.3 (catalog ) were modeled with an absorbed power law, using solar abundances of Grevesse & Sauval (1998) in the phabs absorption model.
2.2 Radio
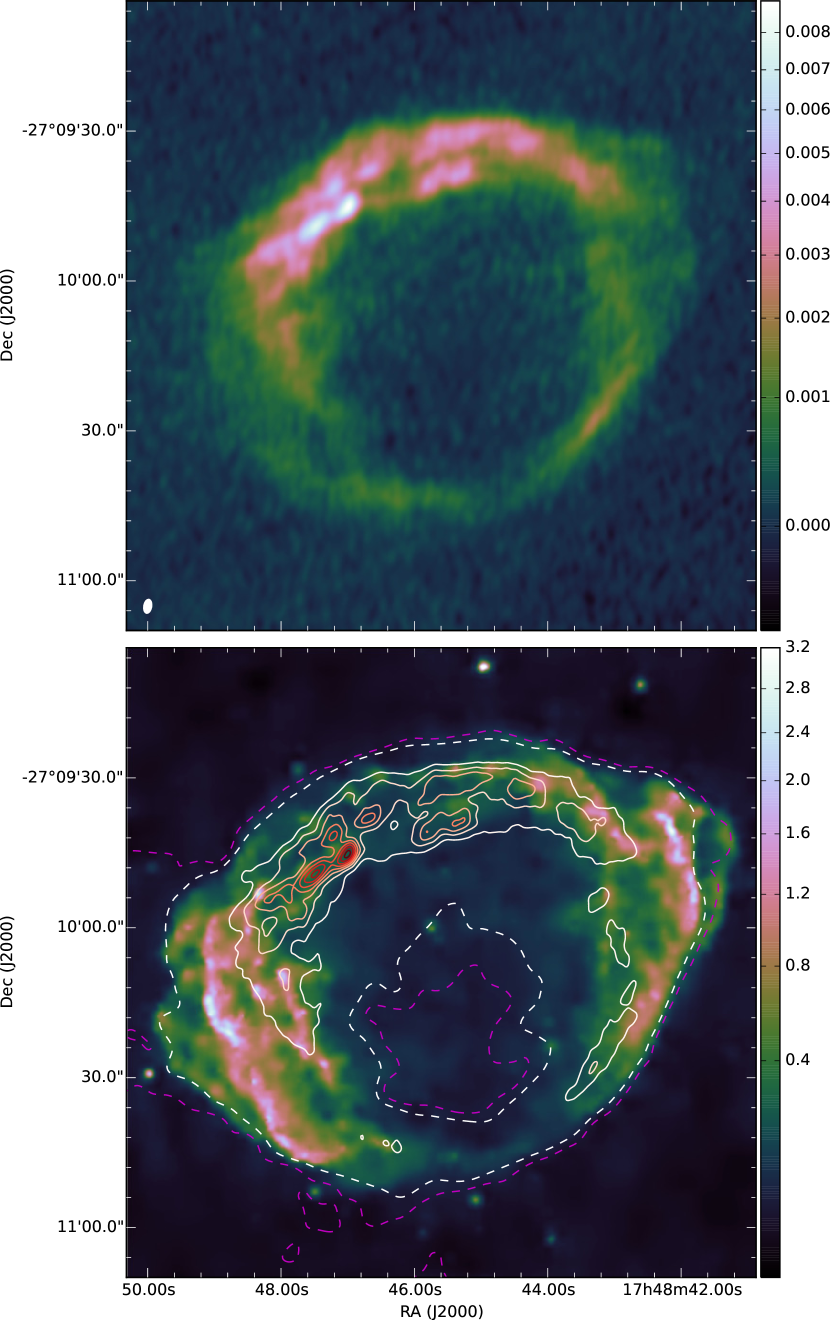
G1.90.3 was observed with the Karl G. Jansky Very Large Array (VLA) in three configurations between 2008 December and 2009 July, in L-band. Two observations were made in A array, each of 5.7 hr on source, and one each in the B and C array, each of 0.6 hr on source. The observations were made with two 25 MHz bandwidths. However, one of these was badly affected by interference, so the results presented here are from a single 25 MHz bandwidth, centered at 1365 MHz. The observations were calibrated using standard techniques in the Astronomical Image Processing System (AIPS), and combined for imaging. Figure 1 shows the image of G1.90.3, with a resolution of at a PA of , which has an r.m.s. noise of mJy beam-1. The inclusion of the smaller configurations in these observations, i.e. B and C array, means that this image is sensitive to structures on all scales from G1.90.3. Radio contours, overlaid over a smoothed 2009 Chandra image in Figure 1, show that the bright radio emission in the north is bounded on the outside by faint X-ray emission that marks the location of the primary blast wave there. Similarly, radio emission in the SE and NW is also bounded on the outside by X-ray filaments, but this time X-rays are bright and the radio emission is faint. Radio contours at low surface brightness (Fig. 1) show that this contrast between bright X-rays and faint radio is most conspicuous for the outermost protrusions (“ears”) in the SE and NW.
3 Expansion
Relatively simple, parametric methods for measuring expansion (such as those used in C11 and B14) cannot describe the very complex expansion of G1.9+0.3 (catalog ) revealed by the new Chandra observations. We now use the “Demons” algorithm of Thirion (1998), as implemented in the SimpleITK software package (Lowekamp et al., 2013), to measure the nonuniform expansion of G1.9+0.3 (catalog ). Attributing morphological changes only to motions, the Demons method provides a nonparametric way for measuring these motions globally. Since this computationally-efficient method (approximately) minimizes the sum of squared differences between pixel intensities, we need to apply it to the smoothed images, not to raw Chandra images that are badly affected by counting noise.
We smoothed Chandra data with the non-local PCA method of Salmon et al. (2014), with smoothed images extracted from smoothed data cubes. This method combines elements of dictionary learning and sparse patch-based representation of images (or spectral data cubes) for photon-limited data. Because this Poisson-PCA method is computationally intensive, relatively small () data cubes, heavily binned along the spectral dimension as described above, were smoothed using patches in size. The moderate spatial patch size of preserves sharp spatial structures seen in the bright filamentary features, while a large patch size in the spectral dimension is suitable for the synchrotron-dominated spectra of G1.9+0.3 (catalog ) that vary smoothly across the entire spectral range of Chandra. With the patch size chosen, the most important parameters that control the smoothing of data cubes are the rank of the approximation to the underlying intensity to the collection of patches (order of the Poisson-PCA method), and the number of clusters into which patches are grouped prior to estimation of intensities. We used and for the 2011 and 2015 data cubes of G1.9+0.3 (catalog ).
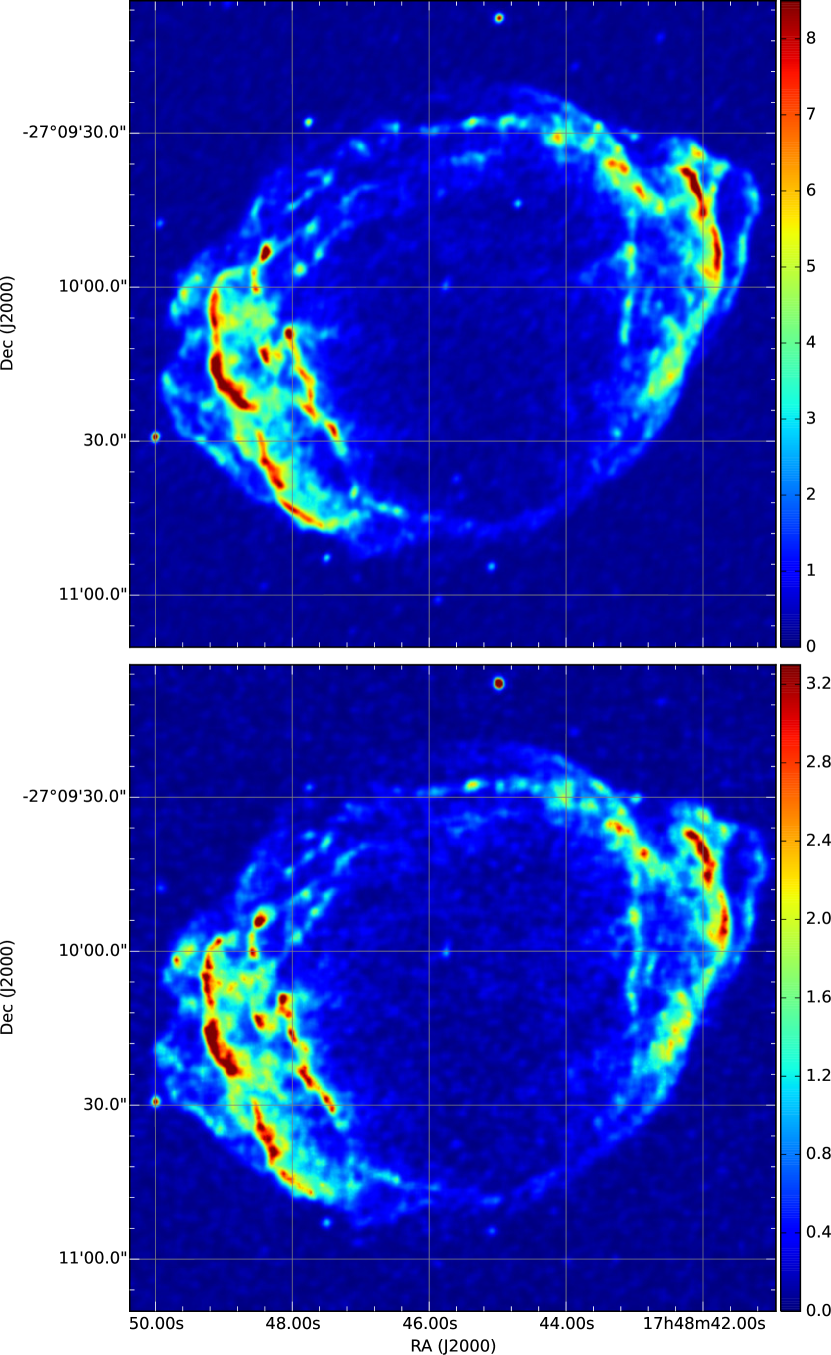
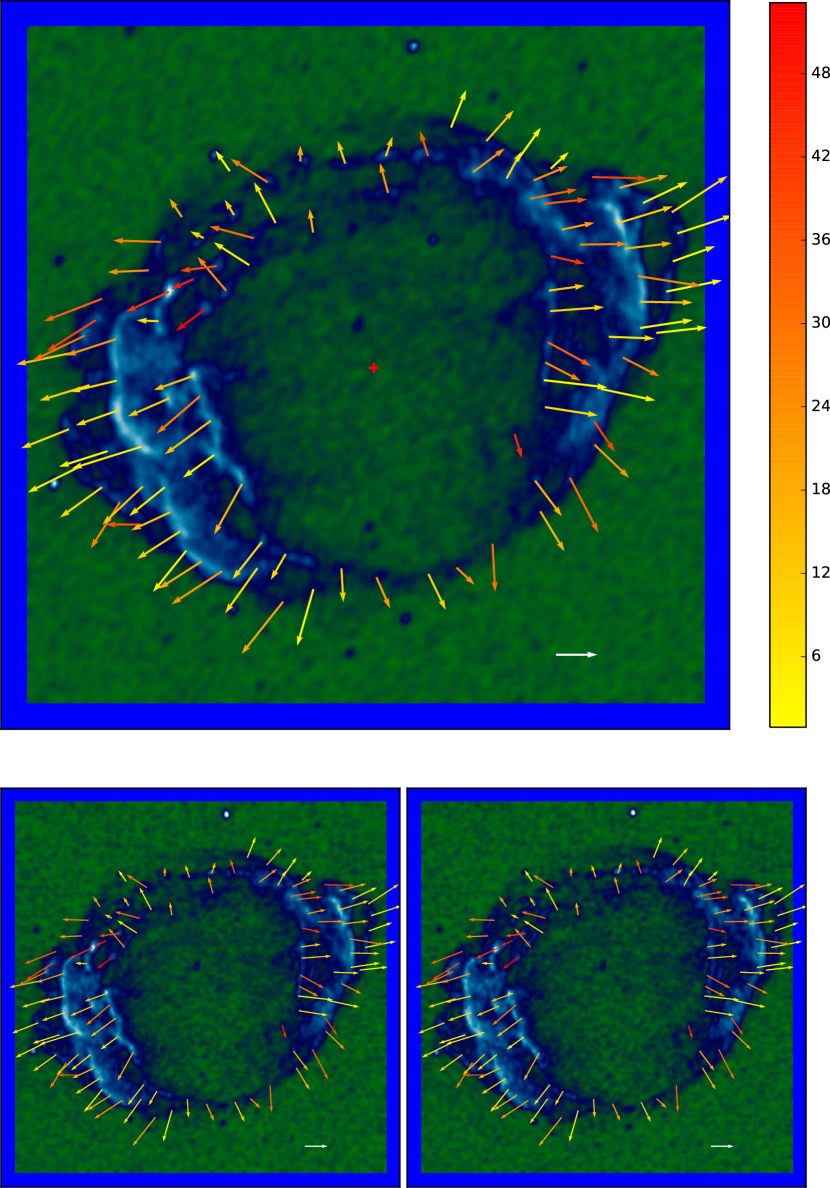
The expansion of G1.9+0.3 (catalog ) is readily apparent by comparing smoothed Chandra images from 2011 and 2015 (Fig. 2). We measure an average expansion rate of 0.58% yr-1 between these 2 epochs (using the same method as in C11, ), but there are very large deviations from uniform expansion. In only 4 years, striking morphological variations at various locations within the remnant can be discerned by eye. These include bending of the innermost rim in the west, and even more complex, strongly nonradial motions in the NE where changes in relative positions of prominent emission knots and filaments can be seen. In the framework of the Demons algorithm, which can account for such complex motions, the 2011 1–8 keV smoothed image is considered as the reference image, while the 2015 1–8 keV smoothed image is the moving image. Before application of the Demons method, particle background with an estimated rate of and cts s-1 per image pixel was subtracted from the 2011 and 2015 images respectively, and then each background-subtracted image was normalized using a corresponding monochromatic ( keV) exposure map. Point sources and the featureless interior of the remnant have been masked out. The uniform expansion at 0.58% yr-1 centered north of the geometrical center was used to set initial displacements between the two epochs, then at each iteration step of the Demons method computed displacements were smoothed with a Gaussian with FWHM of 111Other parameters of the Demons method are far less important and primarily affect its convergence rate.. After achieving convergence, this smoothing resulted in a good match between the 2011 image and the (transformed) 2015 image (Fig. 3), demonstrating the effectiveness of the Demons method, but the final displacement vectors were affected by substantial noise. We reduced this noise by calculating brightness-weighted averages of displacement vectors within various regions of interest. Finally, these averaged displacements were divided by to obtain proper motion vectors .
We show vectors in Figure 3 for a large number of regions chosen to delineate all major morphological features of G1.9+0.3 (catalog ). The white arrow with length yr-1 (10,100 km s-1 at 8.5 kpc) shows their scale, while their tails are located at the geometrical centroids of these regions. Motions are between yr-1 and yr-1, varying by a factor of up to 5. The median is yr-1. The slowest shocks are in the north. The fastest motions are predominantly along the major axis of the remnant. Motions are strongly nonradial with respect to the remnant’s geometrical center at R.A. , Decl. . We infer the explosion occurred somewhere NE of the geometrical center. Extreme deviations from radial motions are present.
In Figure 4, we draw vectors over the radio and contemporaneous 2009 Chandra images (tails of vectors were shifted inwards to account for the remnant’s expansion between the 2008 December array A VLA and Epoch III Chandra observations). Expansion is noticeably slower along the outer boundary of the radio emission. The median motion along the outer radio contour at 1.5 mJy beam-1 (regions a to n in Fig. 4) is yr-1 (only 6,900 km s-1), significantly less than the overall median of yr-1 (11,000 km s-1). Among all regions with yr-1, most (12 out of 14) are within the northern rim, predominantly toward the N and NE where radio emission is particularly bright. This includes regions f ( yr-1), g ( yr-1), h ( yr-1), i ( yr-1), k ( yr-1), l ( yr-1), and n ( yr-1). The smallest (region l) corresponds to a velocity of only 3,600 km s-1. But motions of several knots and filaments in the NE are larger, more typical for the remnant as a whole, including regions j ( yr-1) and m ( yr-1). The latter corresponds to a very bright X-ray knot with motion strongly deviating from radial (by ), while the former is the northernmost of 5 fast-moving knots/filaments that are mostly located near where G1.9+0.3 is the brightest in radio.
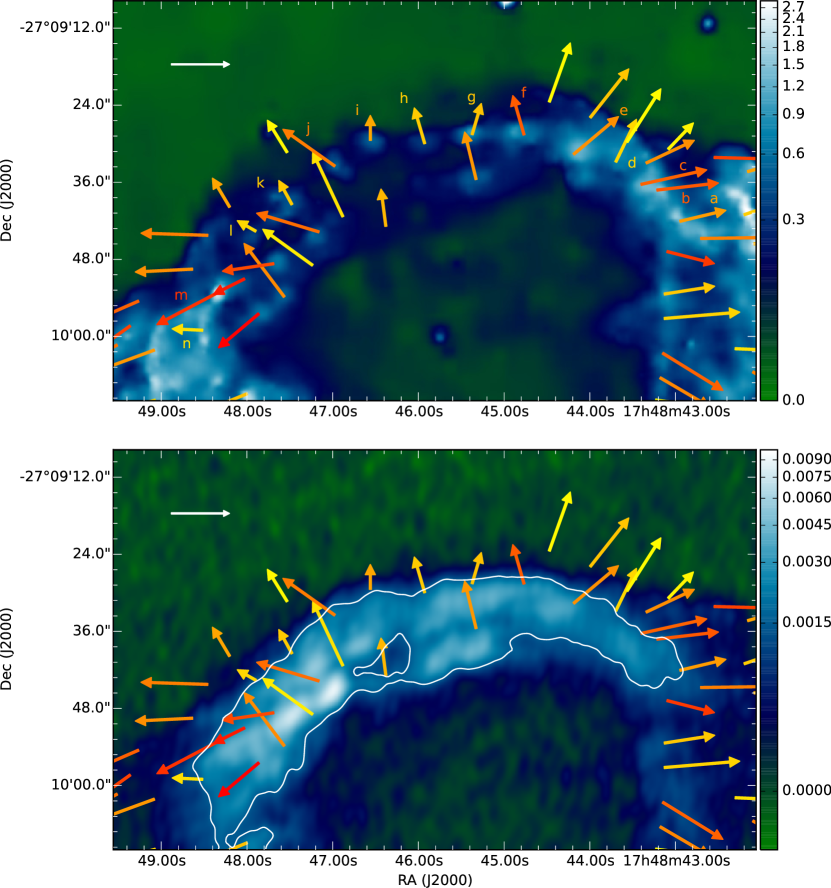
The motions along the NW outer radio contour (regions a – e) are yr-1, yr-1, yr-1, yr-1, and yr-1, respectively, with a median of yr-1 (9,700 km s-1). This is significantly more than in the N – NE, where the median for regions f – n is yr-1 (5,300 km s-1), but still less than average for G1.9+0.3. As in the NE, strongly nonradial motions are present. Unlike the N – NE where X-rays are generally faint and radio is quite bright, this region is moderately bright both in X-rays and radio.
The motions along the major axis are faster than the overall median of yr-1. For the brightest X-ray rims in the middle, the median is yr-1, increasing modestly to yr-1 ahead of these rims. For the innermost rims (this includes vectors within the inner pair of regions in B14, ), the median drops to yr-1. These rather modest (12,000 – 13,000 km s-1) radial variations along the major axis are not surprising in view of the rapid radial decrease in expansion rates found by B14.
For the southern radio rim, the motion is yr-1 (the median for 7 regions along this rim). This is significantly more than yr-1 that we found in the N – NE, and corresponds to velocity of 8,300 km s-1. The southernmost extension toward the east, with only a very faint radio counterpart, must be moving much faster than this as we find yr-1 (15,000 km s-1). Apparently, the motions are also complex in this relatively faint region of the remnant.
4 Flux Increase
A joint fit to the spatially-integrated 1–9 keV spectrum of G1.9+0.3 (catalog ) and to the background spectrum gave a best-fit photon index of and an absorbing column density cm-2, with an absorbed 1–7 keV flux of erg cm-2 s-1 (errors are 90% confidence intervals). Both and are consistent with previous measurements ( and cm-2; B14, ), while the flux increased by 3% since 2011. So G1.9+0.3 (catalog ) continues to increase in brightness, but at a somewhat lower rate than the yr-1 reported in B14.
A linear regression fit to and to the previously-measured fluxes ( erg cm-2 s-1, erg cm-2 s-1, erg cm-2 s-1; B14, ) gives a rate of yr-1. Flux residuals (model fit minus observations) range from (2011) to (2007), comparable to the () statistical error of for but more than found at other epochs. Although only about 8000 source counts were detected in the short 2007 observation, systematic errors are already becoming comparable to statistical errors for Chandra spectra with that number of counts (). The much longer observations from later epochs are then dominated by systematic (not statistical) errors, and the errors are likely comparable for all 4 epochs. In this case, the flux residuals quoted above are consistent with a linear flux increase from 2007 to 2015. Our newly-determined, more accurate rate of yr-1, with the relatively large error of yr-1 accounting for systematic effects, is also consistent with the larger rate of yr-1 ( yr-1 – statistical errors only) based on the Epoch I–III observations alone (B14).
5 Discussion
Figure 4 shows that the slowest expansion speeds are found just beyond the radio maxima. Evidently the shock is encountering denser material there, resulting in a drastic deceleration of the expansion. Such denser material in a slower shock will have two effects on the accelerated electron spectrum: a larger number density of accelerated electrons (since that density is generally found to be a fraction of the total particle density; e.g. Ellison & Cassam-Chenaï, 2005), and a lower maximum energy, since for age-limited acceleration (e.g., Reynolds, 2008). The resulting synchrotron emission will be brighter in radio than that from surrounding regions with faster shocks, but the spectrum will turn over at lower energies and may not reach to X-rays. That is, the slower shocks we observe, produced by denser ambient material, can explain the differing radio and X-ray morphologies. Assume (conservatively) (no extra magnetic-field amplification), then since we expect const., we have (age) , and . In the region of the radio maximum, the mean shock speed is about 4,000 km s-1, or about 0.3 of the value at the bright rims. The integrated spectrum of G1.9+0.3 is well described by a rolloff of Hz (Zoglauer et al., 2015), implying a rolloff near the radio peak of about Hz or less than 0.4 keV – too low to produce appreciable X-ray synchrotron emission at that location.
The rate of flux increase we find, 1.3% yr-1, is still in the range of radio increase rates of 1 – 2% yr-1 (Green et al., 2008; Murphy et al., 2008), so the important question of the comparison of radio and X-ray rates is still unsettled. Different rates imply time-variation in the maximum electron energies, or something even more unexpected. Further observations of both radio and X-rays will be crucial.
The large range of velocity vectors, in both magnitude and direction, that we find in G1.9+0.3 highlights the inadequacy of spherically symmetric models in describing SN events and their aftermath. The north rim is particularly poorly described by 1-D models. Failure to account for the large variations in velocity casts doubt on such analyses. However, these velocities contain a great deal of information on the explosion and the circumstellar environment that rivals Kepler’s SN, the most recent historical SN in the Galaxy, in its complexity. As in Kepler’s Type Ia SNR, large () density gradients are present, and SN ejecta are likely colliding with the asymmetric circumstellar medium ejected by the SN progenitor. Our statistical method of determining velocities throughout an expanding remnant, and not just in well-defined sharp outer edges, should have wide application in following the expansion of young SNRs and elucidating their early evolution and the nature of the surrounding medium.
References
- Arnaud (1996) Arnaud, K. A. 1996, in Astronomical Data Analysis and Systems V, eds. G.Jacoby & J.Barnes, ASP Conf. Series, v.101, 17
- Borkowski et al. (2014) Borkowski, K. J., Reynolds, S. P., Green, D. A., et al. 2014, ApJ, 790, L18 (B14)
- Borkowski et al. (2013) Borkowski, K. J., Reynolds, S. P., Hwang, U., et al. 2013, ApJ, 771, L9
- Carlton et al. (2011) Carlton, A. K., Borkowski, K. J., Reynolds, S. P., et al. 2011, ApJ, 2011, 737, L22 (C11)
- Cash (1979) Cash, W. 1979, ApJ, 228, 939
- Chakraborti et al. (2016) Chakraborti, S., Childs, F., & Soderberg, A. 2016, ApJ, 819, 37
- Ellison & Cassam-Chenaï (2005) Ellison, D. C. & Cassam-Chenaï, G. 2005, ApJ, 632, 920
- Green (2011) Green, D. A. 2011, BASI, 39, 289
- Green et al. (2008) Green, D. A., Reynolds, S. P., Borkowski, K. J., et al. 2008, MNRAS, 387, L54
- Grevesse & Sauval (1998) Grevesse, N., & Sauval, A. J. 1998, Space Sci. Rev., 85, 161
- Lowekamp et al. (2013) Lowekamp, B. C., Chen, D. T., Ibáñez, L., & Blezek, D. 2013, Front. Neuroinform., 7, 45
- Murphy et al. (2008) Murphy, T., Gaensler, B. M., & Chatterjee, S. 2008, MNRAS, 389, L23
- Reynolds (2008) Reynolds, S. P. 2008, ARA&A, 46, 89
- Reynolds et al. (2008) Reynolds, S. P., Borkowski, K. J., Green, D. A., et al. 2008, ApJ, 680, L41
- Salmon et al. (2014) Salmon, J., Harmany, Z., Deladalle, C.-A., & Willett, R. 2014, J. Math. Imaging Vis., 48, 279
- Thirion (1998) Thirion, J.-P. 1998, Medical Image Analysis, 2, 243
- Tsebrenko & Soker (2015a) Tsebrenko, D., & Soker, N. 2015a, MNRAS, 450, 1399
- Tsebrenko & Soker (2015b) Tsebrenko, D., & Soker, N. 2015b, MNRAS, 453, 166
- Winkler et al. (2014) Winkler, P. F., Williams, B. J., Reynolds, S. P., et al. 2014, ApJ, 781, 65
- Yang et al. (2016) Yang, R., Sun, X., & Aharonian, F. 2016, arXiv:1612.02262, A&A submitted
- Zoglauer et al. (2015) Zoglauer, A., Reynolds, S.P., An, H., et al. 2015, ApJ, 798, 98