Delving Deeper into MOOC Student Dropout Prediction
Abstract
In order to obtain reliable accuracy estimates for automatic MOOC dropout predictors, it is important to train and test them in a manner consistent with how they will be used in practice. Yet most prior research on MOOC dropout prediction has measured test accuracy on the same course used for training the classifier, which can lead to overly optimistic accuracy estimates. In order to understand better how accuracy is affected by the training+testing regime, we compared the accuracy of a standard dropout prediction architecture (clickstream features + logistic regression) across 4 different training paradigms. Results suggest that (1) training and testing on the same course (“post-hoc”) can overestimate accuracy by several percentage points; (2) dropout classifiers trained on proxy labels based on students’ persistence are surprisingly competitive with post-hoc training ( versus AUC averaged over 8 weeks of 40 HarvardX MOOCs); and (3) classifier performance does not vary significantly with the academic discipline. Finally, we also research new dropout prediction architectures based on deep, fully-connected, feed-forward neural networks and find that (4) networks with as many as 5 hidden layers can statistically significantly increase test accuracy over that of logistic regression.
1 Introduction and related work
As the number and diversity of massive open online courses (MOOCs) continues to grow, researchers, teachers, and educational technologists are starting to explore innovative ways of helping more students who participate in these courses to persist longer and learn more. While some interventions (e.g., email reminders [22]) may incur very little cost once the core infrastructure for conducting them is in place, other types of interventions – such as a course staff-member actively reaching out to a learner to ask her/him how she/he is doing [19, 8], or an instructor responding substantively within a discussion forum to a comment the student had written [23] – may have high variable costs and be very time-intensive. An automatic detector that could predict automatically – based on demographics or by analyzing subtle cues in a learner’s interaction history with the MOOC courseware – which learners are in danger of “dropping out” from the MOOC and which will likely succeed, would be a valuable tool for making smart decisions about who receives a particular intervention.
Related work: Within the fields of learning analytics and educational data mining, the possibility of creating automatic MOOC dropout detectors has generated considerable interest within the past few years. Existing approaches vary across several dimensions including the features used for classification, the architecture used for training and testing, and the training set used to optimize the classifier parameters – see Table 1 for a synopsis of prior work. The most popular feature representations include clickstream logs, natural language processing (NLP) of discussion forum content, and social network metrics. In terms of architecture, most prior approaches have used generalized linear models (including logistic regression and linear SVMs), survival analysis (e.g., Cox proportional hazard model), and logistic regression. A third dimension of variability is the training setting that describes the source of the training data – e.g., the same course, a prior instance of the same course, or a different course altogether – relative to the target use of the classifier once it has been trained: most research on MOOC dropout prediction to-date has focused on training and testing on data sampled from the same MOOC.
| Survey of Prior Research on MOOC Dropout Prediction | |||||||
|---|---|---|---|---|---|---|---|
| Study | #MOOCs | Features | Architecture | Training setting | |||
| Balakrishnan & Coetzee [1] | 1 | Clickstream | HMM + SVM | Same course | |||
| Boyer & Veeramachaneni [2] | 3 | Clickstream | TL+LR |
|
|||
| Coleman et al. [5] | 1 | Clickstream | LDA+LR | Same course | |||
| Crossley et al. [6] | 1 | Clickstream; NLP | DFA | Same course | |||
| Fei & Yeung [7] | 2 | Clickstream | RNN | Same course | |||
| He et al. [10] | 2 | Clickstream | Smoothed LR | Different offering | |||
| Jiang et al. [12] | 1 | Social network; grades | LR | Same course | |||
| Kizilcec et al. [14, 9] | 20 | Clickstream | LR |
|
|||
| Kloft et al. [15] | 1 | Clickstream | SVM | Same course | |||
| Koedinger et al. [16] | 1 | Clickstream; grades | LR | Same course | |||
| Robinson et al. [17] | 1 | Survey; NLP | LR | Same course | |||
| Rose et al. [25, 18] | 1 | Forum; social network | SA | Same course | |||
| Stein & Allione [20] | 1 | Clickstream; survey | SA | Same course | |||
| Taylor et al. [21] | 1 | Clickstream | LR | Same course | |||
| Whitehill et al. [22] | 10 | Clickstream | LR | Different course | |||
| Xing et al. [24] | 1 | Clickstream; social network | PCA+{BN,DT} | Same course | |||
| Ye & Biswas [26] | 1 | Clickstream | LR | Same course | |||
| Our paper | 40 | Clickstream | {LR, DNN} |
|
|||
When designing and implementing educational interventions that depend on automatic MOOC dropout predictors to predict which students are in danger of failing, it is important to know how accurate such predictors are. In order to obtain reliable accuracy estimates, it is crucial to ensure that the method used for evaluating the classifier is consistent with the manner it will be used for the actual intervention. Live MOOC interventions require dropout predictors that are operational at or near the beginning of a MOOC while students can still benefit from receiving an intervention. But producing such a predictor can be difficult because the target values which indicate whether each student dropped out or completed the MOOC, and which are usually required for training a classifier with standard supervised learning approaches, typically become available only at the end of a MOOC – at which point any intervention is moot.
To-date, most prior research on MOOC dropout detection has largely ignored this issue and both trained and tested on student data sampled from the same course (“post-hoc”), likely because dropout prediction was a new field and the focus was on exploring different feature representations and classification architectures. The study we present in this paper seeks to fill this gap.
Contributions: (1) In this paper we compare the accuracy of a standard dropout prediction architecture – clickstream features classified by logistic regression – across a variety of different training settings in order to understand better the tradeoff between accuracy and practical deployability of the classifier. The dataset we use for training and evaluation consists of 40 popular MOOCs from HarvardX that span a variety of academic disciplines including social science, humanities, STEM, and health sciences. As part of this evaluation, (2) we also explore a novel scheme (similar to the in-situ approach proposed by [2]) for training a classifier while a course is ongoing using proxy labels and show that its performance is surprisingly good even compared to the overly optimistic post-hoc training paradigm. Finally, (3) we propose and evaluate a novel MOOC dropout architecture based on fully-connected, feed-forward neural networks that are trained at each week in a MOOC. We provide evidence that much deeper (5 hidden layers) feature representations than have previously been explored can lead to statistically significantly higher prediction accuracy.
2 Dataset
The experiments and analyses in this paper are based on data from 40 MOOCs from HarvardX – see Table 2 which lists the code name of each course; the year and term (T1, T2, and T3 are northern hemisphere spring, summer, and fall, respectively) when the course was offered; the academic discipline; number of registered participants; and the number of participants who certified. Each MOOC has a launch date (which we call ) when the first materials – e.g., lecture videos, discussion forums, etc. – are released, as well as an end date when certificates are issued.
| List of MOOCs | ||||
|---|---|---|---|---|
| Course | Year | Field | #Part. | #Cert. |
| 1368.1x | 2014T3 | SocialSci | 2335 | 387 |
| 1368.3x | 2015T2 | SocialSci | 1278 | 395 |
| AmPoX.4 | 2015T1 | Hum | 4348 | 344 |
| AmPoX.5 | 2015T2 | Hum | 2296 | 195 |
| AmPoX.6 | 2016T2 | SocialSci | 2810 | 45 |
| BUS5.1x | 2014T1 | SocialSci | 9386 | 575 |
| BUS5.1x | 2015T3 | SocialSci | 4363 | 173 |
| EMC2x | 2015T1 | SocialSci | 8257 | 196 |
| ENGSCI137x | 2016T2 | STEM | 7356 | 339 |
| ER22.1x | 2014T1 | SocialSci | 23972 | 2375 |
| GSE2x | 2014T2 | SocialSci | 23740 | 3847 |
| HDS3221.1x | 2016T1 | Hum | 17949 | 258 |
| HKS101A | 2015T3 | SocialSci | 9849 | 599 |
| HKS211.2x | 2015T3 | SocialSci | 3872 | 791 |
| HLS2x | 2015T1 | SocialSci | 10814 | 2190 |
| HLS3x | 2015T1 | SocialSci | 2468 | 354 |
| MCB63X | 2015T3 | STEM | 11225 | 561 |
| MCB64.1x | 2016T2 | STEM | 6984 | 268 |
| PH210x | 2014T1 | HealthSci | 6390 | 745 |
| PH231x | 2016T1 | HealthSci | 4372 | 414 |
| PH525.1x | 2015T1 | HealthSci | 14300 | 1804 |
| PH525.2x | 2015T1 | HealthSci | 5420 | 869 |
| PH525.3x | 2015T1 | HealthSci | 4690 | 464 |
| PH525.5x | 2015T3 | HealthSci | 1410 | 120 |
| PH525x | 2014T1 | HealthSci | 10705 | 628 |
| PH556 | 2015T3 | HealthSci | 6346 | 900 |
| SPU30x | 2014T2 | STEM | 5611 | 941 |
| SW12.10x | 2015T1 | SocialSci | 5176 | 1246 |
| SW12.2x | 2014T1 | SocialSci | 8660 | 2085 |
| SW12.3x | 2014T1 | SocialSci | 5051 | 1825 |
| SW12.4x | 2014T1 | SocialSci | 4979 | 1527 |
| SW12.5x | 2014T2 | SocialSci | 3466 | 1458 |
| SW12.6x | 2014T2 | SocialSci | 4011 | 1383 |
| SW12.7x | 2014T3 | SocialSci | 3749 | 1391 |
| SW12.8x | 2014T3 | SocialSci | 3677 | 1392 |
| SW12.9x | 2014T3 | SocialSci | 3569 | 1380 |
| SW25x | 2014T1 | HealthSci | 6444 | 1246 |
| SW25x.1 | 2015T1 | HealthSci | 3377 | 453 |
| USW30x | 2016T1 | SocialSci | 3135 | 350 |
| USW30x | 2014T2 | SocialSci | 8245 | 1045 |
2.1 Target labels
The binary target labels used for training and evaluation were whether () or not () each student accrued enough points during the MOOC to earn a certificate. The grade threshold for certification differed across the MOOCs but is typically around . Note that, starting in late 2015, some HarvardX MOOCs implemented a policy whereby only students who paid a fee to have their identity verified could officially earn a certificate. For these courses, we still considered the target label for a student to be as long as her/his point total exceeded the verification threshold – in other words, we ignored the fact of whether or not the student paid money to become ID-verified.
2.2 Features
| List of person_course features | |
| LoE | YoB |
| gender | continent |
| List of person_course_day features | |
| avg_dt | sdv_dt |
| max_dt | n_dt |
| sum_dt | nevents |
| nprogcheck | nshow_answer |
| nvideo | nproblem_check |
| nforum | ntranscript |
| nseq_goto | nseek_video |
| npause_video | nvideos_viewed |
| nvideos_watched_sec | nforum_reads |
| nforum_posts | nforum_threads |
| nproblems_answered | nproblems_attempted |
| nproblems_multiplechoice | nproblems_choice |
| problems_numerical | nproblems_option |
| problems_custom | nproblems_string |
| problems_mixed | nproblems_formula |
| problems_other | |
| List of additional features | |
| precourse_survey | days_since_last_action |
The features that were used for MOOC dropout prediction are clickstream features that are computed from the clickstream log that contains all interaction events between every student and the MOOC courseware; this includes answers to quiz questions, play/pause/rewind events on lecture videos, reading and writing to the discussion form (the events, not the actual text), and more. The features we chose as the basis for automatic MOOC dropout detection are similar to prior approaches (e.g., [2]) and can generalize to a wide variety of MOOCs across academic disciplines; they are listed in Table 3.
2.2.1 Feature extraction
All features were extracted from two different database tables – person_course and person_course_day – that are automatically updated daily by the edx2bigquery data management framework [4] that is used for MITx and HarvardX MOOCs. The person_course features consist of the student’s self-reported highest level of education (LoE), year of birth (YoB), gender, and continent (Africa, Europe, etc.). Each of these variables was converted into a vector of binary dummy variables:
-
•
Age: dummy variables based on the student’s approximate age (computed as ) in the following ranges: , , , , , , , , , , , years, and null (no response).
-
•
LoE: elementary school, junior high school, high school, associate’s degree, bachelor’s degree, master’s degree, professional degree, and null (no response).
-
•
Gender: male, female, other, and null (no response).
-
•
Continent: Europe, Oceania, Africa, Asia, Americas, North America, South America, and null (no response).
The person_course_day dataset was used to compute clickstream features such as the average and total amount of time spent in the course on a particular day (avg_dt, sum_dt respectively), total number of clickstream events (nevents), etc. Although person_course_day contains separate information for each student for each day of the course, we chose to aggregate information across time: Specifically, when making a dropout prediction for a specific student at time , we summed the values within each feature across all days . This approach yields a feature representation that is both smaller and whose dimensionality does not change as a function of time.111Note that, in pilot experimentation we also tried using separate person_course_day features for each day, but the accuracy was lower.
Finally, we extracted two additional features: precourse_survey, which indicates whether or not the student responded to the course’s pre-course survey (which might be positively correlated with commitment to the MOOC), and the number of days since the student interacted with the MOOC courseware (which can be computed from data within person_course_day). In total (including all dummy variables and both demographic and tracking log features), there were features used for prediction.
3 Training Paradigms
We compared several different paradigms for training automatic MOOC dropout predictors:
-
1.
Train on same course (post-hoc): When predicting which students from course will drop out, train using features and target labels from the exact same course . Note that, since target labels for become available only after has ended, this approach essentially would require either that (a) the practitioner go “back in time” to when the MOOC first started, or (b) that a new MOOC with the exact same distribution of students (demographics, prior knowledge, etc.) and with the exact same content and structure is offered in the future, and that no exogenous factors (e.g., comedian Stephen Colbert talking on television about MOOCs [11]) cause students to behave differently during the later incarnation of the course. These assumptions are unlikely to hold. This approach is, however, a useful benchmark to compare against other training paradigms.
-
2.
Train on other course from same field: When predicting which students from course will drop out, train using features and target labels from a different course that has already completed, and for which the target labels are thus already available. Although it is difficult to know which prior course should be used for training, a reasonable choice is a different course from within the same discipline (social sciences, humanities, etc.). We chose to use the largest such course in order to maximize the size of the dataset available for training.
-
3.
Train on many other courses: When predicting which students from course will drop out, train using features and target labels from many different courses (not necessarily within the same discipline). Specifically, for each course , we trained a dropout classifier from each of the other courses (recall that we tested MOOCs in total) and then averaged the classifiers’ hyperplanes together.
In addition, we also explore a novel training approach, similar to the in-situ training method proposed by [2], based on using proxy labels:
-
4.
Train using proxy labels (in-situ): When predicting at week which students from course will drop out, train using proxy labels corresponding to whether each student persisted – i.e., interacted with the MOOC courseware at least once – within the previous week (see Figure 1).
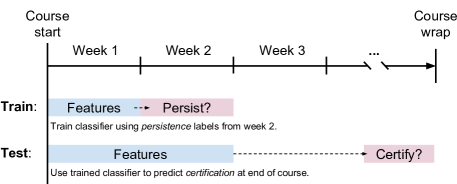
Figure 1: Schematic representing how to Train using proxy labels (in-situ): At each week , proxy labels of whether the persistent persisted during week are used to predict whether or not the student will certify/drop out by the end of the course. This approach can be implemented for any MOOC, and because it does not require “seeing into the future” to obtain target labels, it can deliver a dropout predictor that can be deployed during a live MOOC, not just after it has finished. There is, however, an inherent mismatch between the training target labels (based on persistence) and the testing target labels (based on certification/dropout), and this mismatch may degrade performance.
4 Classification architecture
The classification architecture for the detectors was logistic regression with regularization, which is equivalent to a 2-layer neural network. When estimating parameters of the logistic regression models, we varied the strength of the regularization parameter over the set . Prediction accuracy on the test set did not substantially change (relative to the package-default value of ) over this set, and we thus report all experimental results for . We used the open-source sklearn and numpy packages for training.
4.1 Baseline approaches
In order to gauge how much “added value” is brought by machine learning approaches to MOOC dropout prediction that utilize detailed clickstream information, we also compared the architectures described above to two simple baseline heuristics. In particular, Baseline 1 uses only demographic information – consisting of self-reported year of birth, continent of origin (Africa, North America, etc.), level of education (primary/elementary school, high/secondary school, college, etc.), and gender – to make predictions. These information are available for each student as soon as she/he registers for the course; hence, no clickstream data is required. As with the other approaches, logistic ridge regression was used for classifier training; we trained a separate logistic regression classifier for each course.
We also compared against an even simpler Baseline 2 which requires no machine learning at all; rather, the predictor makes predictions based on the number of days since the student last interacted with the courseware. In prior research on dropout detection [22, 14], this variable alone has shown to be highly predictive of dropout.
4.2 Normalization
For Train on same course (post-hoc), Train on other course from same field, and Train on many other courses, both the training and testing sets were normalized by subtracting each feature value by the feature-wise mean and dividing by the feature-wise standard deviation, where the mean and standard deviation were calculated over only the training data. This normalization is important to ensure that the L2 regularization affects all features similarly. For Train using proxy labels (in-situ), we used a different type of normalization to ensure that feature values are comparable even when they are extracted across time windows of different lengths (see Figure 1). Specifically, we converted all clickstream features from absolute counts to percentiles.
4.3 Accuracy metric
To measure accuracy of the dropout classifiers, we use the Area Under the receiver operating characteristics Curve (AUC) metric. The Receiver Operating Characteristics (ROC) curve itself plots the true positive rate versus the false positive rate of the trained classifier. The AUC is the integral of the ROC curve over the interval and answers the following question: Given one randomly chosen student who drops out from the MOOC and one randomly chosen student who certifies in the MOOC, what is the probability that the classifier can correctly distinguish the two students? A useless classifier that simply flips a coin will have an AUC of 0.5, whereas a perfect classifier will have an AUC of 1. (A classifier with AUC of 0 always makes the wrong discrimination.) Importantly, dropout accuracy as assessed by the AUC statistic is not affected by the overall proportion of students within a particular course who drop out (which is typically very high in MOOCs).
4.4 When to Measure Accuracy
In order to obtain reliable estimates of the accuracy of a MOOC dropout detector, it is important to consider over what time period the accuracy is computed. For the goal of automated intervention, it is more useful to be able to predict early in the course, rather than later, which students will eventually drop out. Another point to consider is that, near the end of the MOOC, some students may have already accrued enough points to earn a certificate. A dropout detector that predicts that such students will not drop out is not so much “predicting” these students’ future performance as it is reporting what they have already achieved; hence, accuracy statistics computed over such students may overestimate the performance of the predictor. For both these reasons, we decided to compute accuracy over all weeks of each MOOC between the course launch date (, when instruction begins) and the earliest date by which students could possibly have earned enough points to earn a certificate ().
Note that the earliest time at which predictions can be made differs across the training paradigms. Specifically, the Train on same course (post-hoc) approach can make predictions after just the first week of the course. In contrast, Train using proxy labels (in-situ) needs at least 2 weeks of clickstream data before the first set of proxy labels become available. Simple baselines based on students’ demographics that require no clickstream data can be applied as soon as students register, which is a notable advantage compared to the machine learning-based approaches.
5 Results
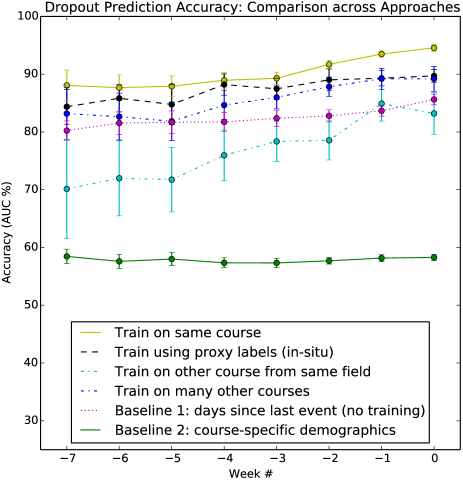
Dropout prediction accuracy (AUC) for all training approaches are shown in Figure 2. The horizontal axis indexes the week in the MOOC, where week 0 is defined for each course to be . (Week corresponds to 3 weeks prior to , etc.) Each data point is shown with error bars corresponding to the standard error of the mean. Since the lengths of the courses varied, the accuracy statistics for each week were computed using only those MOOCs for which data were available at week .
As shown in the graph, the most accurate prediction paradigm was Train on same course (post-hoc), which is the predominant training paradigm used in most prior dropout prediction research. It achieved an accuracy (averaged over all 8 weeks, and all MOOCs within each week) of . Perhaps more surprising is that the second most accurate approach was Train using proxy labels (in-situ). This approach does not require any MOOC – similar or dissimilar – to have been offered previously. Despite the inherent mismatch between the labels of persistence (did the student participate during the previous week?) and labels of certification (will the student earn enough points to earn a certificate?), this approach attained an accuracy (averaged over all tested MOOCs and all 8 weeks) of .
The third most accurate approach was Train on many other courses, with an accuracy of . This training paradigm attained a higher accuracy than did Train on other course from same field (), suggesting that, if it is not possible to exploit course-specific structure via either Train on same course (post-hoc) or Train using proxy labels (in-situ), then it is better to harness prior data from a large variety of courses than from just a single course (even from within the same discipline).
6 Comparison to Baseline Heuristics
Baseline 1, whose predictions are based solely on each student’s self-reported demographics, achieved an average prediction accuracy of , suggesting that only a small amount of information about dropout is contained in the demographics. (Note that we also tried a demographics-based classifier whose parameters were averaged over many courses, rather than just for the one course itself; this approach’s accuracy was even lower.)
Baseline 2, whose predictions are solely on the number of days since the student’s last interaction with the course, performed remarkably well: It attained an average dropout prediction accuracy of , which corroborates previous findings [22, 14] that this variable is highly salient for prediction. Nonetheless, Baseline 2 was still substantially less accurate than either Train on same course (post-hoc) or Train using proxy labels (in-situ), suggesting that harnessing more detailed clickstream features does bring a substantial accuracy boost.
7 Accuracy across academic fields
To explore whether dropout prediction accuracy tended to be higher for MOOCs within a particular academic field – STEM, Humanities, Social Sciences, or Health Sciences – we implemented a linear mixed-effects model in which dropout prediction accuracy for the Train on same course (post-hoc) paradigm was estimated using the week and field as fixed effects and the course as a random effect.
Results: The week was statistically significantly (, ) correlated with dropout prediction accuracy: for each week later in the course (i.e., closer to ), there was an estimated increase in prediction accuracy. The difference in average accuracy varied only slightly as a function of the field: the prediction accuracy tended to be slightly lower for STEM courses and slightly higher for humanities courses. However, the difference between the intercepts for these fields was only ; it was not statistically significant (, ). This suggests that the features listed in Table 3 that we extract for dropout prediction are robust to changes in the MOOC subject matter.
8 Deeper Prediction Architectures
Most of the prior research on automatic MOOC dropout prediction has used generalized linear models – including logistic regression, support vector machines, and survival/hazard models – to classify clickstream, natural language, and/or social network features (see Table 1). Only a handful [7, 5, 1, 24] of approaches have considered deeper learning architectures that can capitalize on nonlinear feature representations and interactions between features. In this section, we explore the potential benefits of employing a deep, fully-connected, feed-forward neural network for dropout prediction. Specifically, we performed an experiment in which we systematically vary both the depth (number of hidden layers), as well as the width (number of neurons per hidden layer), of a neural network, whose input features are the same as in Section 2.2. Between the input and the first hidden layer, and between each pair of consecutive hidden layers, are rectified linear units (ReLUs). The final, output layer is a softmax layer. The course we used for experimentation was the MOOC with the greatest number of certifiers – GSE2X (see Table 2), and we trained neural networks to predict dropout during the last week of the course prior to .
To make experimentation more efficient, we utilized a recently developed methodology for neural network training called Net2Net [3]. Net2Net is useful when training a sequence of incrementally more complex networks. In particular, with Net2Net there exists a teacher network from which a new student network is built. The student network is deeper or wider than the teacher network, but the weights of the student network are initialized prior to training either by (a) replicating neurons within a hidden layer and adjusting the weights to/from those neurons to compensate (Net2Wider); or (b) initializing the weights of the neurons in an additional hidden layer to implement the identity function (Net2Deeper). In this manner, the student network is guaranteed to produce identical outputs as the teacher network at the start of the training and can become even more accurate during training.

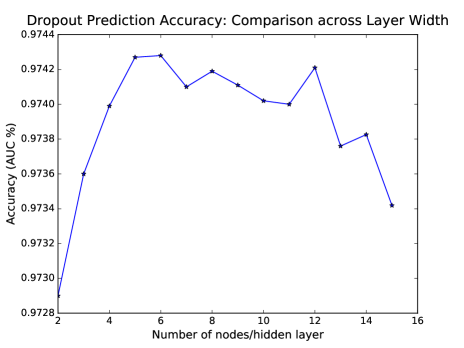
Using Net2Net, we varied the number of hidden layers as well as the number of neurons per hidden layer – see Figure 3. We began with , i.e., a 3-layer neural network with 2 neurons in the hidden layer. We then applied the Net2Wider technique using this network as the teacher and built a student network with neurons in the hidden layer. Next, the neuron network was used as the teacher, and a network with neurons was constructed. This procedure was carried out iteratively until was reached, such that a -neuron student was trained from an -neuron teacher, where . The prediction accuracy at each value of was measured on test data; while the highest accuracy was attained for , accuracy at was very similar (and requires fewer parameters). After maximizing accuracy on test data for with respect to , we fixed and then applied the Net2Deeper approach to maximize accuracy with respect to . Specifically, we iteratively trained a student network with hidden layers from a teacher hetwork with hidden layers, where .
Each network was trained using stochastic gradient descent with no momentum, a learning rate of , over 20 epochs. The minibatch size was 10, and the learning rate was annealed by a factor of after training on each mini-batch. To account for class imbalance, we tried re-weighting the loss of the two classes; however, this technique did not increase test accuracy and was thus dropped. We used the keras software package for training.
8.1 Results
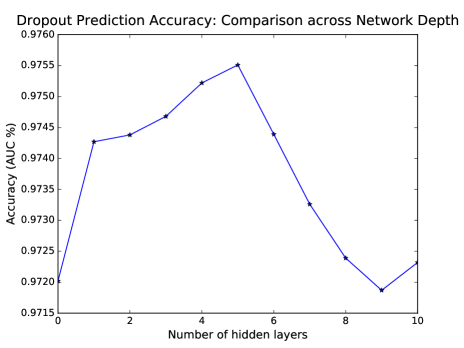
Results of maximizing both respect to and (separately, after fixing ) are shown in Figure 4. For a network with hidden layer, the accuracy at was . When keeping the width fixed at , the highest accuracy – – was achieved for . For comparison, logistic regression – which is equivalent to a neural network with hidden layers – achieved an accuracy of . The difference between these accuracies – – was statistically significant (, two-tailed). For comparison, the difference in accuracies between the first-place and second-place contestants in the 2015 KDD Cup contest on MOOC dropout prediction was [13].
Training cost: On GSE2x, whose training set contains examples, and using the Net2Net training technique, it took 80 seconds (an average of 4 seconds per epoch) for the best network () to train on an NVIDIA Tesla K20Xm GPU.
9 Summary and conclusions
In this paper we have investigated the practical level of accuracy that can be achieved with an automatic MOOC dropout predictor, given the fact that detectors must be trained before they can be deployed, using training data that are collected before their first deployment. In particular, we have compared several different training paradigms that are widely used in the MOOC dropout prediction literature – e.g., train on the same course (post-hoc), train on different course from same academic discipline, and train on many different courses – on 40 different MOOCs that span a variety of disciplines including the humanities, social sciences, health sciences, and STEM. Results suggest that the accuracy of classifiers that are trained on data that are collected only after a course has finished – and which are thus unusable in the MOOC itself – are often several percentage points higher than classifiers that are trained on other MOOCs. This underlines the importance of careful accuracy estimation before conducting a large-scale intervention.
In addition, we have explored a training approach, similar to in-situ training [2], based on the idea of proxy labels – labels that approximate the quantity of interest (dropout versus certification) but that can be collected before a course has completed. Surprisingly, the accuracy of this approach is very similar to when classifier are trained post-hoc from data of courses that have already finished. Moreover, this approach enables a MOOC dropout classifier both to be trained and to be deployed while a course is ongoing.
Finally, we have presented evidence that deeper feature representations of basic demographic and clickstream features – as implemented with a deep (7 layers including 5 hidden layers with 5 neurons per hidden layer), fully-connected, feed-forward neural network can statistically significantly increase the accuracy of MOOC dropout prediction relative to generalized linear models that are the standard today. Using an iterative training strategy [3], the total training time to create such a network is modest and amenable to large-scale implementation over many (hundreds) of MOOCs at regular training intervals (e.g., once per week).
Future work on dropout detection should focus on moving from prediction to intervention. In particular, more research should be invested in identifying not only those students who will drop out, but specifically those who are likely to benefit most from interventions.
References
- [1] G. Balakrishnan and D. Coetzee. Predicting student retention in massive open online courses using hidden markov models. Technical report, UC Berkeley, 2013.
- [2] S. Boyer and K. Veeramachaneni. Transfer learning for predictive models in massive open online courses. In International Conference on Artificial Intelligence in Education, pages 54–63. Springer, 2015.
- [3] T. Chen, I. J. Goodfellow, and J. Shlens. Net2net: Accelerating learning via knowledge transfer. CoRR, abs/1511.05641, 2015.
- [4] I. Chuang and G. Lopez. MITx/HarvardX edx2bigquery. https://github.com/mitodl/edx2bigquery, 2016.
- [5] C. Coleman, D. Seaton, and I. Chuang. Probabilistic use cases: Discovering behavioral patterns for predicting certification. In Learning at Scale, 2015.
- [6] S. Crossley, L. Paquette, M. Dascalu, D. S. McNamara, and R. S. Baker. Combining click-stream data with nlp tools to better understand mooc completion. In Proceedings of the Sixth International Conference on Learning Analytics & Knowledge, pages 6–14. ACM, 2016.
- [7] M. Fei and D.-Y. Yeung. Temporal models for predicting student dropout in massive open online courses. In 2015 IEEE International Conference on Data Mining Workshop (ICDMW), pages 256–263. IEEE, 2015.
- [8] R. Firmin, E. Schiorring, J. Whitmer, T. Willett, E. D. Collins, and S. Sujitparapitaya. Case study: using moocs for conventional college coursework. Distance Education, 35(2):178–201, 2014.
- [9] S. Halawa, D. Greene, and J. Mitchell. Dropout prediction in MOOCs using learner activity features. In European MOOC Summit, 2014.
- [10] J. He, J. Bailey, Benjamin, I. Rubinstein, and R. Zhang. Identifying at-risk students in massive open online courses. In AAAI, 2015.
- [11] A. D. Ho, J. Reich, S. O. Nesterko, D. T. Seaton, T. Mullaney, J. Waldo, and I. Chuang. Harvardx and mitx: The first year of open online courses, fall 2012-summer 2013. Ho, AD, Reich, J., Nesterko, S., Seaton, DT, Mullaney, T., Waldo, J., & Chuang, I.(2014). HarvardX and MITx: The first year of open online courses (HarvardX and MITx Working Paper No. 1), 2014.
- [12] S. Jiang, A. Williams, K. Schenke, M. Warschauer, and D. O’Dowd. Predicting MOOC performance with week 1 behavior. In Educational Data Mining, 2014.
- [13] KDD Cup Organizers. http://kddcup2015.com/submission-rank.html, 2015.
- [14] R. Kizilcec and S. Halawa. Attrition and achievement gaps in online learning. In Learning at Scale, 2015.
- [15] M. Kloft, F. Stiehler, Z. Zheng, and N. Pinkwart. Predicting MOOC dropout over weeks using machine learning methods. In Proceedings of the EMNLP 2014 Workshop on Analysis of Large Scale Social Interaction in MOOCs, pages 60–65, 2014.
- [16] K. R. Koedinger, J. Kim, J. Z. Jia, E. A. McLaughlin, and N. L. Bier. Learning is not a spectator sport: Doing is better than watching for learning from a mooc. In Proceedings of the Second (2015) ACM Conference on Learning@ Scale, pages 111–120. ACM, 2015.
- [17] C. Robinson, M. Yeomans, J. Reich, C. Hulleman, and H. Gehlbach. Forecasting student achievement in moocs with natural language processing. In Proceedings of the Sixth International Conference on Learning Analytics & Knowledge, pages 383–387. ACM, 2016.
- [18] C. P. Rosé, R. Carlson, D. Yang, M. Wen, L. Resnick, P. Goldman, and J. Sherer. Social factors that contribute to attrition in moocs. In Proceedings of the first ACM conference on Learning@ scale conference, pages 197–198. ACM, 2014.
- [19] O. Simpson*. The impact on retention of interventions to support distance learning students. Open Learning: The Journal of Open, Distance and e-Learning, 19(1):79–95, 2004.
- [20] R. Stein and G. Allione. Mass attrition: An analysis of drop out from a principles of microeconomics MOOC. PIER Working Paper, 14(031), 2014.
- [21] C. Taylor, K. Veeramachaneni, and U.-M. O’Reilly. Likely to stop? Predicting stopout in massive open online courses. arXiv, 2014. http://arxiv.org/abs/1408.3382.
- [22] J. Whitehill, J. Williams, G. Lopez, C. Coleman, and J. Reich. Beyond prediction: Toward automatic intervention to reduce mooc student stopout. In Educational Data Mining, 2015.
- [23] T. Wong, D. Lichtenstein, J. Whitehill, G. Lopez, I. Chuang, and A. Ho. The impact of instructor interaction in massive open online course (mooc) discussion forums. In American Educational Research Association workshop, 2016.
- [24] W. Xing, X. Chen, J. Stein, and M. Marcinkowski. Temporal predication of dropouts in moocs: Reaching the low hanging fruit through stacking generalization. Computers in Human Behavior, 58:119–129, 2016.
- [25] D. Yang, T. Sinha, D. Adamson, and C. P. Rose. “Turn on, tune in, drop out”: Anticipating student dropouts in massive open online courses. In NIPS Workshop on Data-Driven Education, 2014.
- [26] C. Ye and G. Biswas. Early prediction of student dropout and performance in moocs using higher granularity temporal information. Journal of Learning Analytics, 1(3), 2014.