Strongly enhanced temperature dependence of the chemical potential in FeSe
Abstract
Employing a 10-orbital tight binding model, we present a new set of hopping parameters fitted directly to our latest high resolution angle resolved photoemission spectroscopy (ARPES) data for the high temperature tetragonal phase of FeSe. Using these parameters we predict a large 10 meV shift of the chemical potential as a function of temperature. In order to confirm this large temperature dependence we performed ARPES experiments on FeSe and observed a 25 meV rigid shift to the chemical potential between 100 K and 300 K. This unexpectedly strong shift has important implications for theoretical models of superconductivity and of nematic order in FeSe materials.
pacs:
I Introduction
To understand high-temperature superconductivity and nematic order in iron-based superconductors, it is necessary to obtain an accurate description and understanding of their electronic structure. However, modelling the electronic structure of iron-based superconductors has proved to be a challenging task. Ab-initio calculations such as density functional theory (DFT) show some disagreement with quantum oscillation experiments Coldea et al. (2008), as well as with the band dispersions obtained from ARPES Ding et al. (2011); Nakayama et al. (2010). In fact, the calculated models need to be renormalized by a factor between 2-10 to be in qualitative agreement with experimental results Yin et al. (2011). More sophisticated theoretical treatments such as dynamical mean field theory (DMFT) are able to account for the orbital-dependent band renormalizations Aichhorn et al. (2010), yet they do not account for more specific features, such as the shrinking of the hole and electron pockets seen in even the simplest iron-based superconductor, FeSe Watson et al. (2016a).
FeSe has attracted a lot of interest due to the highly tuneable nature of the superconducting transition temperature; ranging from 8 K in bulk samples Hsu et al. (2008), 37 K under pressure Medvedev et al. (2009), 43 K with intercalation Burrard-Lucas et al. (2013) and 65 K with a monolayer grown on SrTiO3 He et al. (2013). At 90 K bulk FeSe also experiences a nematic transition - a form of electron correlation which breaks four-fold rotational symmetryFernandes et al. (2014), yet unlike most other iron based superconductors, it is not accompanied by an antiferromagnetic phase transition. In recent years, ARPES studies on FeSe have yielded increasingly detailed information on the quasiparticle dispersions Borisenko et al. (2016); Watson et al. (2015, 2016b); Fedorov et al. (2016); Fanfarillo et al. (2016), yet despite the theoretical interest, a fully accurate model consistent with experiment is still lacking.
In this paper we present a new set of tight binding parameters fitted directly to experimental data for the high temperature tetragonal phase of FeSe. Our parameters are optimized against high-resolution ARPES data at 100 K and provides a quantitatively accurate description of the observed 3D electronic structure. Using this parameter set we predict a large 10 meV rigid increase of the chemical potential between 100 K and 300 K, not predicted from a DFT-based parameter set. Motivated by this finding, we have also performed a temperature-dependent ARPES study on FeSe up to 300 K and observed an enhanced chemical potential shift of 25 meV. We discuss a possible explanation for this enhancement of the observed chemical potential shift with respect to the model prediction. Our results highlight the crucial importance of complete consideration of the chemical potential in both theory and experiment.
II Experimental Methods
High-quality single crystal samples of FeSe were grown by chemical vapor transport Böhmer et al. (2013). ARPES measurements were performed at the I05 beamline at the Diamond Light Source, U.K. Hoesch et al. (2017). The Fermi level position was calibrated by fitting the Fermi function to freshly deposited polycrystalline gold at 35 K. All maps and band dispersions presented here were measured with a photon energy of 56 eV. This ensured that only a single reference measurement from the polycrystalline gold was needed to calibrate the binding energy, eliminating a possible source of experimental error.
Band dispersions used for the optimization of the tight binding model were taken from data published in Ref. [Watson et al., 2015] and [Watson et al., 2016b] by fitting a Lorentzian to the momentum distribution curves at 100 K for photon energies of 37 eV () for the and points and 56 eV () for the and points.
III Tight Binding Model
We use the 10-orbital tight binding model of Ref. [Eschrig and Koepernik, 2009] with the inclusion of an additional spin-orbit coupling term Saito et al. (2015) as the framework for our phenomenological optimization. This model includes all 10 -orbitals associated with the crystallographic space group, i.e the 2-Fe unit cell. Previous tight binding models of iron based superconductors Graser et al. (2010); Knolle et al. (2012); Mukherjee et al. (2015) have normally made use of the glide symmetry of the 2-Fe unit cell to unfold the Brillioun zone into a pseudo -space corresponding to a 1-Fe unit cell Andersen and Boeri (2011). Whilst using the 1-Fe unit cell has been shown to be a good approximation Mukherjee et al. (2015), and is exact in the absence of spin-orbit coupling Nica et al. (2015), optimization of our model against experimental ARPES data allowing for spin-orbit coupling requires a 2-Fe unit cell treatment.
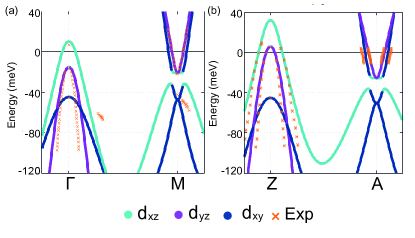
In Fig. 1 we show the calculated band structure obtained using our phenomenological tight binding parameters fitted to ARPES data obtained in the high temperature tetragonal phase at 100 K . We present our ARPES-based parameters in the appendix. These parameters were optimised at both ( and M) and (Z and A) providing a complete three dimensional description of the electron structure of FeSe. The addition of the spin-orbit interaction term manifests itself in two ways. First, it lifts the degeneracy of the and bands revealing a 20 meV splitting at and Z Borisenko et al. (2016) and secondly, it creates an anticrossing of the and near the M and A points. The parameters also correctly describe the recently observed separation at the M and A points Watson et al. (2016b); Fedorov et al. (2016) between the degenerate / band at -22 meV and the band at -42 meV. In the ARPES data there is also a band at -220 meV, which is accounted for in the model, although not shown.
In this tight binding model, the size of the electron pocket and flatness of the band are controlled by the same hopping parameters. Since we wish to maintain quantitative agreement at the Fermi surface, it became necessary to have an exaggerated dispersion at higher energies. Nevertheless, the binding energies of the bands at the high symmetry points are in agreement with experiment, as are the dispersion of all the bands close to the chemical potential. Consequently, as the parameters were fitted within the region of +10 meV to -100 meV we can not comment on the reliability of the model at higher energies.
This highly accurate description of the low-energy part of the band dispersions near the chemical potential allows us to quantitatively reproduce the experimentally determined Fermi surface. Our model therefore provides a good starting point for discussions of low-energy properties of FeSe.
IV Chemical potential
Next we consider what turns out to be an important issue in FeSe, the temperature dependence of the chemical potential. Temperature dependent ARPES studies on the iron-based superconductors BaFe2As2 Brouet et al. (2013), Ba(Fe1-xRux)2As2 Dhaka et al. (2013) and FeSe1-xSx Abdel-Hafiez et al. (2016), as well as the semi-metal WTe2 Wu et al. (2015) have all observed a substantial change to the values of the hole and electron pockets, consistent with a rigid shift to the chemical potential as a function of temperature. This can be explained by the shallow nature of the hole and electron pockets in the iron-based superconductors. To maintain the total charge of the system, the chemical potential must shift to counterbalance any asymmetry in the density of electron and hole carriers as a function of an external variable such as temperature. This effect is small if the density of states around the chemical potential is uniform for both the hole and electron bands, such as in an unrenormalized DFT-based model. However for the shallow band dispersions observed experimentally, with the top of the hole and bottom of the electron bands within a few of the chemical potential, a change in temperature can have an anisotropic effect on the density of thermally active electron and hole carriers, necessitating a shift of the chemical potential.
IV.1 Theoretical predictions
To determine the temperature evolution of the chemical potential in FeSe we calculate the total number of electrons, ,
| (1) |
where is the band index, is the energy of band at momentum , is the Fermi function with , and is the chemical potential. At 100 K the particle number was determined to be 12.00, for a -grid of size 64x64x8. This is consistent with the total number of valence electrons available for two Fe2+ atoms in a 2-Fe unit cell. We fix and calculate from Eq. (1) numerically.
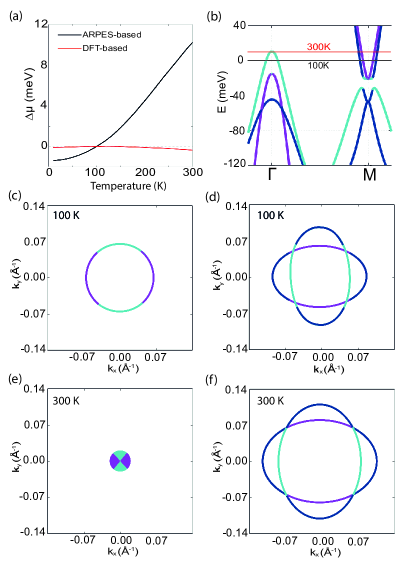
Fig. 2(a) shows the results for the evolution of the chemical potential up to 300 K as predicted from the ARPES-based parameters. This is compared to the predicted evolution of the chemical potential using DFT-based parameters taken from Ref. [Eschrig and Koepernik, 2009]. Whilst the DFT-based parameters would give rise to only a very small change of -0.4 meV between 100 K and 300 K, the ARPES-based parameters we find a much larger 10 meV increase to the chemical potential.
In the case of the DFT-based parameters, the unrenormalized hole and electron bands crossing the chemical potential appear as large pockets with a wide bandwidth and relatively uniform density of states close to the chemical potential. Hence, the chemical potential hardly changes as a function of temperature as would normally be the case in a metallic system. However for the model based on the experimental band dispersions, much smaller Fermi surfaces and renormalized band dispersions close to the chemical potential are described, including a very shallow top of the hole band. Thus the thermal population of hole and electron states can become rather asymmetric, leading to a much more significant shift of the chemical potential. As a result within our realistic ARPES-based parameter set, we find a non-trivial chemical potential effect, particularly for temperatures exceeding 100 K.
As the top of the hole band at is 10 meV above the chemical potential, a shift as large as we predict would cause a substantial change to the Fermi surface topology. In Fig. 2(b) we show where the chemical potential would cut the band structure at 100 K and 300 K. By 300 K the chemical potential would just be touching the top of hole band at . The effect of this on the Fermi surface is shown in Fig. 2(c-f). The chemical potential increase would lead to a dramatic reduction of the value of the hole pocket as a function of temperature, and an increase to the value of the electron pocket.
IV.2 ARPES results
To confirm the predicted temperature dependence of the chemical potential we tracked the evolution of the hole and electron pockets at the high symmetry Z and A points by ARPES.
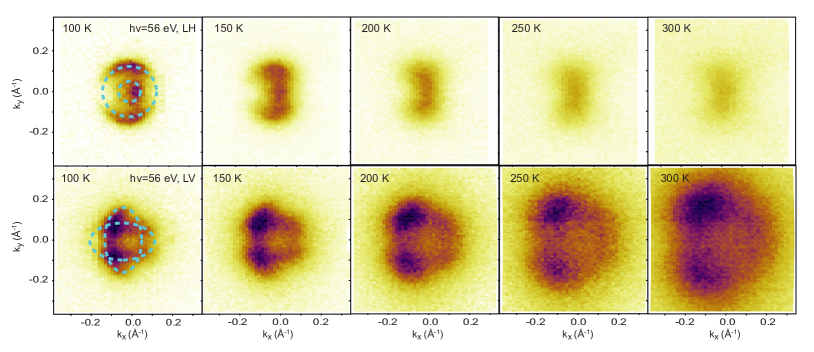
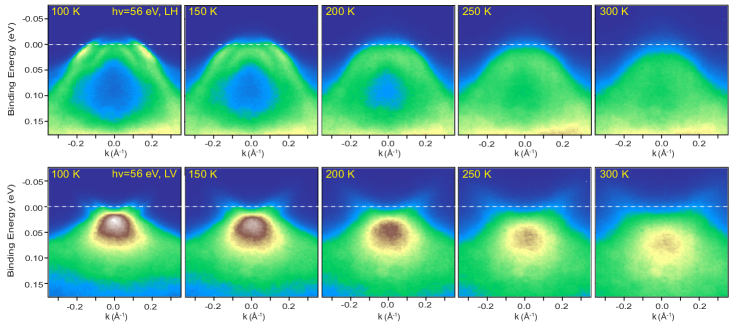
In Fig. 3 we show the temperature dependence of the hole (Z point) and electron (A point) pockets as a function of temperature. At 100 K the hole pocket has two circular bands crossing the chemical potential, as described by our ARPES-base parameters for the Z point. The electron pocket is composed of two overlapping ellipses, roughly the same size as the hole pocket. As the temperature is increased, we observe a shrinking of the hole pocket and growth of the electron pocket, consistent with a rigid shift of the chemical potential as seen in other iron-based superconductors and described by our model.
By 200 K the inner hole band at the hole pocket shifts below the chemical potential, followed by the outer hole pocket by 300 K, suggesting multiple temperature induced Liftshitz transitions Wu et al. (2015). The electron pocket grows monotonically and appears more circular by 300 K, which can be explained by the different Fermi velocities of the two overlapping electron bands, and has been observed in K-doped systems Miyata et al. (2015).
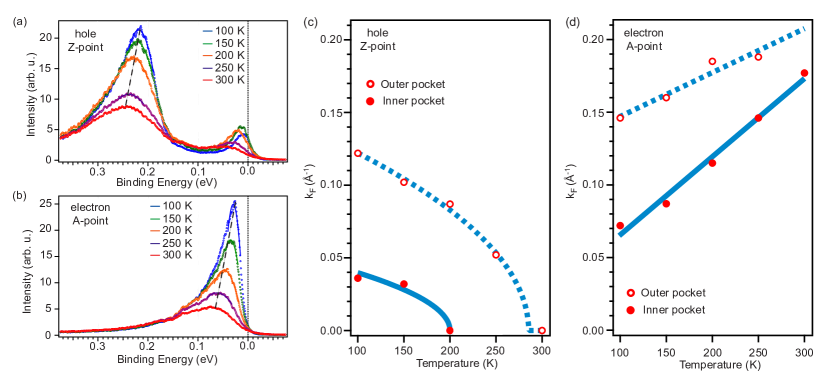
To determine the magnitude of the chemical potential shift we analyse the change of peak positions in the energy distribution curves (EDCs). In Fig. 4(a) and (b) we plot the EDCs for the centers of the hole and electron pocket respectively as a function of temperature. For the hole pocket, two main features are observed: the intense peak at meV, and a complex peak close to the chemical potential which arises from the overlap of , and bands. For the electron pockets, the EDC has a single peak which originates from the slightly overlapping and bands Watson et al. (2016b). It can be seen from both Fig. 4(a) and 4(b) that the peak positions shift linearly as a function of temperature for all bands, further confirming a rigid band shift of the chemical potential. By extracting the peak position for the band in Fig. 4(a), which is composed of only a single feature and is situated far away from the chemical potential, we obtain a linear decrease of meV/K leading to a rigid band shift of 25 meV between 100 K and 300 K.
In Fig. 4(c) we plot the experimentally extracted values as a function of temperature for the hole pockets. Assuming that the chemical potential shift is proportional to temperature, and that the hole band dispersions are quadratic, we should expect to observe a square root behaviour of as a function of temperature. The square root functions fitted to the data (blue lines) show that the values for both the inner and outer hole bands are in agreement with this assumption and suggest that the entire hole pocket has shifted below the chemical potential by 300 K. We also present the values of the electron pockets as a function of temperature in Fig. 4(d). For the electron pockets, the band dispersions in the vicinity of the chemical potential are approximately linear as seen in Fig. 1. As a result the increase in the chemical potential leads to linear increases in values. The different Fermi velocities of the two overlapping electron pockets are also noticeable by the different slopes of the linear fits to the values. All the experimental results points towards a rigid increase of the chemical potential across the entire Brillioun zone.
V Discussion
Whilst the ARPES-based parameter set predicts a significant temperature dependence of the chemical potential between 100 K and 300 K (10 meV), the experimentally observed shift appears to be over twice as large (25 meV). Although there could be some limitations to the precision of our model, the most important features that affect the chemical potential shift, namely the position of the top of the hole band and bottom of the electron band with respect to the chemical potential, are very accurate to the experimental quasiparticle dispersions at 100 K. It does not seem likely that the enhancement of the chemical potential shift by a factor of two can be attributed to any numerical inaccuracy of the model.
We are thus led to the conclusion that this discrepancy must be attributed to temperature dependent electronic correlations, which are not accounted for in our tight binding model. Such correlations could lead to a reduction in the quasiparticle coherent weight with increasing temperature, as well as temperature-dependent life time effects and possibly to asymmetric spectral lineshapes. In particular, a decrease of quasiparticle coherent weight with increasing temperature would lead to a decrease in the density of states, which would require a greater increase to the chemical potential to compensate for the extra loss of states. Such effects are often described in terms of self-energy effects, and have been discussed previously in theoretical studies of the iron pnictides.Heimes et al. (2011, 2012)
The unexpectedly large temperature dependence of the chemical potential in the range of K has important implications on the understanding of various physical properties of FeSe, particularly transport measurements and the spin fluctuation spectrum as probed by inelastic neutron scattering. Specifically the chemical potential shift at high temperatures will result in worse Fermi surface nesting properties between the hole and electron pockets, which could be relevant to the suppression of (,0) magnetic fluctuations at temperatures above 100 K Wang et al. (2016). The chemical potential will also play a role at the nematic transition at 90 K, since any orbital order parameter which creates band shifts around the Fermi level will necessitate a shift of the chemical potential to preserve the total charge of the system. Thus the recently-observed momentum-independent downward shift of the band observed below 90 K Watson et al. (2016b, 2017) could be interpreted as being primarily a chemical potential effect.
VI Summary
To conclude, we have determined a new set of tight-binding parameters for the high temperature tetragonal phase of FeSe that is in good quantitative agreement with high resolution ARPES data at 100 K. We have used these parameters to predict a large temperature dependence of the chemical potential in FeSe, that is not captured from DFT-based parameters. We have performed a temperature-dependent ARPES study of FeSe up to room temperature and observed an enhanced 25 meV shift of the chemical potential between 100 K and 300 K. Our study provides a quantitatively accurate description of the low energy quasiparticle dispersions and highlights the necessity for full consideration of the chemical potential in future studies of FeSe.
VII Acknowledgments
We would like to thank A. I. Coldea, S. V. Borisenko, V. Sacksteder, M. Hoesch and R. Curtis for useful discussions. We thank Diamond Light Source for access to Beamline I05 (Proposals No. SI-12799, CM14454-5) that contributed to the results presented here. L. C. R. is supported by an iCASE studentship of the UK Engineering and Physical Sciences Research Council (EPSRC) and Diamond Light Source Ltd CASE award.
Appendix
Tight binding optimization
Starting form the renormalized tight binding parameters from Ref. [Mukherjee et al., 2015] we optimize the 28 2D and 17 3D tight binding parameters to the experimentally extracted band dispersions by a least squares method using the Powell optimization algorithm.Press et al. (1996). Following the notation of Ref. [Eschrig and Koepernik, 2009], we label the hopping parameters as where and describe the real space Fe-Fe hopping in the and direction of the quazi 2D plane, and state the initial and final orbital the hopping parameter is describing. describes the onsite energy of orbital The orbitals are numbered as [] where the + and - indicate if the orbital is on Fe site 1 or 2 . is the chemical potential at 100 K. and is the magnitude of the spin orbit coupling used in the model. Whilst most parameters are only altered by less than 30% there are significant changes (over 100%) in , , and .
The hopping parameters obtained from the optimization are as follows:
| 2D parameters | |||||
| 3D parameters | |||||
Band Dispersions
In Fig. 5 we present the band dispersions corresponding to the high symmetry cuts of Fig. 3. The white dashed line is the chemical potential position. A rigid shift of both the hole and electrons bands is observed, consistent with an increase of the chemical potential.
References
- Coldea et al. (2008) A. I. Coldea, J. D. Fletcher, A. Carrington, J. G. Analytis, A. F. Bangura, J.-H. Chu, A. S. Erickson, I. R. Fisher, N. E. Hussey, and R. D. McDonald, “Fermi surface of superconducting LaFePO determined from quantum oscillations,” Phys. Rev. Lett. 101, 216402 (2008).
- Ding et al. (2011) H. Ding, K. Nakayama, P. Richard, S. Souma, T .Sato, T. Takahashi, M. Neupane, Y-M. Xu, Z-H. Pan, A. V. Fedorov, Z. Wang, X. Dai, Z. Fang, G. F. Chen, J. L. Luo, and N. L. Wang, “Electronic structure of optimally doped pnictide Ba0.6K0.4Fe2As2 : a comprehensive angle-resolved photoemission spectroscopy investigation,” J. Phys. Condens. Matter 23, 135701 (2011).
- Nakayama et al. (2010) K. Nakayama, T. Sato, P. Richard, T. Kawahara, Y. Sekiba, T. Qian, G. F. Chen, J. L. Luo, N. L. Wang, H. Ding, and T. Takahashi, “Angle-resolved photoemission spectroscopy of the iron-chalcogenide superconductor : strong coupling behavior and the universality of interband scattering,” Phys. Rev. Lett. 105, 197001 (2010).
- Yin et al. (2011) Z. P. Yin, K. Haule, and G. Kotliar, “Kinetic frustration and the nature of the magnetic and paramagnetic states in iron pnictides and iron chalcogenides,” Nat. Mater. 10, 932–935 (2011).
- Aichhorn et al. (2010) M. Aichhorn, S. Biermann, T. Miyake, A. Georges, and M. Imada, “Theoretical evidence for strong correlations and incoherent metallic state in FeSe,” Phys. Rev. B 82, 064504 (2010).
- Watson et al. (2016a) M. D. Watson, S. Backes, A. A. Haghighirad, M. Hoesch, T. K. Kim, A. I. Coldea, and R. Valenti, “Formation of Hubbard-like bands as a fingerprint of strong electron-electron interactions in FeSe,” arXiv:1612.02676v1 (2016a).
- Hsu et al. (2008) F. C. Hsu, J. Y. Luo, K. W. Yeh, T. 0K. Chen, T. W. Huang, P. M. Wu, Y. C. Lee, Y. L. Huang, Y. Y. Chu, D. C. Yan, and M. K. Wu, “Superconductivity in the PbO-type structure of -FeSe,” Proc. Natl. Acad. Sci. U.S.A. 105, 14262–14264 (2008).
- Medvedev et al. (2009) S. Medvedev, T. M. McQueen, I. A. Troyan, T. Palasyuk, M. I. Eremets, R. J. Cava, S. Naghavi, F. Casper, V. Ksenofontov, G. Wortmann, and C. Felser, “Electronic and magnetic phase diagram of -Fe1.01Se with superconductivity at 36.7K under pressure,” Nat. Mater. 8, 630–633 (2009).
- Burrard-Lucas et al. (2013) M. Burrard-Lucas, D. G. Free, S. J. Sedlmaier, J. D. Wright, S. J. Cassidy, Y. Hara, A. J. Corkett, T. Lancaster, P.J. Baker, S. J. Blundell, and S. J. Clarke, “Enhancement of the superconducting transition temperature of FeSe by intercalation of a molecular spacer layer,” Nat. Mater. 12, 15–19 (2013).
- He et al. (2013) S He, J He, W Zhang, L Zhao, D Liu, X Liu, D Mou, Y-B Ou, Q-Y Wang, Z Li, Lili Wang, Y Peng, Y Liu, C Chen, L Yu, G Liu, X Dong, J Zhang, C Chen, Z Xu, X Chen, X Ma, Q Xue, and X. J. Zhou, “Phase diagram and electronic indication of high-temperature superconductivity at 65 K in single-layer FeSe films,” Nat. Mater. 12, 605–610 (2013).
- Fernandes et al. (2014) R. M. Fernandes, A. V. Chubukov, and J. Schmalian, “What drives nematic order in iron-based superconductors?” Nat. Phys. 10, 97–104 (2014).
- Borisenko et al. (2016) S. V. Borisenko, D. V. Evtushinsky, Z.-H Liu, I. Morozov, R. Kappenberger, S. Wurmehl, B. Büchner, A. N. Yaresko, T. K. Kim, M. Hoesch, T. Wolf, and N. D. Zhigadlo, “Direct observation of spin-orbit coupling in iron-based superconductors,” Nat, Phys. 12, 311–317 (2016).
- Watson et al. (2015) M. D. Watson, T. K. Kim, A. A. Haghighirad, N. R. Davies, A. McCollam, A. Narayanan, S. F. Blake, Y. L. Chen, S. Ghannadzadeh, A. J. Schofield, M. Hoesch, C. Meingast, T. Wolf, and A. I. Coldea, “Emergence of the nematic electronic state in FeSe,” Phys. Rev. B 91, 155106 (2015).
- Watson et al. (2016b) M. D. Watson, T. K. Kim, L. C. Rhodes, M. Eschrig, M. Hoesch, A. A. Haghighirad, and A. I. Coldea, “Evidence for unidirectional nematic bond ordering in FeSe,” Phys. Rev. B 94, 201107 (2016b).
- Fedorov et al. (2016) A. Fedorov, A. Yaresko, T. K. Kim, Y. Kushnirenko, E. Haubold, T. Wolf, M. Hoesch, A. Grüneis, B. Büchner, and S. V. Borisenko, “Effect of nematic ordering on electronic structure of FeSe,” Sci. Rep. 6, 36834 (2016).
- Fanfarillo et al. (2016) L. Fanfarillo, J. Mansart, P. Toulemonde, H. Cercellier, P. Le Fèvre, F C. Bertran, B. Valenzuela, L. Benfatto, and V. Brouet, “Orbital-dependent Fermi surface shrinking as a fingerprint of nematicity in FeSe,” Phys. Rev. B 94, 155138 (2016).
- Böhmer et al. (2013) A. E. Böhmer, F. Hardy, F. Eilers, D. Ernst, P. Adelmann, P. Schweiss, T. Wolf, and C. Meingast, “Lack of coupling between superconductivity and orthorhombic distortion in stoichiometric single-crystalline FeSe,” Phys. Rev. B 87, 180505 (2013).
- Hoesch et al. (2017) M. Hoesch, T. K. Kim, P. Dudin, H. Wang, S. Scott, P. Harris, S. Patel, M. Matthews, D. Hawkins, S. G. Alcock, T. Richter, J. J. Mudd, M. Basham, L. Pratt, P. Leicester, E. C. Longhi, A. Tamai, and F. Baumberger, “A facility for the analysis of the electronic structures of solids and their surfaces by synchrotron radiation photoelectron spectroscopy,” Rev. Sci. Instrum. 88, 013106 (2017).
- Eschrig and Koepernik (2009) H. Eschrig and K. Koepernik, “Tight-binding models for the iron-based superconductors,” Phys. Rev. B 80, 104503 (2009).
- Saito et al. (2015) T. Saito, Y. Yamakawa, S. Onari, and H. Kontani, “Revisiting orbital-fluctuation-mediated superconductivity in LiFeAs: Nontrivial spin-orbit interaction effects on the band structure and superconducting gap function,” Phys. Rev. B 92, 134522 (2015).
- Graser et al. (2010) S. Graser, A. F. Kemper, T. A. Maier, H.-P. Cheng, P. J. Hirschfeld, and D. J. Scalapino, “Spin fluctuations and superconductivity in a three-dimensional tight-binding model for ,” Phys. Rev. B 81, 214503 (2010).
- Knolle et al. (2012) J. Knolle, V. B. Zabolotnyy, I. Eremin, S. V. Borisenko, N. Qureshi, M. Braden, D. V. Evtushinsky, T. K. Kim, A. A. Kordyuk, S. Sykora, Ch. Hess, I. V. Morozov, S. Wurmehl, R. Moessner, and B. Büchner, “Incommensurate magnetic fluctuations and Fermi surface topology in LiFeAs,” Phys. Rev. B 86, 174519 (2012).
- Mukherjee et al. (2015) S. Mukherjee, A. Kreisel, P. J. Hirschfeld, and B. M. Andersen, “Model of electronic structure and superconductivity in orbitally ordered FeSe,” Phys. Rev. Lett. 115, 026402 (2015).
- Andersen and Boeri (2011) O.K. Andersen and L. Boeri, “On the multi-orbital band structure and itinerant magnetism of iron-based superconductors,” Ann. Phys. (Berlin) 523, 8–50 (2011).
- Nica et al. (2015) E. M. Nica, R. Yu, and Q. Si, “Glide reflection symmetry, Brillouin zone folding, and superconducting pairing for the space group,” Phys. Rev. B 92, 174520 (2015).
- Brouet et al. (2013) V. Brouet, Ping-Hui Lin, Y. Texier, J. Bobroff, A. Taleb-Ibrahimi, P. Le Fèvre, F. Bertran, M. Casula, P. Werner, S. Biermann, F. Rullier-Albenque, A. Forget, and D. Colson, “Large temperature dependence of the number of carriers in Co-doped ,” Phys. Rev. Lett. 110, 167002 (2013).
- Dhaka et al. (2013) R. S. Dhaka, S. E. Hahn, E. Razzoli, Rui Jiang, M. Shi, B. N. Harmon, A. Thaler, S. L. Bud’ko, P. C. Canfield, and Adam Kaminski, “Unusual temperature dependence of band dispersion in and its consequences for antiferromagnetic ordering,” Phys. Rev. Lett. 110, 067002 (2013).
- Abdel-Hafiez et al. (2016) M. Abdel-Hafiez, Y. J. Pu, J. Brisbois, R. Peng, D. L. Feng, D. A. Chareev, A. V. Silhanek, C. Krellner, A. N. Vasiliev, and Xiao-Jia Chen, “Impurity scattering effects on the superconducting properties and the tetragonal-to-orthorhombic phase transition in FeSe,” Phys. Rev. B 93, 224508 (2016).
- Wu et al. (2015) Y. Wu, N. H. Jo, M. Ochi, L. Huang, D. Mou, S. L. Bud’ko, P. C. Canfield, N. Trivedi, R. Arita, and A. Kaminski, “Temperature-induced Lifshitz transition in ,” Phys. Rev. Lett. 115, 166602 (2015).
- Miyata et al. (2015) Y. Miyata, K. Nakayama, K. Sugawara, T. Sato, and T. Takahashi, “High-temperature superconductivity in potassium-coated multilayer FeSe thin films,” Nat. Mater. 14, 775–779 (2015).
- Heimes et al. (2011) A. Heimes, R. Grein, and M. Eschrig, “Electronic dispersion anomalies in iron pnictide superconductors,” Phys. Rev. Lett. 106, 047003 (2011).
- Heimes et al. (2012) A. Heimes, R. Grein, and M. Eschrig, “Effect of spin fluctuations on the electronic structure in iron-based superconductors,” Phys. Rev. B 86, 064528 (2012).
- Wang et al. (2016) Q. Wang, Y. Shen, B. Pan, X. Zhang, Ikeuchi K., K. Iida, A. D. Christianson, H. C. Walker, D. T. Adroja, M. Abdel-Hafiez, X. Chen, D. A. Chareev, A. N. Vasiliev, and J. Zhao, “Magnetic ground state of FeSe,” Nat. Comm. 7, 12182 (2016).
- Watson et al. (2017) M. D. Watson, A. A. Haghighirad, H. Takita, W. Mansur, H. Iwasawa, E. F. Schwier, A. Ino, and M. Hoesch, “Shifts and splittings of the hole bands in the nematic phase of FeSe,” arXiv:1702.05460 (2017).
- Press et al. (1996) W. H. Press, S. A. Teukolsky, W. T. Vetterling, and B. P. Flannery, Numerical Recipes in Fortran 90, 2nd ed. (Cambridge University Press, 1996).