Scanning the Earth with solar neutrinos and DUNE
Abstract
We explore oscillations of the solar 8B neutrinos in the Earth in detail. The relative excess of night events (the Night-Day asymmetry) is computed as function of the neutrino energy and the nadir angle of its trajectory. The finite energy resolution of the detector causes an important attenuation effect, while the layer-like structure of the Earth density leads to an interesting parametric suppression of the oscillations. Different features of the dependence encode information about the structure (such as density jumps) of the Earth density profile; thus measuring the distribution allows the scanning of the interior of the Earth. We estimate the sensitivity of the DUNE experiment to such measurements. About 75 neutrino events are expected per day in 40 kt. For high values of and 11 MeV, the corresponding D-N asymmetry is about 4% and can be measured with accuracy after 5 years of data taking. The difference of the D-N asymmetry between high and low values of can be measured at the level. The relative excess of the signal varies with the nadir angle up to 50%. DUNE may establish the existence of the dip in the distribution at the level.
pacs:
14.60.Pq, 26.65.+t, 91.35.-x,95.85.Ry, 96.60.Jw,I I Introduction
The Earth matter effect on solar neutrinos predicted long time ago ms4 ; Carlson:1986ui ; Cribier:1986ak ; Bouchez:1986kb ; Hiroi:1987pe ; Baltz:1986hn ; Dar:1986pj ; ms87 ; Baltz:1988sv has been succesfully established at more than level Renshaw:2013dzu , Abe:2016nxk . SuperKamiokande (SK) has observed the Day-Night (D-N) asymmetry of the solar neutrino signal defined as , where and are the rates of events detected during night and day. has been determined by the fit of the zenith angle dependence of and integrated over the energy interval (4.5 - 19.5) MeV. In turn, the rates and as functions of zenith angle (shapes) were computed according to the LMA MSW solution for certain values of oscillation parameters. The amplitude of the D-N variations was used as fit parameter. In this way, using the best value from the solar data fit (low value), eV2, the asymmetry
| (1) |
has been found from a combination of all series of measurements (SK I-IV).
Assuming that there is no energy and zenith angle dependences of the oscillation effect, SK finds a larger asymmetry: % (SK I-IV) and % in SK IV alone with additional statistics Renshaw:2013dzu , Abe:2016nxk .
Previously, SNO measured the neutrino spectra during day and night, indicating a non-zero day-night asymmetry Ahmad:2002ka , Aharmim:2005gt . Joint analysis of all solar neutrino data gives about a evidence of the Earth matter effect Maltoni:2015kca . SuperKamiokande also presented the first meaningful measurements of the zenith angle distribution of events.
These results mark the beginning of experimental exploration of the Earth matter effects. Future developments in detection techniques and the construction of large mass detectors with high energy resolution will open up the possibility of detailed study of the solar neutrino oscillations in the Earth. The implications of these studies include tomography (scanning) of interior of the Earth, measurements of the neutrino parameters and searches for new physics beyond the paradigm.
In fact, there are some hints of new physics already now: the result (1) has reinforced a tension in determination of . Indeed, the asymmetry (1) is in good agreement with the prediction from LMA MSW at low value of which provides consistent description of all solar neutrino data. The asymmetry (1) is about larger than the asymmetry expected for the global fit (high) value of dominated by the KamLAND Gando:2010aa data. Apart from the large observed D-N asymmetry, also an absence of the “spectral upturn” at low energies indicates a low value of Maltoni:2015kca . In future JUNO An:2015jdp will measure with very high precision.
The large DN-asymmetry can be (i) just a statistical fluctuation, (ii) a result of incorrect computation of the expected asymmetry or (iii) due to presence of large (non-standard) matter effect.
Recall that oscillations of solar neutrinos in the Earth, being oscillations of the mass states, are pure matter effect proportional to the matter potential . In the case of standard neutrino interactions, a large is only possible if the chemical composition is abnormal since the density profile of the Earth is very well known Dziewonski:1981xy ; shearer ; petersen1993 . The standard matter effect is determined by the number density of electrons which is related to the total density as . Here is the nucleon mass and is the electron fraction. for an isotopically neutral medium (which is realized in the mantle) and for Hydrogen. Therefore the required increase of the matter effect is possible if one assumes an abnormally high percentage of hydrogen in the Earth. According to the hydric model of the Earth Bezrukov:2016gmy , a large abundance of hydrogen exists in the core of the Earth. However, due to the attenuation effect to be discussed below, SK (having bad reconstruction of the neutrino energy) is not sensitive to the core. So, even this exotic model does not allow to resolve the tension.
Still another possibility is to assume the existence of non-standard neutrino interactions Friedland:2004pp , Miranda:2004nb (see also the review Maltoni:2015kca ). We do not further elaborate on this.
In anticipation of future experiments, in this paper we study in detail the Earth matter effect on the high energy part of the Boron neutrino spectrum. For previous studies see Ioannisian:2004jk ; Akhmedov:2004rq ; Ioannisian:2004vv and references therein. (Oscillations of the solar 7Be neutrinos in the Earth have been explored in Ioannisian:2015qwa .) Here e compute the nadir angle dependence (, being the zenith angle) of the relative excess of the night events
| (2) |
for different energies 111This definition differs from the standard D-N asymmetry: , so the one in (2) is positive and about 2% smaller.. The distributions is then integrated over energy, weighted with the energy resolution (reconstruction) function of a detector. We study the dependence of these integrated distributions on the width of the energy resolution function. A complete interpretation of the nadir angle distributions and their dependence on features of the Earth density profile is given. Thus, studies of the nadir angle distribution allow to scan the density profile of the Earth which is not possible for fixed Akhmedov:2005yt .
The paper is organized as follows: In Sec. II we summarize the relevant information on oscillations in the Earth. We further develop theory of neutrino oscillations in a multi-layer medium. The results are presented in the full three neutrino framework, see Blennow:2003xw for the constant density case. In Sec. III we compute the relative excess as function of the nadir angle and explore effect of the integration over energy with an energy resolution function of different widths and give an interpretation of the obtained dependences. As an example, in Sec. IV we estimate the ability of the DUNE experiment to measure the Earth matter effects. Conclusions are given in Sec. V.
II II Oscillations in the Earth
Solar neutrinos arrive at the Earth as incoherent fluxes of the mass eigenstates . The fractions of these fluxes are determined by the mixing matrix elements in the production region: . In the standard parametrization of the PMNS mixing matrix they equal
| (3) |
where the angle is given by
| (4) |
Here the symbol refers to the solar production environment,
| (5) |
, . At low (solar neutrino) energies the matter effect on 1-3 mixing can be neglected, so that An:2016ses . Bars at ’s and mean averaging over the density in the 8B neutrino production region.
In the Earth each mass state splits into eigenstates in matter and oscillates. Then the probability to find in the detector equals
where is the probability of transition in the Earth. The probability can be rewritten as
| (6) |
where we used the unitarity relation: or . Oscillations of are neglected.
In the Earth oscillations proceed in the low density regime when : at MeV and surface density we have . Here, is defined as in Eq. (5), but with the potential taken in the Earth at position ; a super(sub)script indicates that the respective quantity has to be taken inside the Earth matter. Consequently, the oscillation length in matter
| (7) |
is rather close to the vacuum oscillation length
In Eq. (7)
| (8) |
is the splitting of the eigenvalues in matter at position x.
During day, and Eq. (6) gives
| (9) |
Then the total probability can be represented as
| (10) |
where
| (11) |
describes the Earth matter effect.
The probability of the transition in the Earth, , is determined by dynamics of the - sub-system in the propagation basis after decoupling of the third state (see for details, e.g. Blennow:2003xw , Maltoni:2015kca ). The propagation basis is related to the original flavor basis , in particular, by the 1-3 rotation . The Hamiltonian of the sub-system is characterized by the mixing angle , the mass squared difference and the potential .
The following derivation of reflects immediately the features of the density profile of the Earth which can be considered as a multi-layer medium with slowly varying density inside the layers and sharp density changes (jumps) at the borders between the layers. Within the layers, due to slow density change the neutrinos evolve adiabatically, that is, the transitions between the eigenstates are absent, and they evolve independently. Indeed, departure from the adiabaticity is quantified by the parameter ,
| (12) |
where is the scale of the density change within the layers. The second equality in (12) follows from Eqs. (4) and (5) with substituted by . is the mixing angle in matter. To get an estimate of we take , where is the radius of the Earth, and a typical oscillation length km (for MeV). This gives , so that corrections to the adiabatic result are below .
At the borders of the layers, the adiabaticity in strongly (maximally) broken, which corresponds to a sudden change of the basis of eigenstates. Therefore after passing the border a different, coherent mixture of eigenstates emerges.
Within the layer the mixing angle changes slowly according to the density change. We will denote the values of the angle in the in the th layer at its beginning and its end (along the neutrino trajectory) by and .
The transition matrix between the initial mass states and final flavor states of the propagation basis, in such a multi-layer medium can be written as
| (13) |
Here is the number of layers, is the flavor mixing matrix in the last layer just before a detector (it projects an evolved neutrino state onto the flavor states), is the flavor mixing angle in the -layer. The matrix of basis change between the th and th layers
| (14) |
is the matrix of rotation on the angle , where
| (15) |
is the difference of mixing angles in matter after the th jump, i.e., in the beginning of the layer and before the jump, i.e. at the end of the layer . Finally, is the adiabatic evolution matrix of eigenstates in the layer :
| (16) |
where is the adiabatic phase acquired in the layer
| (17) |
The diagonal character of reflects the adiabaticity of the neutrino propagation within the layers.
The change of mixing angle in the jump (15) can be expressed in terms of change of the potential in the layer as
| (18) |
in lowest order in .
The probability of the transition equals
| (19) |
where the factor follows from projecting back to the flavor basis: .
Let us compute the probability in the lowest order in . Since , the matrix of the basis change can written in the lowest order as
| (20) |
where is the Pauli matrix. Inserting this expression into (13) and keeping only terms up to order , we obtain
| (21) |
where we introduced summation over the jumps. Here are diagonal matrices of the form (16) with the total phase acquired in the Earth:
| (22) |
and with the total phases acquired before and after jump respectively:
| (23) |
Using (21) we find explicitly the - element:
| (24) |
where we have taken into account that . The total amplitude (24) can be viewed as a superposition of waves emanating at the jumps. The amplitudes of the waves are determined by the sizes and signs of jumps, so that and the sign is positive (negative) if the potential increases (decreases) on the way of neutrinos.
Finally, the probability equals
| (25) |
According to (24) and (25), the probability is given by the zero order term and the sum of the contributions of the density jumps. The contribution from the individual jumps is given by the sine of change of the mixing angle in a jump (which is ), and by the phase factor with the total phase acquired over the distance from a given jump to a detector (see also deHolanda:2004fd ). l
We will use these expressions for interpreting the results of numerical computations in sect. III.
In Ref. Ioannisian:2004jk , Ioannisian:2004vv the probability has been obtained in more general integral form which describes both jumps effects and adiabatic propagation:
| (26) |
where
| (27) |
is the adiabatic phase acquired from a given point of trajectory to a detector at . is the total length of trajectory, and is its nadir angle. This form is useful for derivation of the attenuation effect (see below).
For the potential with jumps the integration in (26) can be performed explicitly which reproduces the result (25). The phases (27) , where is the coordinate of -th jump, coincide with .
The solar mixing parameter can be expressed in terms of using eq. (9). Then the difference of probabilities (11) becomes
| (28) | |||||
A key element for understanding oscillations in the Earth is the attenuation effect Ioannisian:2004jk which is a consequence of integrating with the neutrino energy reconstruction function over the neutrino energy:
| (29) |
is the reconstructed energy of the neutrino. The function is determined by the following factors: (i) energy resolution of the detector, (ii) kinematics of reaction, (iii) energy spectrum of produced neutrinos. To see the effect of attenuation, we insert (28) into (29) and have
| (30) | |||||
which defines an attenuation factor Ioannisian:2004jk , with being the distance from the location of interest to a detector. In (30) the expression in parantheses has been put out of the integral because it depends only weakly on energy. For the Gaussian energy resolution function
| (31) |
we obtain
where
| (32) |
is the attenuation length. For , the suppression factor equals , and according to (30), the oscillatory effect of structures with is strongly suppressed. As follows from (32), the better the energy resolution of the detector, the more remote structures can be “seen”.
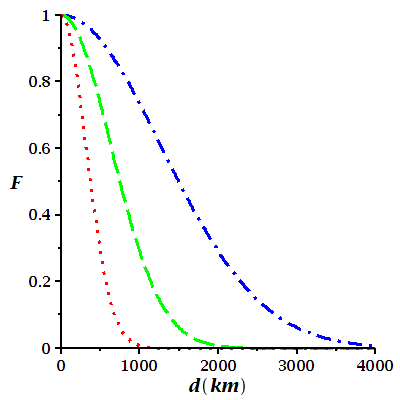
In fig. 1 we show the attenuation factor for different values of energy resolution. If and km the attenuation length equals 1470 km and structures of the density profile at km can not be seen. For the structures with km are strongly attenuated.
III III The relative excess of night events
The relative excess of the night events (2) as function of the nadir angle and reconstructed neutrino energy can be written as
| (33) |
Here is the boron neutrino spectrum Bahcall:1996qv . Notice that only 9.7% of 8B neutrinos have energy 11 MeV but the corresponding fraction of the detected events is 0.9.
We compute the oscillation probabilities and according to (6), (9) and (28) using the spherically symmetric model of the Earth with the eight layers parametrization of the PREM density profile Dziewonski:1981xy . It has 6 density jumps in the mantle and 2 density jumps in the core. The parameters of the jumps (depth, size, nadir angle of the trajectory which is tangential to the jump) are given in TABLE I. Trajectories with cross the core of the Earth. The change of the solar neutrino flux due to the eccentricity of the Earth orbit () is taken into account.
For the energy resolution function we use the Gaussian form (31) with different values of the width .
| Jump | depth() | () | () | ||
|---|---|---|---|---|---|
| J | 0 | 0 | 2.60 | ||
| J | 15 | 2.60 | 2.90 | 0.11 | 1.50 |
| J | 25 | 2.90 | 3.38 | 0.15 | 1.48 |
| J | 220 | 3.36 | 3.44 | 0.02 | 1.31 |
| J | 400 | 3.54 | 3.72 | 0.05 | 1.21 |
| J | 670 | 3.99 | 4.38 | 0.09 | 1.11 |
| J | 2891 | 5.57 | 9.90 | 0.56 | 0.577 |
| J | 5150 | 12.17 | 12.76 | 0.05 | 0.193 |
For cross-sections we take a generic form for interaction with nuclei:
| (34) |
where is a normalization factor (irrelevant for the relative excess), , is the electron momentum and is the threshold of reaction. In computations for DUNE we use MeV (see below).
Notice that at the energies of Boron neutrinos and therefore according to (11) the regeneration (increase) of the flux corresponds to suppression of : due to the Earth matter effect .
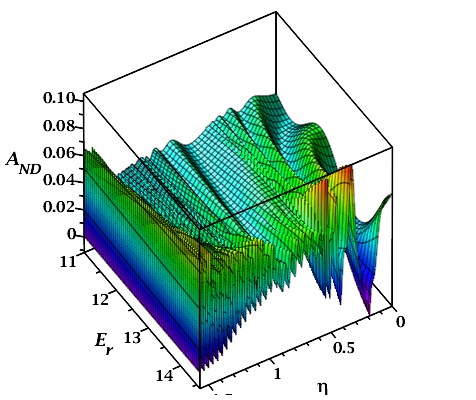
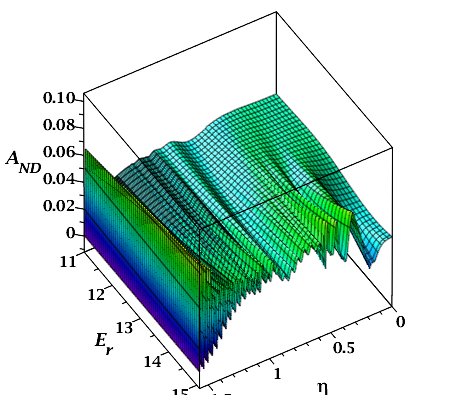
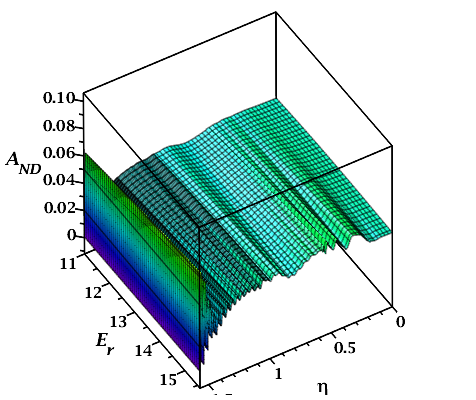
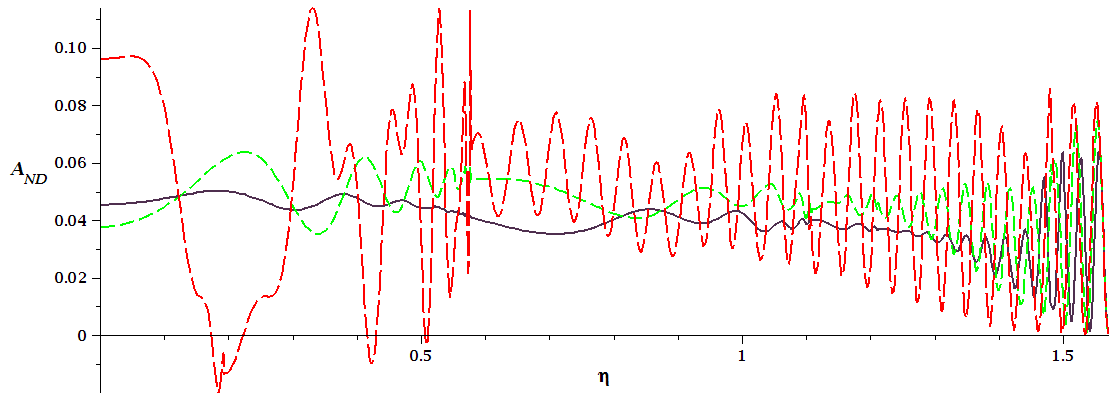
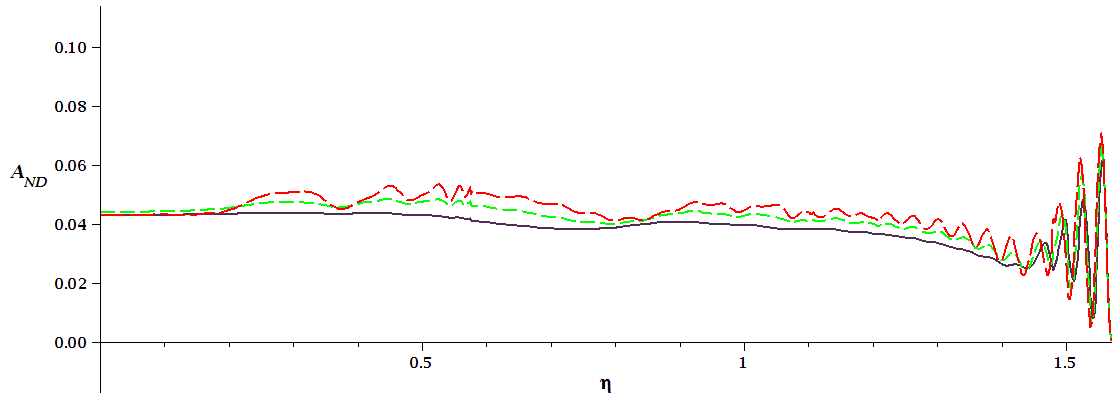
In Fig. 2 we show the relative excess of the night events, (33), as function of the nadir angle and the reconstructed neutrino energy for different values of the energy resolution . The excess increases with energy. Due to attenuation, remote structures are not seen for poor resolution (bottom panel). In particular, the core of the Earth is not noticeable with MeV, and the dependence on is as if the core would be absent. With increase of energy, a small oscillatory effect appears due the core at since the attenuation is determined by the relative resolution (). Details of the dependence for different energies can be seen in Fig. 3. Notice that the core of the Earth is clearly visible for MeV and MeV.
Fig. 4 (red line) shows the distribution integrated over the energy above 11 MeV. This integration is equivalent to an energy resolution function of a box-like form with the average energy 12.5 MeV and energy resolution MeV, i.e., . The corresponding attenuation length equals km. The form of the distribution is rather generic. Different computations (including those for SuperKamiokande) give rather similar pattern which can be understood in the following way.
Because of the linearity of the problem, the integration over the energy and the integration of the evolution equation can be permuted. That is, one can first integrate over energy obtaining the attenuation and then consider the flavor evolution, or first, compute the flavor evolution and then perform the energy integration.
Without density jumps (”no-jump” case) the distribution would have a regular oscillatory pattern with a constant averaged value of determined by the surface density, and the depth of oscillations which decreases with decreasing (the attenuation effects are stronger for longer trajectories). In the realistic case this (regular oscillatory pattern) occurs only for when the neutrino crosses a single outer layer. The period of the oscillatory curve in , , can be estimated from the condition , which gives
For (approaching the core) the period increases. The blue dashed line in Fig. 4 illustrates such a behavior down to below which small perturbations appear due to the core effect.
The jumps break adiabaticity and modify the above picture. The deviations start at , the nadir angle of the neutrino trajectory which touches the surface of the first jump. The length of the trajectory is km, i.e., approximately .
Attenuation leads to hierarchy of these jump effects. The jumps and , closest to a detector, produce the strongest effects (see dotted line in Fig. 4). In turn, jumps and weakly perturb the picture produced by and at (the density change of is too small). Finally, the remote core jumps and modifiy the previous picture at even more weakly. Let us consider these modifications in order.
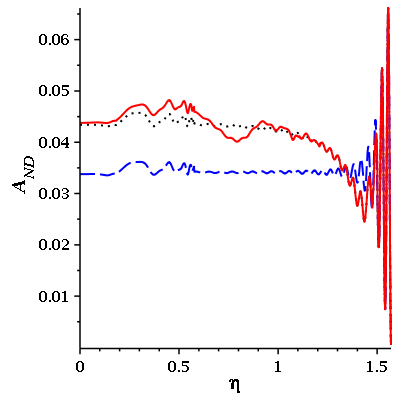
As noticed before, the strongest modifications of the “no-jump” picture is produced by the jumps and at and respectively. They suppress the oscillatory behavior at , produce a dip at , and lead to smooth increase of the excess (above no-jump case) with decrease of . (See dotted line in Fig. 4).
For the length of the trajectory is less than the attenuation length; therefore all jumps should be taken into account. For neutrinos cross three layers and at – five layers of matter. Furthermore, for the effective energy MeV the oscillation length equals 430 km which is comparable to the lengths of sections of the trajectory in the layers. This leads to a parametric suppression of oscillations in addition to averaging: the jumps suppress the third and fourth oscillation maxima in accordance with Fig. 4 (red line). For parametric effects, in general, see paramet , Krastev:1989ix .
To illustrate how it works, let us consider the third maximum of (red line in Fig.4) at . For this the neutrino trajectory crosses three density jumps: , at the surface, , , and , . This corresponds to crossing three layers: the outer layer twice (at the beginning and the end) and the second one in between. The total length of trajectory is , the lengths of the trajectory sections in individual layers equal 238 km, 562 km and 238 km or approximately , and . Therefore the phases acquired from the three jumps to a detector equal , and . Inserting these numbers into the expression for probability (25) we obtain
| (35) | |||||
Here the first term in the parenthesis in the second line is the contribution from the jump . Since and density increases on the way of the neutrinos (), the contribution is negative, thus leading to the positive contribution to the night events excess. The second term, from jump , is positive: now and the density increases (). The third term (from ) is again positive, since and density in this jump decreases, so that . Thus, internal jumps suppress the excess (-regeneration). In other words, the waves “emitted” from the surface jump and the two internal jumps interfere destructively.
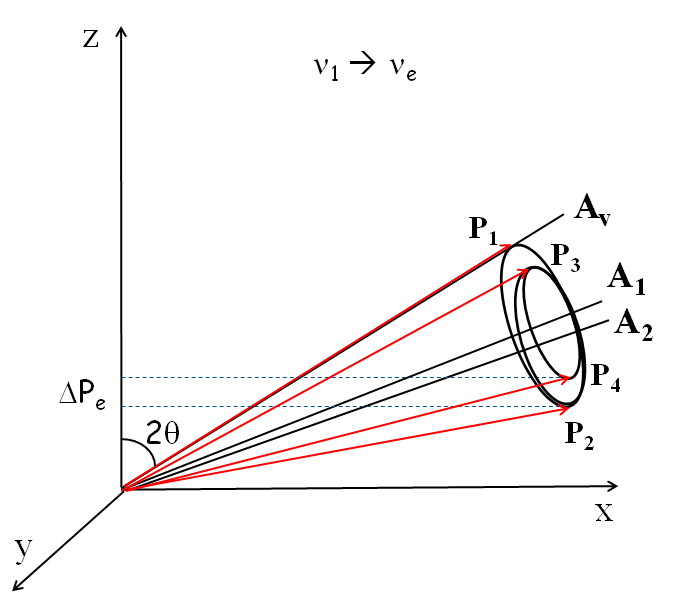
The effect can be visualized by an analogy with the electron spin precession in the magnetic field ms4 , Bouchez:1986kb , Krastev:1989ix . In this representation the neutrino state is described by a ’polarization vector’ in flavor space () (see Fig. 5) whose length is . The probability to find in this state is given by the projection of on the axis (the flavor axis) as . In the layer with a given matter density , precesses around the axis , the direction of eigenstates in this layer. The axis lies in the plane (). The angle between and is twice the flavor mixing angle in matter, . In vacuum, the angle between the axis of eigenstates (mass eigenstates) and is . The angle of precession coincides with the oscillation phase. At the borders between layers the mixing angle in matter, and correspondingly, the direction of the axis of eigenstates sharply change.
According to Fig. 5, upper panel) a neutrino entering the Earth is described by the polarization vector . In the first layer the vector precesses around by half a period. So, at the border with the second layer it reaches the position . In the second layer the precession proceeds around axis (whose direction with respect to axis is determined by the corresponding mixing angle in matter). The neutrino vector precesses here by 1.5 periods and therefore it enters the third layer in the state . Since the layer 3 has the same properties as the first layer neutrino vector precesses there again by half a period around and reaches a detector in the state . (Notice that after crossing each layer the opening angle of precession cone systematically decreases.) In the absence of the internal jumps neutrino would be in position . The projection of difference onto the flavor axis is positive, thus leading to suppression of the night excess.
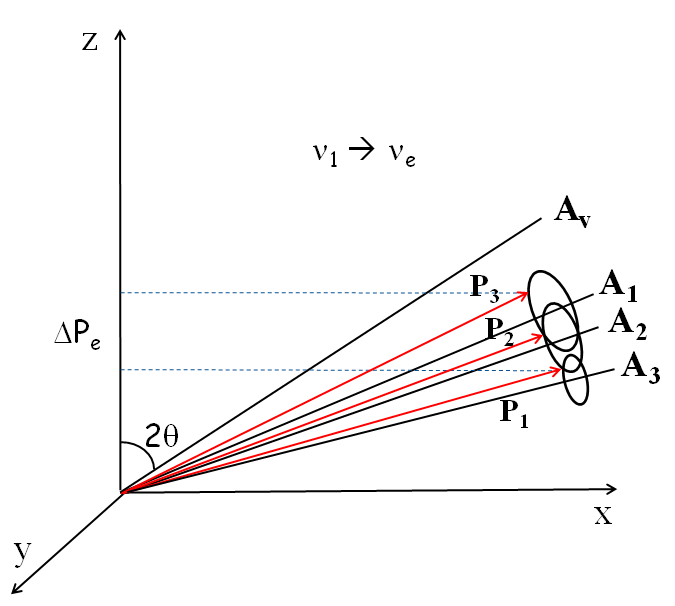
This picture can be modified by local density perturbations near the detector. A variation of the depth of the jumps (distance from the surface) can further modify the dependence leading, e.g., to a parametric enhancement (rather than suppression) of oscillations (see Fig. 6).
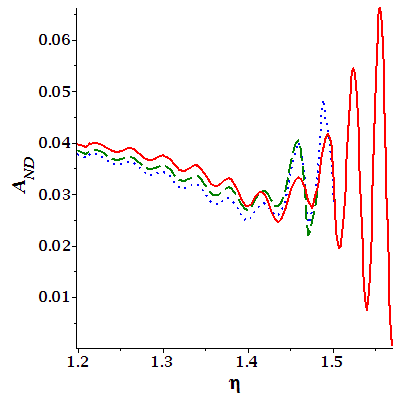
The dip at is the interplay of several factors:
(i) In the region of after entering the Earth neutrinos cross 4 jumps in the following order: , , , . Here “far” and “near” determine position of a jump with respect to a detector. At the length of the trajectory, km, is substantially bigger than the attenuation length. Therefore the remote jumps and (close to the point where neutrinos entered the Earth) are not seen because they are attenuated. Consequently, the effect at a detector is determined by oscillations in the third layer and the jumps closest to a detector and .
(ii) Oscillations in the third layer (between and ) are strongly averaged, so the corresponding oscillation amplitude is effectively small. Thus, the opening angle of the precession cone with respect to axis in Fig. 5b) is small. Furthermore, this angle is smaller than the angle between axes and .
(iii) The length of the trajectory in the outer layers is smaller than (for the length is even smaller than ). In this case and also because of (ii) jumps and with decreasing densities systematically pull the neutrino vector up – to the initial state, i.e. suppressing transition (Fig. 5, bottom panel). After oscillations in the layer 3 around axis the neutrino vector enters the layer 4 in the state . (Because of smallness of radius of precession similar result will be obtained for any position of on the precession cone.) It precesses around () by about 1/4 of the period, from the state to . In the state the neutrino enters the layer 5 and precesses around (which is the same as ) by less than 1/4 of the period. It reaches a detector in the state . The projection of the difference onto the flavor axis is positive implying suppression of the excess.
For the lengths of trajectories in the first two layers become much smaller than the oscillation length () and in the first approximation the oscillation effect in these layers can be neglected. In this case one can consider oscillations in the third layer only with initial density as at the border of this layer, that is, . Propagation in the layer 3 is adiabatic and therefore the average oscillation effect is determined by its surface density. Consequently, the average oscillation effect here will be bigger than the average effect at the surface by factor . This determines the asymptotics of at small :
| (36) |
and . So, for below the dip the averaged excess will increase approaching as compared to at the surface, in agreement with results of computations (Fig. 4).
The pattern produced by and is further perturbed by the deeper jumps and . They cause a modulations of the distribution. The jump has smaller size than , but it is closer to the detector and therefore the two modulations have comparable size. Since is closer than to a detector, its modulations have a larger period than those of for the same range of . For the modulations are in phase leading to significant dip. At larger they are out of phase, reducing the modulations.
The contribution of the core jump , in spite of its large size, is strongly attenuated, resulting in even smaller perturbation on the top of those generated by mantle jumps at .
These qualitative consideration show clearly the sensitive connection between features of the Earth density profile and the distribution.
IV IV Physics reach of DUNE
We will assume detection based on the neutrino - nuclei interactions which have several advantages: (i) they have good neutrino energy resolution/reconstruction; (ii) the cross-section is much larger than the scattering cross-section, (iii) the damping factor due to contribution of and is absent. Correspondingly the asymmetry is enhanced by factor , where is the ratio of neutral to charged current cross-sections of scattering on electrons.
To illustrate the potential of our method, we consider a future DUNE experiment Acciarri:2015uup . At DUNE solar neutrinos are detected by the CC process
| (37) |
Since 40Ar has spin 0 and the ground state of 40K has spin 4, the transition to the ground state is highly suppressed. The transition(s) via intermediate excited states of 40K (Fermi or Gamov-Teller transitions) with further emission of photons are more probable, although the rates of these transitions are not measured yet.
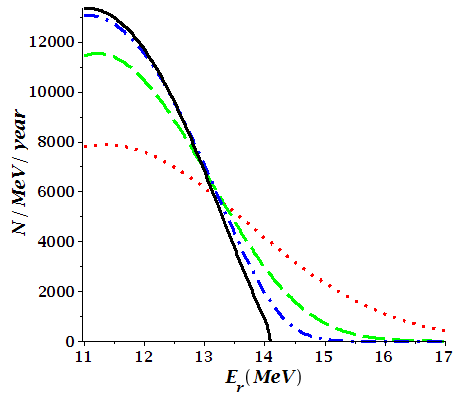
We approximate the cross-section as in (34) with . MeV is the mass difference between the Fermi exited 40K state and 40Ar. We consider neutrinos with energy 11 MeV, since an electron, to be detected, should have energy above 5 MeV (37).
We find that about 27000 events will be detected annually for 11 MeV in a 40 kt liquid argon detector due to the reaction (37). The energy distribution of these events is shown in Fig. 7. Correspondingly, in 5 years 135000 events will be recorded.
With this statistics the following studies can be performed.
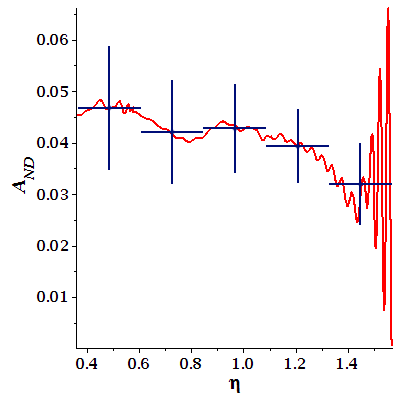
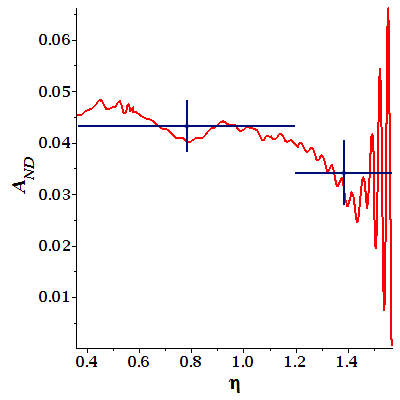

1). The integral relative excess (Day-Night asymmetry) can be measured with high accuracy. After 5 years of data taking statistical error will be . Therefore the average value will be measured with accuracy, and its deviation from zero will be established at more than a level. If eV2, the average excess equals and accuracy of its measurement will be ( from 0).
The background is largely unknown, although it is expected that it will have no day-night variations which could mimic or modify the true Earth matter effect. If the signal to background ratio is , the error bars will be 2 times larger: . Consequently, will be measured with accuracy ( for high values of ).
It is straightforward to scale these results with increase of exposure.
2). Measurements of and search for new physics effects. The difference of between high and low values of is . After 5 year the difference can be established at level. If DUNE will confirm the low (solar) value, whereas JUNO will obtain high (KamLAND) value, this will be further evidence of new physics effects, e.g., non-standard neutrino interactions.
3). Seasonal variations of the flux due to the elliptic orbit of the Earth around the Sun (3.34 % amplitude) will be established at level.
4). The measurement of the nadir angle distribution of the excess integrated over the energy can be performed with accuracy (see Fig. 8, upper panel). Here, the exposure function shown in Fig. 9 is important. However, we expect the detection of various structures of the Earth profile will be difficult. The hope is that at least the main feature – the dip and increase of the excess with decrease of produced by two closest to surface jumps will be established. In Fig. 8 (bottom panel) we divided the entire interval accessible to DUNE into two bins and whose fractions of events are and , respetively. This difference of the numbers of events in the two bins can be established at about level.
5). The dependence on energy can be explored; measuring the -distributions in two,
or even more, energy intervals
seems feasible.
Measuring the hep neutrino flux will be difficult. Annually, about 130 such neutrinos are expected in the energy interval MeV. Very good energy neutrino reconstruction and high statistics are needed to disentangle them from events produced by the boron neutrinos.
The outer core ( ) is ”visible” at the Homestake site at about of night time. However, its observation would also require high energy resolution and high statistics.
Another possible realization of - nuclei detection is the ASDC -THEIA - future advanced scintillation detector concept which uses water based liquid scintillator (WbLS) Alonso:2014fwf . The WbLS can be loaded by metallic ions, in particular 7Li, which will allow to detect the CC process .
V V Conclusion
1. In view of forthcoming and planned solar neutrino experiments with large mass detectors and good energy resolution we performed a detailed study of oscillations of the 8B neutrinos in the matter of the Earth. As a model density profile for the earth, we have taken the so called PREM model Dziewonski:1981xy which approximates the earth by several shells of slowly varying densities. For such a profile we can nicely represent the oscillation amplitude as superposition of the waves emanating from the density jumps between the shells. We have computed the relative excess of the night events (Day-Night asymmetry) as function of the reconstructed neutrino energy and the nadir angle. Also we have computed the nadir angle distribution of events integrated over the energy above 11 MeV.
2. The observable distribution are strongly affected by two major effects: Attenuation (due to the finite energy resolution of detectors) and a parametric suppression (or enhancement) of oscillations in the multi-layer medium (due to the interplay of wave length and thickness of the layers).
3. The density jumps influence the distribution substantially. Due to attenuation which affects more contributions from the far away (from the detector) jumps, there is a hierarchy of perturbations determined by the closeness of jumps to a detector. Therefore in a first approximation, the dependence of the excess is given by the two jumps nearest to the detector.
The -distribution has the following generic properties:
- regular oscillatory pattern for (the longer trajectories) with strongly decreased amplitude due to integration over energy.
- dip at which is due to attenuation of remote jumps and effect of closest jumps where the density decreases when neutrino pass them.
- increase of the relative excess with decreasing below and approaching the constant value determined by the density at the borders of third layer.
- for this first order picture is modulated by smaller effects of two deeper jumps in the mantle.
- for further perturbations of the above picture show up due to the core of the Earth.
4. We computed the relative excess of events and its distribution at DUNE.
After 5 years of data taking DUNE can establish the DN-asymmetry at the level. The low and high values of can be distinguished at level.
The first scanning of the Earth matter profile will be possible: The nadir angle distribution can be measured with accuracy. This will allow to establish the dip in the distribution at level.
Further developments of the experimental techniques
are required to get information about sub-dominant
structures of the distribution produced by inner mantle
jumps and the core.
References
References
- (1) S. P. Mikheyev and A. Yu. Smirnov, Proc. of the 6th Moriond Workshop on massive Neutrinos in Astrophysics and Particle Physics, Tignes, Savoie, France Jan. 1986 (eds. O. Fackler and J. Tran Thanh Van) p. 355 (1986).
- (2) E. D. Carlson, Phys. Rev. D 34 (1986) 1454.
- (3) M. Cribier, W. Hampel, J. Rich and D. Vignaud, Phys. Lett. B 182 (1986) 89.
- (4) J. Bouchez, M. Cribier, J. Rich, M. Spiro, D. Vignaud and W. Hampel, Z. Phys. C 32 (1986) 499.
- (5) S. Hiroi, H. Sakuma, T. Yanagida and M. Yoshimura, Prog. Theor. Phys. 78 (1987) 1428.
- (6) A. J. Baltz and J. Weneser, Phys. Rev. D 35 (1987) 528.
- (7) A. Dar, A. Mann, Y. Melina and D. Zajfman, Phys. Rev. D 35 (1987) 3607.
- (8) S. P. Mikheyev and A. Yu. Smirnov, Proc. of 7th Moriond Workshop on Search for New and Exotic Phenomena, Les Arc, Savoie, France, 1987, edited by O. Fackler and J. Tran Thanh Van (Editions Frontieres, Gif-sur-Yvette, France, 1987) p. 405.
- (9) A. J. Baltz and J. Weneser, Phys. Rev. D 37 (1988) 3364.
- (10) A. Renshaw et al. [Super-Kamiokande Collaboration], Phys. Rev. Lett. 112 (2014) no.9, 091805 [arXiv:1312.5176 [hep-ex]].
- (11) K. Abe et al. [Super-Kamiokande Collaboration], Phys. Rev. D 94, no. 5, 052010 (2016) [arXiv:1606.07538 [hep-ex]].
- (12) Q. R. Ahmad et al. [SNO Collaboration], Phys. Rev. Lett. 89 (2002) 011302 [nucl-ex/0204009].
- (13) B. Aharmim et al. [SNO Collaboration], Phys. Rev. C 72 (2005) 055502 [nucl-ex/0502021].
- (14) M. Maltoni and A. Y. Smirnov, Eur. Phys. J. A 52 (2016) no.4, 87 [arXiv:1507.05287 [hep-ph]].
- (15) A. Gando et al. [KamLAND Collaboration], Phys. Rev. D 83 (2011) 052002 [arXiv:1009.4771 [hep-ex]].
- (16) F. An et al. [JUNO Collaboration], J. Phys. G 43, no. 3, 030401 (2016) [arXiv:1507.05613 [physics.ins-det]].
- (17) A. M. Dziewonski and D. L. Anderson, Phys. Earth Planet. Interiors 25 (1981) 297.
- (18) P. M. Shearer, (2013) Upper Mantle Seismic Discontinuities, in Earth’s Deep Interior: Mineral Physics and Tomography From the Atomic to the Global Scale (eds S.-I. Karato, A. Forte, R. Liebermann, G. Masters and L. Stixrude), American Geophysical Union, Washington, D. C.. doi: 10.1029/GM117p0115.
- (19) N. Petersen, et al., Sharpness of the mantle discontinuities, Geophys. Res. Lett., 20, 859-862,1993.
- (20) L. Bezrukov and V. Sinev, Phys. Part. Nucl. 47 (2016) no.6, 915.
- (21) A. Friedland, C. Lunardini and C. Pena-Garay, Phys. Lett. B 594 (2004) 347 [hep-ph/0402266].
- (22) O. G. Miranda, M. A. Tortola and J. W. F. Valle, JHEP 0610 (2006) 008 [hep-ph/0406280].
- (23) A. N. Ioannisian and A. Y. Smirnov, Phys. Rev. Lett. 93, 241801 (2004) [hep-ph/0404060].
- (24) E. K. Akhmedov, M. A. Tortola and J. W. F. Valle, JHEP 0405 (2004) 057 [hep-ph/0404083].
- (25) A. N. Ioannisian, N. A. Kazarian, A. Y. Smirnov and D. Wyler, Phys. Rev. D 71, 033006 (2005) [hep-ph/0407138].
- (26) A. N. Ioannisian, A. Y. Smirnov and D. Wyler, Phys. Rev. D 92, no. 1, 013014 (2015) [arXiv:1503.02183 [hep-ph]].
- (27) E. K. Akhmedov, M. A. Tortola and J. W. F. Valle, JHEP 0506 (2005) 053 [hep-ph/0502154].
- (28) M. Blennow, T. Ohlsson and H. Snellman, Phys. Rev. D 69, 073006 (2004) [hep-ph/0311098].
- (29) F. P. An et al. [Daya Bay Collaboration], arXiv:1610.04802 [hep-ex].
- (30) P. C. de Holanda, W. Liao and A. Y. Smirnov, Nucl. Phys. B 702 (2004) 307 [hep-ph/0404042].
- (31) J. N. Bahcall, E. Lisi, D. E. Alburger, L. De Braeckeleer, S. J. Freedman and J. Napolitano, Phys. Rev. C 54 (1996) 411 [nucl-th/9601044].
- (32) V. K. Ermilova, V. A. Tsarev and V. A. Chechin, Kr. Soob. Fiz. [Short Notices of the Lebedev Institute] 5, 26 (1986). E. K. Akhmedov, Sov. J. Nucl. Phys. 47 (1988) 301 [Yad. Fiz. 47 (1988) 475].
- (33) P. I. Krastev and A. Y. Smirnov, Phys. Lett. B 226 (1989) 341. Q. Y. Liu, S. P. Mikheyev and A. Y. Smirnov, Phys. Lett. B 440 (1998) 319 doi:10.1016/S0370-2693(98)01102-2 [hep-ph/9803415].
- (34) R. Acciarri et al. [DUNE Collaboration], arXiv:1512.06148 [physics.ins-det].
- (35) J. R. Alonso et al., arXiv:1409.5864 [physics.ins-det].