| Doping anatase TiO2 with group V-b and VI-b transition metal atoms : a hybrid functional first-principles study | |
| Masahiko Matsubara,a,c Rolando Saniz,b Bart Partoens,b and Dirk Lamoen∗a | |
| We investigate the role of transition metal atoms of group V-b (V, Nb, Ta) and VI-b (Cr, Mo, W) as n- or p-type dopants in anatase TiO2 using thermodynamic principles and density functional theory with the Heyd-Scuseria-Ernzerhof HSE06 hybrid functional. The HSE06 functional provides a realistic value for the band gap, which ensures a correct classification of dopants as shallow or deep donors or acceptors. Defect formation energies and thermodynamic transition levels are calculated taking into account the constraints imposed by the stability of TiO2 and the solubility limit of the impurities. Nb, Ta, W and Mo are identified as shallow donors. Although W provides two electrons, Nb and Ta show a considerable lower formation energy, in particular under O-poor conditions. Mo donates in principle one electron, but under specific conditions can turn into a double donor. V impurities are deep donors and Cr shows up as an amphoteric defect, thereby acting as an electron trapping center in n-type TiO2 especially under O-rich conditions. A comparison with the available experimental data yields excellent agreement. |
1 Introduction
TiO2 is an important material in the field of renewable energy applications, and well-known as an efficient photocatalyst used e.g. for the hydrogen production by water splitting.1 In addition, TiO2, more specifically the anatase phase, is suitable for producing novel materials by doping with transition metal (TM) atoms, because of their high solubility in this phase.2 Anatase itself is a wide band gap (3.4 eV3) semiconductor, which is low cost, nontoxic and chemically stable. On doping with group V-b elements Nb4, 5, Ta6 or with W (group VI-b)7 it becomes a good transparent conducting oxide (TCO).
Thus, TM-doped anatase is considered to be one of the promising candidates as an effective TCO to replace the currently most used but expensive indium-tin-oxide in the near future. The novelty of doped anatase is not limited to TCOs. When doped with other TM atoms, it exhibits different properties e.g. when anatase is doped with Co, it becomes a dilute magnetic semiconductor (DMS) showing ferromagnetism at room temperature.8, 9 Furthermore, V-doped anatase is a potential DMS with a giant magnetic moment10 and Cr-doped anatase is also shown to become a DMS with a magnetization of 0.6 /Cr atom.11 Doping with Mo improves the photocatalytic activity of TiO212, 13, 14 and increases the conductivity.15
In this paper we perform a systematic analysis of the dopant characteristics of elements from group V-b (V, Nb, Ta) and group VI-b (Cr, Mo, W) in anatase TiO2 based on thermodynamic principles and density functional theory (DFT). These dopants have been considered before within DFT, often with the generalized gradient approximation (GGA) for the exchange-correlation functional or within the DFT+U method and with a focus on neutral impurities and their electronic properties.16, 17, 18, 19, 20, 21, 22, 23, 24, 25, 26, 27 However, whether an impurity becomes electrically active or rather remains inactive or even behaves amphoteric often depends on the growth conditions (e.g. the presence of native defects) and cannot directly be inferred from a DFT calculation on a neutral defect alone. A more complete picture emerges from a general thermodynamic analysis based on the defect formation energy.28, 29 Such an analysis was applied by Osorio-Guillén et al. on the V-b TM impurities in TiO2 based on a GGA functional together with a correction scheme that accounts for the finite size of the supercell and the underestimation of the GGA band gap17 and for Nb-doped TiO2 a similar approach was followed in refs. 19, 18. In the present work we consider both V-b and VI-b impurities and avoid an a posteriori correction of the band gap by using the Heyd-Scuseria-Ernzerhof (HSE) hybrid functional.30, 31
Our work provides insight into several experimental observations. It shows that Nb, Ta and W are electron donors leading to transparent conducting TiO2 but with different charge carrier concentrations due to the difference in defect formation enthalpy. In contrast, V will not easily donate electrons since the ionization energy is too large. Moreover we demonstrate that, depending on the actual experimental conditions, Cr acts as an amphoteric impurity and that Mo can exist as a single or double electron donor.
The paper is organized as follows. In section 2 we present the computational details for the DFT calculations (subsection 2.1) and the methodology used to calculate the defect formation energies (subsection 2.2). In section 3.1 we present the results on the formation energy of the different TM oxides considered in this work and in section 3.2 we discuss the defect formation energies and the thermodynamic transition levels. Our conclusions are given in section 4.
2 Methods
2.1 Computational details
Our DFT calculations are performed using the projector augmented wave method as implemented in the VASP code32, 33 and are spin polarized for all TM-doped systems. We treat , and states as valence states for Ti, V and Cr. Similarly, , and states are treated as valence states for Nb and Mo, whereas , and states are treated as valence states for Ta and W. Wave functions are expanded with a plane-wave basis set with a cutoff energy of 400 eV. We have used both the Perdew-Burke-Ernzerhof (PBE) functional34 within GGA and the HSE hybrid functional30, 31 for the exchange & correlation energy. More specifically we used the HSE06 functional with a screening parameter of Å-1 and a 25% mixing of Hartree-Fock exchange.
Anatase TiO2 has a tetragonal structure with space group (#141). The lattice constants and and the internal parameter of the anatase unit cell are optimized by both PBE and HSE. A Monkhorst-Pack -point mesh of was used for the Brillouin zone integration. The obtained lattice constants along with the (indirect) band gap value () are shown together with the experimental values35, 3 in Table 1. The calculated lattice constants (both HSE and PBE) are in good agreement with the experimental results, although HSE gives a somewhat better result. The band gap value is severely underestimated (by 1.3 eV) in PBE, whereas HSE significantly improves the result and only slightly overestimates the experimental value by 0.2 eV.
| (Å) | (Å) | (eV) | ||
|---|---|---|---|---|
| PBE | 3.811 | 9.713 | 0.207 | 2.09 |
| HSE | 3.771 | 9.604 | 0.206 | 3.62 |
| Experiment | 3.782 | 9.502 | 0.208 | 3.4 |
Using these optimized lattice constants we construct tetragonal supercells including 108 atoms (36 Ti and 72 O atoms). Replacing one of the Ti atoms by a TM atom results in a dopant concentration of 2.8%. For this supercell a Monkhorst-Pack -point mesh of was used for the Brillouin zone integration. For TM-doped TiO2 the size of the supercell was kept fixed but the atomic positions were relaxed until forces were smaller than eV/Å.
2.2 Formation energies and chemical potentials
The key quantity to determine the concentration, the solubility and the thermodynamic (and optical) transition levels of an impurity X in charge state is the defect formation energy . For an impurity atom X (X = V, Cr, Nb, Ta, Mo or W) replacing a Ti atom it is defined by29, 28:
| (1) | |||||
Here, and are the total energies of the supercell containing the defect X in charge state and of the perfect crystal, respectively. and are the chemical potential of Ti and the impurity X respectively. The defect formation energy depends also on the chemical potential of the electrons (the “Fermi energy”, ) and is conventionally given with respect to the valence band maximum (VBM, ) of the undoped system, where usually ranges from the VBM to the conduction band minimum (CBM, ). The correction aligns the reference potential of the undoped crystal with that of the doped one and is calculated following the procedure introduced in ref. 36. accounts for the electrostatic correction necessary in the case of charged defects28. We use the Madelung potential, as derived by Rurali and Cartoixà for anisotropic systems37, i.e., depending on the dielectric tensor, , of the host material. Specifically, we write , with the generalized Madelung potential given by
| (2) | |||||
The summations of R and G run over the direct and reciprocal lattices, respectively. is a suitably chosen convergence parameter and is the volume of the primitive cell. The above has proven to be an excellent correction scheme for anisotropic systems.37, 38, 39 We use the experimental values for anatase TiO2, , , and , 40 Note that because of the large size of the dielectric tensor components, the electrostatic correction is rather small in the present case.
The chemical potential for Ti, and the impurity X will always be given with respect to the total energy per atom of its bulk metallic phase, e.g. . ***For metallic Ti and X we considered the hexagonal close-packed (space group # 194) and body-centered cubic (space group # 229) structure respectively, with the exception of Cr for which we considered the CsCl structure with an antiferromagnetic ordering. is referenced to the total energy of an O atom in an O2 molecule, . The chemical potentials of O and Ti should satisfy the stable growth condition for TiO2,
| (3) |
denotes the enthalpy of formation for TiO2. Under extreme O-rich conditions, . Under extreme Ti-rich conditions, the growth of Ti2O3 becomes favorable, because the Ti/O ratio in this compound is higher than that in TiO2. As a result, is bounded by the formation of Ti2O3,
| (4) |
where denotes the enthalpy of formation for Ti2O3. The intersection of Eqs. (3) and (4) corresponds to the upper limit of the chemical potentials for stable TiO2 growth, i.e. and . In Table 2 we summarize the PBE and HSE results for the formation enthalpy of TiO2 and Ti2O3, and the values for and both for O-rich and Ti-rich conditions. The enthalpies of formation calculated by HSE are in better agreement with the experimental values41 than those calculated by PBE.
| O-rich | Ti-rich | |||||
|---|---|---|---|---|---|---|
| PBE | 9.19 | 14.58 | 9.19 | 0 | 1.59 | 3.80 |
| HSE | 9.73 | 15.35 | 9.73 | 0 | 1.52 | 4.11 |
| HSE∗ | 9.72 | 15.27 | 9.72 | 0 | 1.38 | 4.17 |
| Exp. | 9.73 | 15.76 | ||||
The solubility limit of impurity X (X = V, Cr, Nb, Ta, Mo or W) is determined by the formation of the corresponding oxides i.e.
| (5) |
Since HSE calculations are computationally very demanding in particular for structural relaxations, we limit ourselves to HSE calculations using the experimental structure (i.e. lattice constants and atomic positions) (listed as HSE∗ in Table 2) for the formation enthalpy of the metal oxides. As an example, we compare in Table 2 a fully relaxed HSE calculation with one based on the experimental structure for TiO2 and Ti2O3. For completeness we also added the (fully relaxed) PBE results. We notice that the fully relaxed and HSE based on the experimental structure agree within 0.5 % and are in good agreement with experiment. The corresponding values for and for both O-rich and Ti-rich conditions are listed in Table 2.
3 Results
3.1 Formation enthalpies & chemical potentials
The defect formation energy defined in Eq. (1) depends on the chemical potential of Ti, O and the TM impurities and Eqs. (3-5) provide the constraints on these chemical potentials. In this section we present the calculated formation enthalpies for the TM oxides and the limiting values for the chemical potentials. For each TM we considered several oxides with different stoichiometry as listed in Table 4. As explained in the previous section we use experimental lattice constants for the total energy calculations. In Table 3 we summarize these constants together with their PBE optimized values for the considered TM oxides. The calculated enthalpies of formation are listed in Table 4 together with the available experimental values. We notice that PBE and HSE calculations with the latter using the experimental structure yield similar results and the calculated values are in good agreement with the experimental ones (with the exception of VO).
| k-points | Space group (#) | Experiment | PBE | |
| VO | (225) | a | ||
| VO2 | (136) | b | ||
| V2O3 | (167) | c | ||
| V2O5 | (59) | d | ||
| V6O13 | (7) | e | ||
| NbO | (221) | a | ||
| NbO2 | (88) | a | ||
| Nb2O5 | (10) | f | ||
| TaO | (225) | a | ||
| Ta2O5 | (191) | g | ||
| CrO2 | (136) | h | ||
| Cr2O3 | (167) | c | ||
| MoO2 | (14) | i | ||
| MoO3 | (62) | j | ||
| WO2 | (14) | k | ||
| WO3 | (2) | l | ||
| a Ref. 42, b Ref.43, c Ref. 43, d Ref. 44, e Ref. 45, f Ref. 46, g Ref. 47, h Ref. 48, i Ref. 49, j Ref. 50, k Ref. 51, l Ref. 52 | ||||
| PBE | HSE | Experiment | |
| VO | 2.91 | 2.95 | 4.48 |
| VO2 | 7.03 | 7.00 | 7.37 |
| V2O3 | 11.25 | 11.04 | 12.63 |
| V2O5 | 16.01 | 16.37 | 16.07 |
| V6O13 | 44.75 | 45.27 | 46.05 |
| NbO | 3.95 | 4.16 | 4.35 |
| NbO2 | 7.41 | 7.71 | 8.24 |
| Nb2O5 | 18.06 | 18.44 | 19.69 |
| TaO | 1.82 | 1.71 | |
| Ta2O5 | 18.26 | 18.94 | 21.20 |
| CrO2 | 5.78 | 5.87 | 6.20 |
| Cr2O3 | 9.97 | 12.09 | 11.76 |
| MoO2 | 5.72 | 5.58 | 6.09 |
| MoO3 | 7.48 | 6.70 | 7.72 |
| WO2 | 5.79 | 5.71 | 6.11 |
| WO3 | 8.67 | 8.21 | 8.74 |
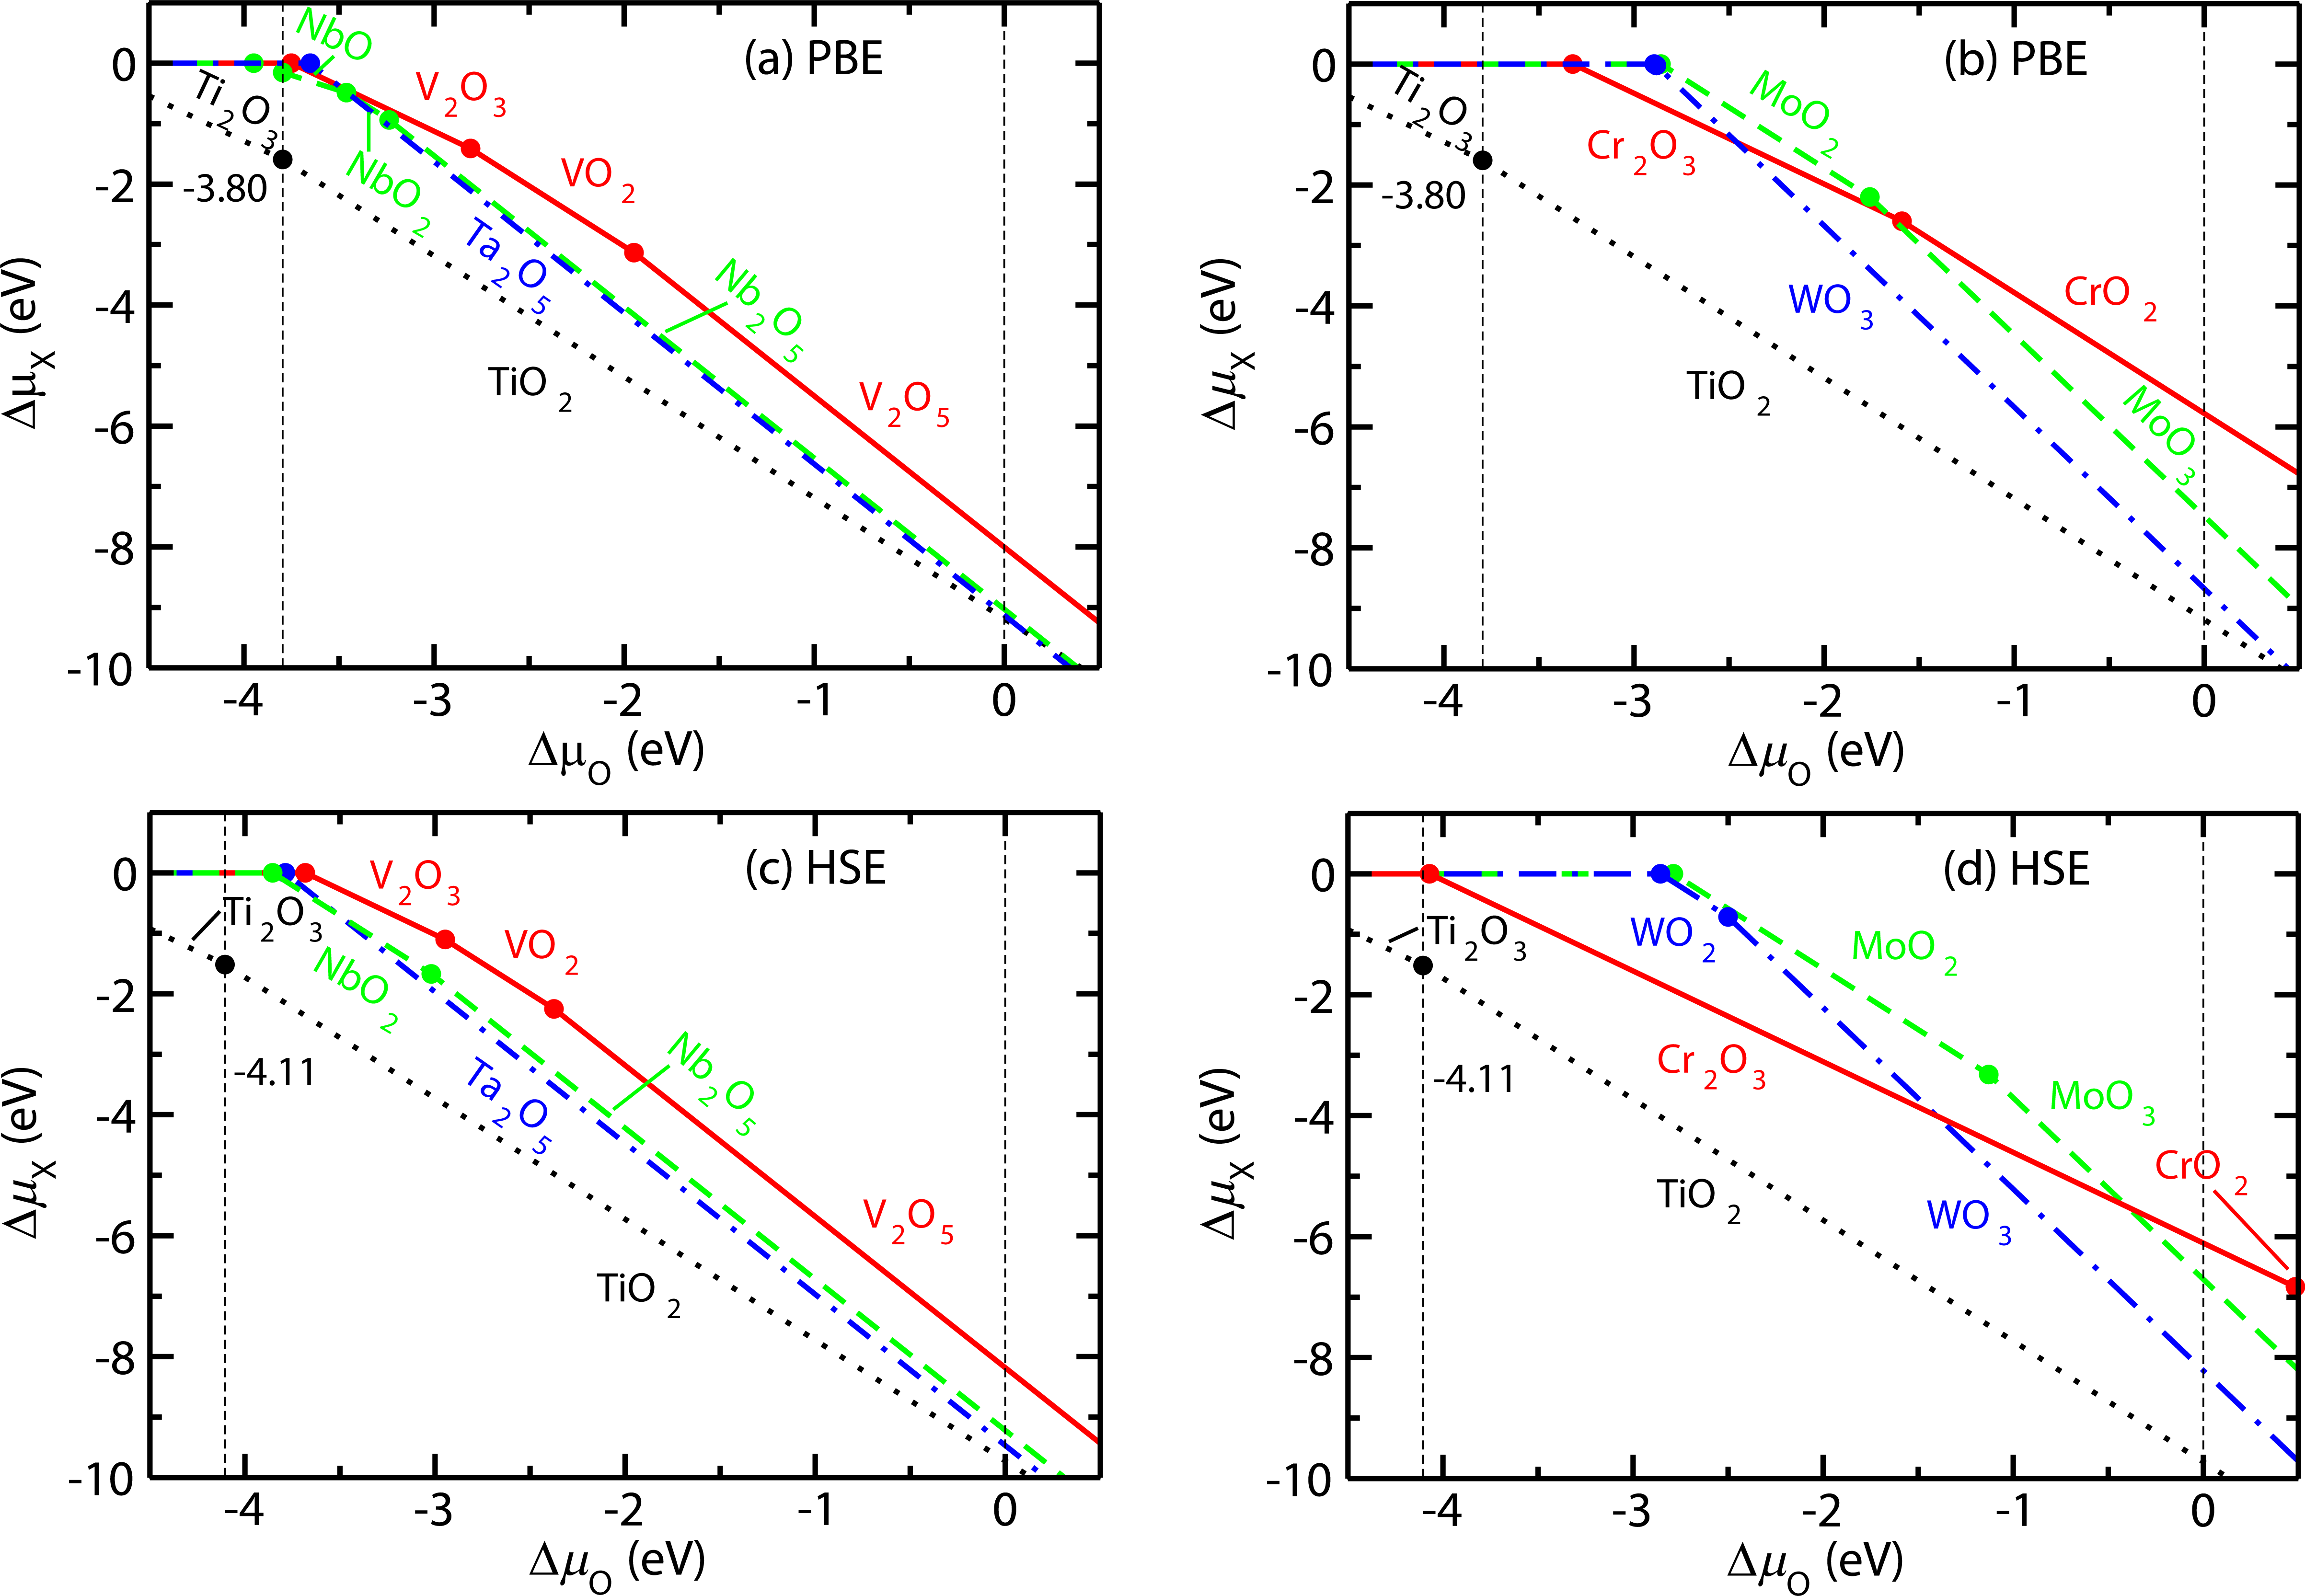
Using these enthalpies of formation for various oxide materials, chemical potentials are computed and plotted in Fig. 1 for (a) group V-b within PBE, (b) group VI-b within PBE, (c) group V-b within HSE and (d) group VI-b within HSE. The chemical potential ranges are determined by (corresponding to O-rich conditions) and eV (PBE) or eV (HSE), corresponding to Ti-rich conditions (i.e. O-poor conditions). In all cases (except Nb), we find that under Ti-rich conditions , i.e. the chemical potential corresponds to that of the elemental solid phase of X (for all X). From Fig. 1 we see that, under oxygen-rich conditions, the chemical potentials for V, Nb and Ta are determined by V2O5, Nb2O5 and Ta2O5, respectively. For group VI-b elements, the chemical potentials for Cr, Mo and W are taken from CrO2, MoO3 and WO3, respectively, for PBE, whereas they are taken from Cr2O3, MoO3 and WO3, respectively, for HSE.
Finally, the values of and used for the formation energy calculation under O-rich and Ti-rich conditions both within PBE and HSE are summarized in Table 5. These results will be used in the next section where we present the formation energies of the different TM impurity atoms.
| PBE | HSE | |||||||
|---|---|---|---|---|---|---|---|---|
| O-rich | Ti-rich | O-rich | Ti-rich | |||||
| X | ||||||||
| V | 8.00 | 0 | 0 | 3.80 | 8.18 | 0 | 0 | 4.11 |
| Nb | 9.03 | 0 | 0.15 | 3.80 | 9.22 | 0 | 0.05 | 4.11 |
| Ta | 9.13 | 0 | 0 | 3.80 | 9.47 | 0 | 0 | 4.11 |
| Cr | 5.78 | 0 | 0 | 3.80 | 5.87 | 0 | 0 | 4.11 |
| Mo | 7.48 | 0 | 0 | 3.80 | 6.70 | 0 | 0 | 4.11 |
| W | 8.67 | 0 | 0 | 3.80 | 8.21 | 0 | 0 | 4.11 |
3.2 Defect formation energies
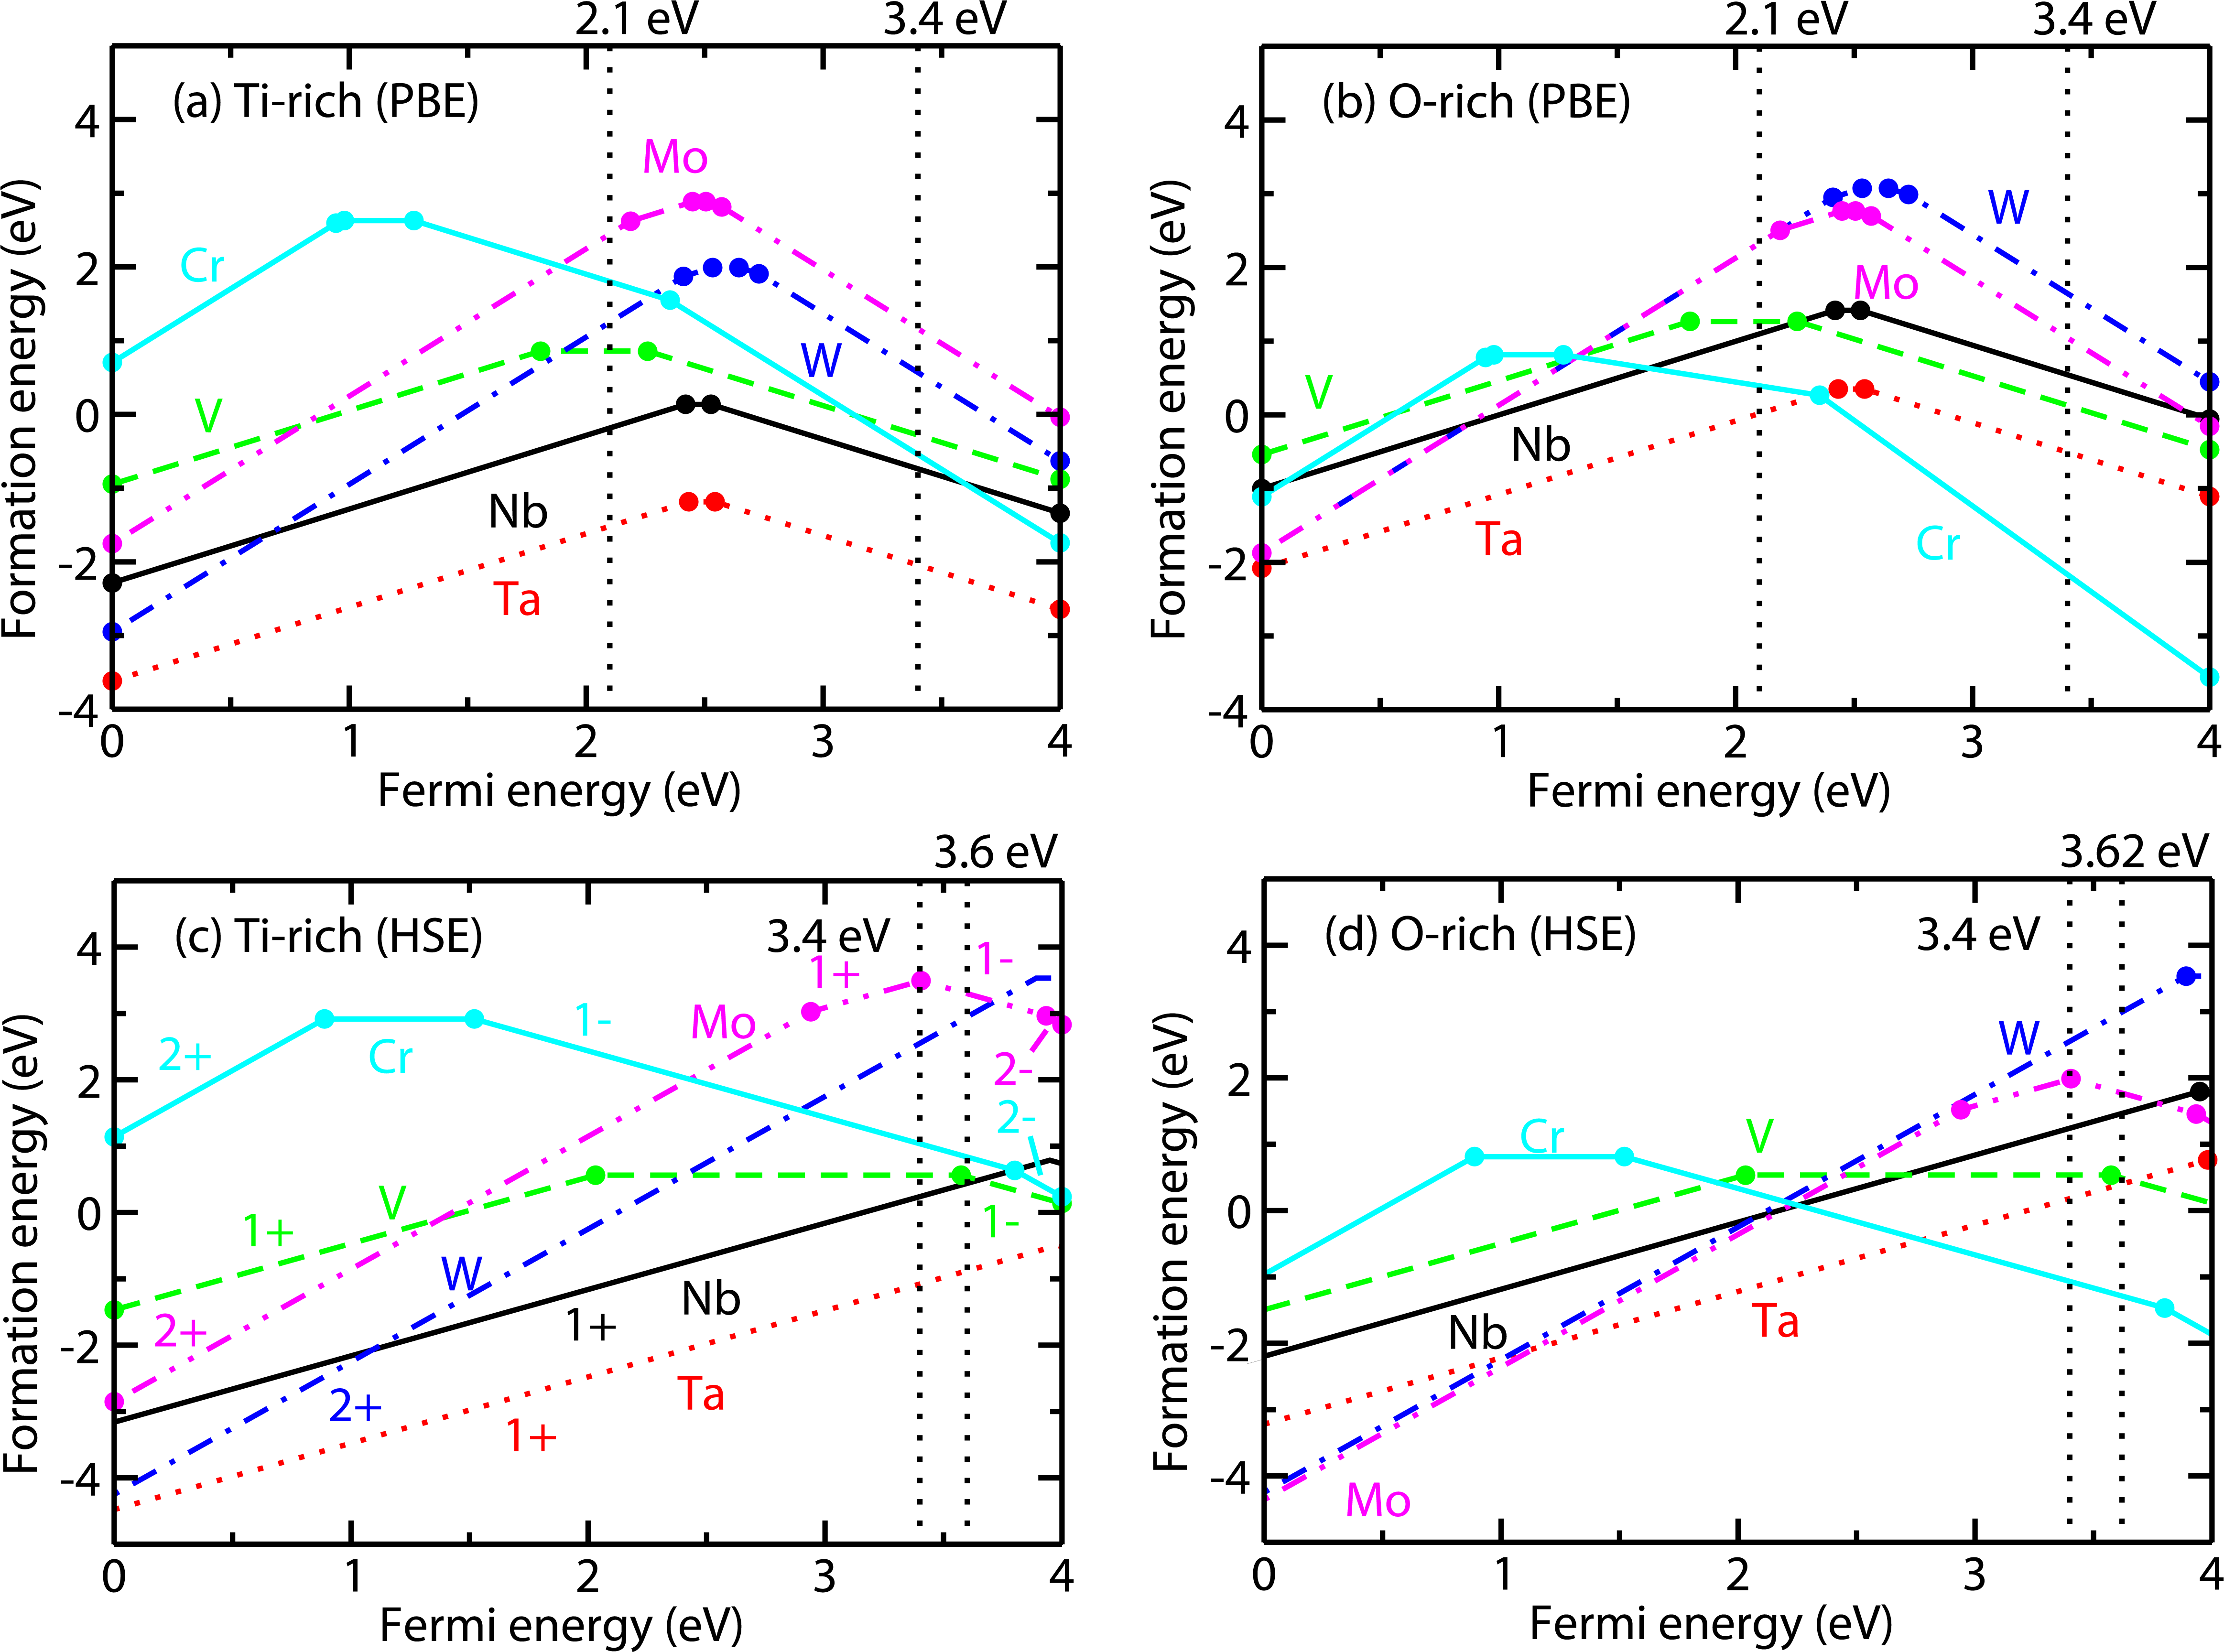
To see whether a dopant can be easily incorporated into TiO2 and act as a potential donor or acceptor of electrons, we have calculated the defect formation energies and the (thermodynamic) transition levels for TiO2:X (X=V, Nb, Ta, Cr, Mo, W) with the HSE functional. The transition level between two charge states and is defined as the Fermi energy at which i.e.
| (6) |
When the Fermi level is below charge state is stable, otherwise charge state is stable †††a charge state refers to a state relative to Ti4+. Shallow donor (acceptor) levels correspond to transition levels that lie within from the CBM (VBM), otherwise they are labelled as deep. The results are shown in Fig. 2. For a given value of the Fermi level only the lowest energy charge state is shown for each dopant.‡‡‡For completeness we have tested the effect of spin-orbit coupling in the case of W using the PBE functional. As can be seen in Fig. 1, only WO3 needs to be considered (oxygen rich conditions). Spin-orbit coupling lowers by 0.7 eV, so the W defect formation energies will rise by the same amount. Note, however that the transition levels do not depend on the chemical potentials.
The HSE results of Fig. 2 show that the transition levels for Nb and Ta are located in the conduction band i.e. for all Fermi level values in the band gap the preferred charge state is , thereby demonstrating the shallow character of the donor impurities both providing one electron to the conduction band.29, 28 A similar result was obtained for TiO2:Nb by Körner and Elsässer within a LDA+SIC approach.18 The result is also in line with the metallic conductivity observed in TiO2:Nb4, 5 and TiO2:Ta6, 53. Moreover a defect level of meV below the CBM has been observed for TiO2:Nb54, which confirms the shallow behavior of the impurity. The formation energy of a charged Ta impurity is lower than that of a Nb one. This results in a higher concentration of the former, thereby favoring a higher conductivity for TiO2:Ta, though the final value for the conductivity will also depend on other factors such as the presence of compensating native defects. A similar result was suggested on the basis of formation energy calculations of neutral impurities.20 In contrast to Nb and Ta, substitutional V acts as a deep donor with the transition level at eV below the HSE CBM (or eV below the experimental CBM). This result is in line with x-ray absorption spectroscopy results55 and EPR measurements56 which show that vanadium is in the charge state "V4+" (i.e. in our notation), which confirms its deep character as an electron donor. We also notice that resonant photoemission experiments on rutile TiO2:V locate an occupied donor level eV below the CBM (where the band gap value was taken as 3.0 eV).57 Our calculations suggest that V demonstrates amphoteric behavior i.e. at Fermi level values close to the HSE CBM it turns into an acceptor with charge state . However, this is more likely to be an artefact resulting from the slight overestimation of the band gap by HSE. The results for Nb, Ta, and V are in line with those of ref. 17: our donor defect level for vanadium is somewhat larger ( versus eV) and our formation energies are in general somewhat smaller.
The values of the chemical potentials appearing in Eq. 1 reflect the influence of the experimental growth conditions. Using the values of Table 5 we consider two limiting cases in Fig. 2, namely, O rich and Ti rich (i.e. O poor). Comparing these conditions shows that Nb- and Ta-doping will be more effective under O-poor conditions i.e. under a reducing deposition atmosphere53, 21, whereas V doping is hardly affected by the experimental growth conditions. For completeness the PBE results are also given in Fig. 2. Although they give qualitatively the same result for the V-b TM atoms (using the PBE band gap), the V dopant turns out to be considerably more shallow than in the HSE case. One also observes that a straightforward use of the PBE transition energies with the experimental band gap does not lead to correct results, as expected, and a correction scheme should be invoked as in ref. 17.
In the case of W doping, the charge state has the lowest formation energy for Fermi energies between the VBM and the CBM, thereby demonstrating its shallow donor character, which is fully in agreement with the experimental observation that W doping drastically decreases the resistivity.25, 58 X-ray photoelectron spectroscopy (XPS) experiments indicate that % of the available W impurities donate two electrons to the TiO2 host system, whereas for the other % the electron remains with the dopant atom.25 However, despite the fact that W provides two rather than one electron, the observed conductivity of TiO2:W is lower than that of TiO2:Nb or TiO2:Ta.58 The considerable higher formation energy of the W state compared to the state of Nb or Ta at Fermi energies close to the CBM (a situation that corresponds to that of an n-doped system) is consistent with these experimental observations, though other factors such as the presence of electron trapping centers due to native defects (e.g. vacancies) can play an important role too.58
For Mo doping the situation is different from that of W. The state is stable for Fermi energies up to an energy of eV below the HSE CBM ( eV below the experimental CBM) from where the becomes stable. The HSE calculations subsequently predict a transition to the charge state at eV below the CBM. This shows that Mo is a so-called "negative U" impurity, where the neutral charge state is never stable and a donor turns into an acceptor depending on the Fermi energy.29, 28 However, due to the overestimation of the band gap by the HSE functional, the negative U behavior is likely to be an artefact. Therefore we consider Mo to be an electron donor, donating one or two electrons to TiO2 depending on the actual value of the Fermi level, which is determined by the overall charge neutrality of the system (i.e. including charged native defects). This result is reminiscent of the experimental situation. An increased conductivity is observed in Mo-doped TiO2 with the Mo impurity occuring in two charge states : 70% of the dopants has a charge state "Mo6+" thereby donating two electrons and 30% has a charge state "Mo5+" thereby donating one electron.15, 14, 12 However, in ref. 59 only Mo5+ was observed. The existence of Mo5+ is often attributed to the presence of O vacancies, which indeed are known to act as shallow donors thereby moving the Fermi level towards the CBM60, where Mo will act as a single electron donor. The VI-b impurity Cr is clearly amphoteric with a stable state for Fermi energies between the VBM and eV and a stable state from eV to , which makes it both a deep donor and a deep acceptor. Since as-grown TiO2 behaves as an n-type semiconductor due to intrinsic defects acting as donor dopants (e.g. oxygen vacancies)61, 60, the actual Fermi level is lying close to the CBM. Our calculations show that for those Fermi energies Cr dopants act as acceptors. This can explain the observed reduction of the conductivity in Cr-doped TiO2.62, 63 In ref. 63 amphoteric behavior is observed in rutile TiO2:Cr with a change in the oxidation state of Cr from Cr3+ to Cr6+ in going from a strongly reducing regime towards a more oxidizing regime. In the former case Cr acts as an acceptor accepting one electron (Cr4+ Cr3+) whereas in the latter case it donates two electrons (Cr4+ Cr6+). Although our calculations focus on anatase TiO2 (not on rutile) and do not consider any concomitant effects from native defects, it is remarkable that our calculations yield the same conclusion. According to Mizushima et al.64 the Cr3+, and thus the acceptor level, is eV below the (rutile) conduction band, which confirms the deep character of the impurity level in TiO2. From Fig. 2 it follows that growth conditions hardly affect the formation energy of W, but O-rich conditions are preferred for both Mo and Cr dopants. For Cr the formation energy drastically decreases under O-rich conditions. A similar effect is observed for the formation energy of Mo, which is higher than that of W under O-poor conditions but which becomes comparable to or is even lower than that of W under O-rich conditions. As a reference we also included the bare PBE results (i.e. without additional band gap corrections) in Fig. 2. For W and Cr PBE yields qualitatively similar results to HSE, but Mo would emerge as a shallow donor providing two electrons per atom. The transition level positions that appear within the (calculated) band gap in for V, Cr and Mo are summarized in Table 6 for both HSE and PBE.
| X | (PBE) | (HSE) | |
|---|---|---|---|
| V | 1.81 | 2.03 | |
| 3.57 | |||
| Cr | 0.89 | ||
| 0.94 | |||
| 0.98 | |||
| 1.27 | 1.52 | ||
| Mo | 2.94 | ||
| 3.40 |
4 Conclusions
In this work we have identified the electronic nature of group V-b (V, Nb, Ta) and group VI-b (Cr, Mo, W) impurities in TiO2 combining thermodynamics and first-principles calculations. The defect formation energy for different charge states of the impurity was calculated taking into account the impurity solubility limit and the stability of TiO2. Since reliable defect formation energies depend on accurate band gap values we used the HSE06 hybrid functional, which has proven to provide realistic defect formation energies for charged impurities. All of the obtained results are in agreement with the experimental observations. Nb, Ta, W and Mo are identified as shallow donors with W providing two electrons but with a considerable higher formation energy than Nb and Ta that each donate one electron. The lowest formation energy of the studied impurities is obtained for Ta. Mo is a shallow donor donating one electron to TiO2 but a slight shift of the Fermi energy towards lower values (e.g. through the presence of compensating acceptors) would turn Mo into a double donor. V acts as a deep donor and Cr is amphoteric acting as a donor or an acceptor depending on the actual value of the Fermi energy and thus will act as an electron trapping center in n-type as-grown TiO2.
5 Acknowledgments
We gratefully acknowledge financial support from the IWT-Vlaanderen through the ISIMADE project, the FWO-Vlaanderen through projects G.0191.08 and G.0150.13, and the BOF-NOI of the University of Antwerp. This work was carried out using the HPC infrastructure of the University of Antwerp (CalcUA) a division of the Flemish Supercomputer Center VSC, which is funded by the Hercules foundation. M. M. acknowledges financial support from the GOA project ”XANES meets ELNES” of the University of Antwerp.
References
- Hashimoto et al. 2005 K. Hashimoto, H. Irie and A. Fujishima, Jpn. J. Appl. Phys., 2005, 44, 8269.
- Gracia et al. 2004 F. Gracia, J. P. Holgado, A. Caballero and A. R. Gonzalez-Elipe, J. Phys. Chem. B, 2004, 108, 17466.
- Tang et al. 1995 H. Tang, F. Lévy, H. Berger and P. E. Schmid, Phys. Rev. B, 1995, 52, 7771.
- Furubayashi et al. 2005 Y. Furubayashi, T. Hitosugi, Y. Yamamoto, K. Inaba, G. Kinoda, Y. Hirose, T. Shimada and T. Hasegawa, Appl. Phys. Lett., 2005, 86, 252101.
- Furubayashi et al. 2006 Y. Furubayashi, T. Hitosugi, Y. Yamamoto, Y. Hirose, G. Kinoda, K. Inaba, T. Shimada and T. Hasegawa, Thin Solid Films, 2006, 496, 157.
- Hitosugi et al. 2005 T. Hitosugi, Y. Furubayashi, A. Ueda, K. Itabashi, K. Inaba, Y. Hirose, G. Kinoda, Y. Yamamoto, T. Shimada and T. Hasegawa, Jpn. J. Appl. Phys., 2005, 44, L1063.
- Sathasivam et al. 2015 S. Sathasivam, D. S. Bhachu, Y. Lu, N. Chadwick, S. A. Althabaiti, A. O. Alyoubi, S. N. Basahel, C. J. Carmalt and I. P. Parkin, Sci. Rep., 2015, 5, 10952.
- Matsumoto et al. 2001 Y. Matsumoto, M. Murakami, T. Shono, T. Hasegawa, T. Fukumura, M. Kawasaki, P. Ahmet, T. Chikyow, S.-y. Koshihara and H. Koinuma, Science, 2001, 291, 854.
- Janisch and Spaldin 2006 R. Janisch and N. A. Spaldin, Phys. Rev. B, 2006, 73, 035201.
- Hong et al. 2004 N. H. Hong, J. Sakai and A. Hassini, Appl. Phys. Lett., 2004, 84, 2602.
- Droubay et al. 2005 T. Droubay, S. M. Heald, V. Shutthanandan, S. Thevuthasan, S. A. Chambers and J. Osterwalder, J. Appl. Phys., 2005, 97, 046103.
- Stengl and Bakardjieva 2010 V. Stengl and S. Bakardjieva, J. Phys. Chem. C, 2010, 114, 19308.
- Khan et al. 2014 M. Khan, J. Xu, W. Cao and Z.-K. Liu, J. Nanosci. Nanotechnol., 2014, 14, 6865.
- Wang et al. 2013 S. Wang, L. N. Bai, H. M. Sun, Q. Jiang and J. S. Lian, Powder Technol., 2013, 244, 9.
- Houng et al. 2013 B. Houng, C. C. Liu and M. T. Hung, Ceram. Int., 2013, 39, 3669.
- Morgan et al. 2009 B. J. Morgan, D. O. Scanlon and G. W. Watson, J. Mater. Chem., 2009, 19, 5175.
- Osorio-Guillén et al. 2008 J. Osorio-Guillén, S. Lany and A. Zunger, Phys. Rev. Lett., 2008, 100, 036601.
- Körner and Elsässer 2011 W. Körner and C. Elsässer, Phys. Rev. B, 2011, 83, 205315.
- Deák et al. 2011 P. Deák, B. Aradi and T. Frauenheim, Phys. Rev. B, 2011, 83, 155207.
- Huy et al. 2012 H. A. Huy, B. Aradi, T. Frauenheim and P. Deák, J. Appl. Phys., 2012, 112, 016103.
- Lee and Robertson 2013 H.-Y. Lee and J. Robertson, J. Appl. Phys., 2013, 113, 213706.
- Çelik and Mete 2012 V. Çelik and E. Mete, Phys. Rev. B, 2012, 86, 205112.
- Long and English 2011 R. Long and N. J. English, Chem. Phys. Lett., 2011, 513, 218.
- Long and English 2011 R. Long and N. J. English, Phys. Rev. B, 2011, 83, 155209.
- Chen et al. 2010 D.-M. Chen, G. Xu, L. Miao, L.-H. Chen, S. Nakao and P. Jin, J. Appl. Phys., 2010, 107, 063707.
- Kamisaka et al. 2009 H. Kamisaka, T. Hitosugi, T. Suenaga, T. Hasegawa and K. Yamashita, J. Chem. Phys., 2009, 131, 034702.
- Pan et al. 2015 J. Pan, C. Li, Y. Zhao, R. Liu, Y. Gong, L. Niu, X. Liu and B. Chi, Chem. Phys. Lett., 2015, 628, 43.
- Freysoldt et al. 2014 C. Freysoldt, B. Grabowski, T. Hickel, J. Neugebauer, G. Kresse, A. Janotti and C. G. Van de Walle, Rev. Mod. Phys., 2014, 86, 253.
- Van de Walle and Neugebauer 2004 C. G. Van de Walle and J. Neugebauer, J. Appl. Phys., 2004, 95, 3851.
- Heyd et al. 2003 J. Heyd, G. E. Scuseria and M. Ernzerhof, J. Chem. Phys., 2003, 118, 8207.
- Heyd et al. 2006 J. Heyd, G. E. Scuseria and M. Ernzerhof, J. Chem. Phys., 2006, 124, 219906.
- Kresse and Furthmüller 1996 G. Kresse and J. Furthmüller, Phys. Rev. B, 1996, 54, 11169.
- Kresse and Joubert 1999 G. Kresse and D. Joubert, Phys. Rev. B, 1999, 59, 1758.
- Perdew et al. 1996 J. P. Perdew, K. Burke and M. Ernzerhof, Phys. Rev. Lett., 1996, 77, 3865.
- Burdett et al. 1987 J. K. Burdett, T. Hughbanks, G. J. Miller, J. W. Richardson Jr. and J. V. Smith, J. Am. Chem. Soc., 1987, 109, 3639.
- Saniz et al. 2013 R. Saniz, Y. Xu, M. Matsubara, M. Amini, H. Dixit, D. Lamoen and B. Partoens, J. Phys. Chem. Solids, 2013, 74, 45.
- Rurali and Cartoixá 2009 R. Rurali and X. Cartoixá, Nano Lett., 2009, 9, 975.
- Kumagai and Oba 2014 Y. Kumagai and F. Oba, Phys. Rev. B, 2014, 89, 195205.
- Petretto and Bruneval 2014 G. Petretto and F. Bruneval, Phys. Rev. Appl., 2014, 1, 024005.
- Gonzalez et al. 1997 R. J. Gonzalez, R. Zallen and H. Berger, Phys. Rev. B, 1997, 55, 7014.
- M. W. Chase 1998 J. M. W. Chase, J. Phys. Chem. Ref. Data Monograph No. 9 NIST. JANAF Thermochemical Tables (1998) 1925., 1998, 9, 1.
- Wyckoff 1963 R. Wyckoff, Crystal Structures, Wiley, 1963.
- Newnham and de Haan 1962 R. E. Newnham and Y. M. de Haan, Z. Kristallogr. - Cryst. Mater., 1962, 117, 235.
- Enjalbert and Galy 1986 R. Enjalbert and J. Galy, Acta Crystallogr., Sect. C, 1986, 42, 1467.
- Höwing et al. 2003 J. Höwing, T. Gustafsson and J. O. Thomas, Acta Crystallogr., Sect. B, 2003, 59, 747.
- Kato 1976 K. Kato, Acta Crystallogr., Sect. B, 1976, 32, 764.
- Terao 1967 N. Terao, Jpn. J. Appl. Phys., 1967, 6, 21.
- Baur and Khan 1971 W. H. Baur and A. A. Khan, Acta Crystallogr., Sect. B, 1971, 27, 2133.
- Brandt and Skapski 1967 B. G. Brandt and A. C. Skapski, Acta Chem. Scand., 1967, 21, 661.
- Sitepu et al. 2005 H. Sitepu, B. H. O’Connor and D. Li, J. Appl. Crystallogr., 2005, 38, 158.
- Jiang and Spence 2004 N. Jiang and J. C. H. Spence, Phys. Rev. B, 2004, 70, 245117.
- Woodward et al. 1995 P. Woodward, A. Sleight and T. Vogt, J. Phys. Chem. Solids, 1995, 56, 1305.
- Mazzolini et al. 2015 P. Mazzolini, P. Gondoni, V. Russo, D. Chrastina, C. S. Casari and A. L. Bassi, J. Phys. Chem. C, 2015, 119, 6988.
- Bae et al. 2012 H. Bae, J.-S. Ha, S. Park, T. Chikyow, J. Chang and D. Oh, J. Vac. Sci. Technol., B, 2012, 30, 050603.
- Rossi et al. 2016 G. Rossi, M. Calizzi, V. D. Cintio, S. Magkos, L. Amidani, L. Pasquini and F. Boscherini, J. Phys. Chem. C, 2016, 120, 7457.
- Tian et al. 2009 B. Tian, C. Li, F. Gu, H. Jiang, Y. Hu and J. Zhang, Chem. Eng. J., 2009, 151, 220.
- Morris and Egdell 2001 D. Morris and R. Egdell, J. Mater. Chem., 2001, 11, 3207.
- Takeuchi et al. 2010 U. Takeuchi, A. Chikamatsu, T. Hitosugi, H. Kumigashira, M. Oshima, Y. Hirose, T. Shimada and T. Hasegawa, J. Appl. Phys., 2010, 107, 023705.
- Mardare et al. 2014 D. Mardare, N. Cornei, D. Luca, M. Dobromir, S. A. Irimiciuc, L. Punga, A. Pui and C. Adomnitei, J. Appl. Phys., 2014, 115, 213501.
- Janotti et al. 2010 A. Janotti, J. B. Varley, P. Rinke, N. Umezawa, G. Kresse and C. G. Van de Walle, Phys. Rev. B, 2010, 81, 085212.
- Diebold 2003 U. Diebold, Surf. Sci. Rep., 2003, 48, 53.
- Herrmann 2012 J.-M. Herrmann, New J. Chem., 2012, 36, 883.
- Nowotny et al. 2016 J. Nowotny, W. Macyk, E. Wachsman and K. A. Rahman, J. Phys. Chem. C, 2016, 120, 3221.
- Mizushima et al. 1979 K. Mizushima, M. Tanaka, A. Asai, S. Iida and J. B. Goodenough, J. Phys. Chem. Solids, 1979, 40, 1129.