Public discourse and news consumption on online social media: A quantitative, cross-platform analysis of the Italian Referendum
Abstract.
The rising attention to the spreading of fake news and unsubstantiated rumors on online social media and the pivotal role played by confirmation bias led researchers to investigate different aspects of the phenomenon. Experimental evidence showed that confirmatory information gets accepted even if containing deliberately false claims while dissenting information is mainly ignored or might even increase group polarization. It seems reasonable that, to address misinformation problem properly, we have to understand the main determinants behind content consumption and the emergence of narratives on online social media. In this paper we address such a challenge by focusing on the discussion around the Italian Constitutional Referendum by conducting a quantitative, cross-platform analysis on both Facebook public pages and Twitter accounts. We observe the spontaneous emergence of well-separated communities on both platforms. Such a segregation is completely spontaneous, since no categorization of contents was performed a priori. By exploring the dynamics behind the discussion, we find that users tend to restrict their attention to a specific set of Facebook pages/Twitter accounts. Finally, taking advantage of automatic topic extraction and sentiment analysis techniques, we are able to identify the most controversial topics inside and across both platforms. We measure the distance between how a certain topic is presented in the posts/tweets and the related emotional response of users. Our results provide interesting insights for the understanding of the evolution of the core narratives behind different echo chambers and for the early detection of massive viral phenomena around false claims.
1. Introduction
Social media have radically changed the paradigm of news consumption and their impact on the information spreading and diffusion has been largely addressed (Asur and Huberman, 2010; Becker et al., 2010; Ju et al., 2014; Hermida, 2010; Castillo et al., 2014). In particular, several studies focused on the prediction of social dynamics (Asur and Huberman, 2010; Becker et al., 2010), with a special emphasis on information flows patterns (Leskovec, 2011) and on the emergence of specific community structures (Grabowicz et al., 2012; Papadopoulos et al., 2012). Indeed, social media are always more involved in both the distribution and consumption of news (Olteanu et al., 2015). According to a recent report (Newman et al., 2015), approximately 63% of users access news directly from social media, and such information undergoes the same popularity dynamics as other forms of online contents, such as selfies or kitty pictures. In such a disintermediated environment, where users actively participate to contents production and information is no longer mediated by journalists or experts, communication strategies have changed, both in the way in which messages are framed and are shared across the social networks. The general public drifts into dealing with a huge amount of information, but the quality may be poor. Social media do represent a great tool to inform, engage and mobilize people easily and rapidly. However, it also has the power to misinform, manipulate or control public opinion. Since 2013, the World Economic Forum (WEF) has been listing massive digital misinformation at the core of technological and geopolitical risks to our society, along with terrorism and cyber attacks (Howell, 2013). Indeed, online disintermediation elicits users’ tendency to select information that adheres (and reinforces) their pre-existing beliefs, the so-called confirmation bias. In such a way, users tend to form groups of like-minded people where they polarize their opinion, i.e., echo chambers (Del Vicario et al., 2016a; Quattrociocchi et al., 2016; Bessi et al., 2015b; Zollo et al., 2015a). Confirmation bias plays a pivotal role in informational cascades. Experimental evidence shows that confirmatory information gets accepted even if containing deliberately false claims (Bessi et al., 2015a; Bessi et al., 2015b), while dissenting information is mainly ignored (Zollo et al., 2015a). Moreover, debating with like-minded people has been shown to influence users’ emotions negatively and may even increase group polarization (Sunstein, 2002; Zollo et al., 2015b). Therefore, current approaches such as debunking efforts or algorithmic-driven solutions based on the reputation of the source seem to be ineffective to contrast misinformation spreading (Qazvinian et al., 2011).
The rising attention to the spreading of fake news and unsubstantiated rumors on online social media led researchers to investigate different aspects of the phenomenon, from the characterization of conversation threads (Backstrom et al., 2013), to the detection of bursty topics on microblogging platforms (Diao et al., 2012), to the mechanics of diffusion across different topics (Romero et al., 2011). Misinformation spreading also motivated major corporations such as Google and Facebook to provide solutions to the problem (Jenni Sargent, 2017). Users’ polarization is a dominating aspect of online discussions (Adamic and Glance, 2005; Ugander et al., 2012). Furthermore, it has been shown that on Facebook users tend to confine their attention on a limited set of pages, thus determining a sharp community structure among news outlets (Schmidt et al., 2017), and a similar pattern was also observed around the Brexit debate (Del Vicario et al., 2016b). Therefore, it seems reasonable that, to address misinformation problem properly, we have to understand the main determinants behind content consumption and the emergence of narratives on online social media. In this paper we address such a challenge by focusing on the discussion around the Italian Constitutional Referendum by conducting a quantitative, cross-platform analysis on both Facebook public pages and Twitter accounts. First, we characterize the structural properties of the discussion by modeling users’ interactions by means of a bipartite network where nodes are Facebook pages (respectively, Twitter accounts) and connections among pages (respectively, accounts) are the direct result of users’ activity. By comparing the results of different community detection algorithms, we are able to determine the existence of well-separeted communities on both platforms. Notice that such a segregation is completely spontaneous, since we did not perform any categorization of contents a priori. Then, we explore the dynamics behind the discussion by looking at the activity of the users within the most active communities, finding that users tend to restrict their attention to a specific set of pages/accounts. Finally, taking advantage of automatic topic extraction and sentiment analysis techniques, we are able to identify the most controversial topics inside and across both platforms. We measure the distance between how a certain topic is presented in the posts/tweets and the related emotional response of users. Summarizing, the novel contribution of this paper is double:
-
(1)
First, we provide a comparative, quantitative analysis of the way in which news and information get consumed on two very different and popular platforms, Facebook and Twitter;
-
(2)
Second, we provide automatic tools to detect the popularity of narratives online and their related polarization effects.
Such an approach may provide important insights for the understanding of the evolution of the core narratives behind different echo chambers and for the early detection of massive viral phenomena around false claims.
2. Dataset
Facebook and Twitter are two of the most popular online social media where people can access and consume news and information. However, their nature is different: Twitter is an information network, while Facebook is still a social network, despite its evolution into a ”personalized portal to the online world” 111http://www.slate.com/articles/technology/technology/2016/04/facebook_isn_t_the_social_network_anymore_so_what_is_it.html. Such a difference highlights the importance of studying, analyzing, and comparing users’ consumption patterns inside and between both platforms.
2.1. Facebook
Following the exhaustive list provided by Accertamenti Diffusione Stampa (ADS) (ADS, 2016), we identified a set of Italian news sources and their respective Facebook pages. For each page, we downloaded all the posts from July 31st to December 12th, 2016, as well as all the related likes and comments. Then we filtered out posts about the Italian Constitutional Referendum (hold on December, 4th) by keeping those containing at least two words in the set {Referendum, Riforma, Costituzionale} in their textual content i.e., their description on Facebook or the URL content they pointed to. The exact breakdown of the dataset is provided in Table 1. Data collection was carried out using the Facebook Graph API (Facebook, 2013), which is publicly available. For the analysis (according to the specification settings of the API) we only used publicly available data (thus users with privacy restrictions are not included in the dataset). The pages from which we downloaded data are public Facebook entities and can be accessed by anyone. Users’ content contributing to such pages is also public unless users’ privacy settings specify otherwise, and in that case it is not available to us.
| Pages/Accounts | 57 | 50 |
|---|---|---|
| Posts/Tweets | 6015 | 5483 |
| Likes/Favorites | 2034037 | 57567 |
| Retweets | - | 55699 |
| Comments | 719480 | 30079 |
| Users | 671875 | 29743 |
| Likers/Favoriters | 568987 | 16438 |
| Retweeters | - | 14189 |
| Commenters | 200459 | 8099 |
2.2. Twitter
Data collection on Twitter followed the same pipeline adopted for Facebook. First, we identified the official accounts of all the news sources reported in (ADS, 2016). Then, we gathered all the tweets posted by such accounts from July 31st to December 12th, 2016 through the Twitter Search API. Starting from that set, we selected only tweets pointing to news related to the Referendum debate. Specifically, we considered only the statutes222Status and tweet are synonyms. whose URL was present in the Facebook dataset. The resulting set of valid tweets consists of about 5,400 elements. To make the available information comparable to Facebook, from each tweet we collected information about the users who ”favored” (left a favorite), retweeted or replied. Specifically, favorites and retweets express an interest in the content as Facebook likes do, while replies are similar to comments. To obtain such information we bypassed the Twitter API, since it does not return favorites or retweets. In particular, we scraped the tweet page and extracted the users who liked or retweeted the status, and the retweet/favorite counts. Although we are able to identify the users acting on a tweet, the information is partially incomplete since the tweet page shows at most 25 users who retweet or favor (retweeters or ”favoriters”). However, such a restriction has a limited impact on the set of valid tweets. Indeed, our retweeters’ and favoriters’ sets capture the entire set of users acting on tweets for about of statuses. As for the replies to a tweet, we were able to collect every user who commented on a tweet reporting a news about the Referendum and the reply tweet she wrote. The tweet page reports the entire discussion about the target tweet, including the replies to replies and so on. Here we limited our collection to the first level replies –i.e., direct replies to the news source tweet– since the target of the comment is identifiable, i.e. the news linked to the tweet333For deeper levels the target could be the parent reply or the target tweet..
The breakdown of the Twitter dataset is reported in Table1. The ratio between Facebook and Twitter volumes mirrors the current social media usage in the Italian online media scene. Indeed, news sources and newspapers exploit both media channels to spread their contents, as denoted by the similar number of posts. Nevertheless, activities on the posts are skewed towards Facebook, since in Italy its active users are 4/5-fold those of Twitter 444http://vincos.it/2016/04/01/social-media-in-italia-analisi-dei-flussi-di-utilizzo-del-2015/. Our collection methodology and the high comparability between the two datasets provide a unique opportunity to investigate news consumption inside and between two different and important social media.
3. Methods
Interactions between Facebook pages/Twitter accounts and users can be modeled by a bipartite network , where and are disjoint sets of vertices representing news sources accounts and users, respectively. When a user interacts with a post/tweet published by the news source , we draw a link . To each link we assign a weight denoting how many times has interacted with the posts published by the page . Since we distinguish between comments/replies and likes/favorites-retweets, we have different types of weight corresponding to different kinds of interaction.
Starting from the bipartite network representation, we are then able to extract groups of news sources which are perceived as similar by social media users.
3.1. Bipartite Network Projections
When limiting to a specific topic –i.e., the constitutional Referendum– a single user interacting with different news sources can be interpreted as a signal of closeness or similarity between the pages, especially when interactions are likes, favorites or retweets. To this aim, we apply three different projections of the bipartite network of pages and users on the pages set, where in turn we assign a different weight to the inter-pages links, assessing diverse similarity scores:
-
•
Simple Edge Counting: The weight of each link is given by the number of common users between two pages, in terms of either likes (Facebook) or favorites and retweets (Twitter);
-
•
Jaccard Similarity: Given two pages and , and their respective sets of users and , the weight of their link is given by the Jaccard similarity coefficient of the two pages ;
-
•
User Activity Jaccard Similarity : We also consider a modification of the Jaccard Similarity by taking into account the weight of the page-user links. Let be the set of common users between pages and , whose cardinality is , the set of all users, and that of all pages, the page relative users weight is equal to:
The User Activity Jaccard Similarity coefficient is given by the product .
3.2. Community detection algorithms
Given the above projections, we are able to identify groups of newspapers which are perceived similar by the social media users. The identification of the groups turns into the well-known community detection problem. For this task, we choose algorithms representative of different approaches on community detection, ranging from optimizing the modularity function, to dynamical processes such as diffusion or random walks.
-
•
Fast Greedy (Clauset et al., 2004): The algorithm is based on the maximization of the Newman and Girvan’s modularity, a quality function which measures the goodness of a graph clustering w.r.t. its random counterpart with the same expected degree sequence. The algorithm starts from a set of isolated nodes and, at each step, continues to add links from the original graph to produce the largest modularity increase.
-
•
Louvain (Blondel et al., 2008): The Louvain method was introduced by Blondel et al. and is one of the most popular greedy algorithms for modularity optimization. The method is very fast and can produce very high quality communities. The algorithm is iterative. Each iteration consists of two steps. In the first one, every node is initially set to a new community. Then, for every node and its neighbors , the algorithm calculates the gain in modularity moving from its community to ’s community. The node is then moved to the community with maximum gain. The second step is to group all the nodes in the same community into a macro node. A new graph, in which macro nodes are linked by an edge if there’s an edge between two nodes belonging to the two macro nodes, is built and a new iteration starts.
-
•
Label propagation (Raghavan et al., 2007): The algorithm provides each node to determine its community by choosing the most frequent label shared by its neighbors. Initially every node belongs to a different community. After some iterations, groups of nodes quickly reach a consensus on their label and they begin to contend those nodes that lay between groups.
-
•
Walk Trap (Pons and Latapy, 2006): The algorithm is based on the tendency of random walks to be trapped into the densely connected regions of the graph, i.e. communities. Specifically, a random walk of length induces a distance between two vertices depending on the probability the random walker has to go from a vertex to the other in steps. The distance can be used in a hierarchical clustering algorithm to obtain a hierarchical community structure.
-
•
Infomap (Rosvall et al., 2009): Infomap turns the community detection problem into the problem of optimally compressing the information of a random walk taking place on the graph. The algorithm achieves the optimal compression by optimizing the minimum description length of the random walk.
To compare the partitions returned by the different algorithms, we use standard techniques that compute the similarity between different clustering methods by considering how nodes are assigned by each community detection algorithm (Rand, 1971; Hubert and Arabie, 1985). Specifically, we adopted the Rand Index (Rand, 1971), based on the relationships between pairs of vertices in both partitions, and the Normalized Mutual Information (NMI) (Danon et al., 2005), measuring the statistical dependence between the partitions. In both cases a value close to 1 indicates that the partitions are almost identical, whereas independent partitions lead the scores to 0.
4. Results
4.1. Communities and Users Polarization
Online social media facilitate the aggregation of individuals in communities of interest, also known as echo chambers (Quattrociocchi et al., 2016; Zollo et al., 2015a), especially when considering users interaction around conflicting and contrasting narratives (Del Vicario et al., 2016a). In this manuscript we do not perform any categorization of contents a priori. On the contrary, we only account for the connections created by users activities, and then observe the resulting, emerging communities.
We compare the results of the different community detection algorithms on all three bipartite projections, for the case of both Facebook and Twitter. Our analysis focuses on the the bipartite networks built around likes and favorites/retweets, since a) these activities represent more explicit positive feedbacks than comments or replies; b) the average Rand Index is greater for all the projections in both social media w.r.t. the bipartite networks built on comments; and c) in Twitter we lose fewer news sources accounts by applying the projections on the favorite bipartite network w.r.t. the comment one.
To compare each projection of the like/favorite bipartite networks we compute the average Rand Index and NMI among the partitions returned by the algorithms. For the case of both Facebook and Twitter the User Activity Jaccard Similarity obtains a better degree of concordance among the algorithms w.r.t. the simple edge counting projection. For instance, in Twitter the User Activity Jaccard Similarity gets and as average Rand index and NMI, while the simple edge counting gets and , indicating a low concordance among the algorithms. Jaccard similarity performs even better (Rand = and NMI=), however we choose the User Activity Jaccard Similarity since it accounts for the users’ activity frequency and how they allocate their interactions among the pages they like. Similar results hold for the Facebook bipartite network, i.e., the User Activity Jaccard Similarity obtains and as Rand index and NMI, respectively. Finally, having fixed the bipartite network and its projection, we evaluate the concordance of each algorithm with the other ones. In Facebook the Louvain algorithm obtains the best average accordance (average Rand= and NMI=), while in Twitter the algorithms based on dynamical processes get the best scores. The latter result is due to a high intra-approaches concordance and low inter-approaches scores, so that the biggest class drives the final score. To maintain a common setting between Facebook and Twitter, in the remaining of the paper we will consider and compare the communities extracted by the Louvain algorithm from the likes/favorites bipartite networks projected by the User Activity Jaccard Similarity .
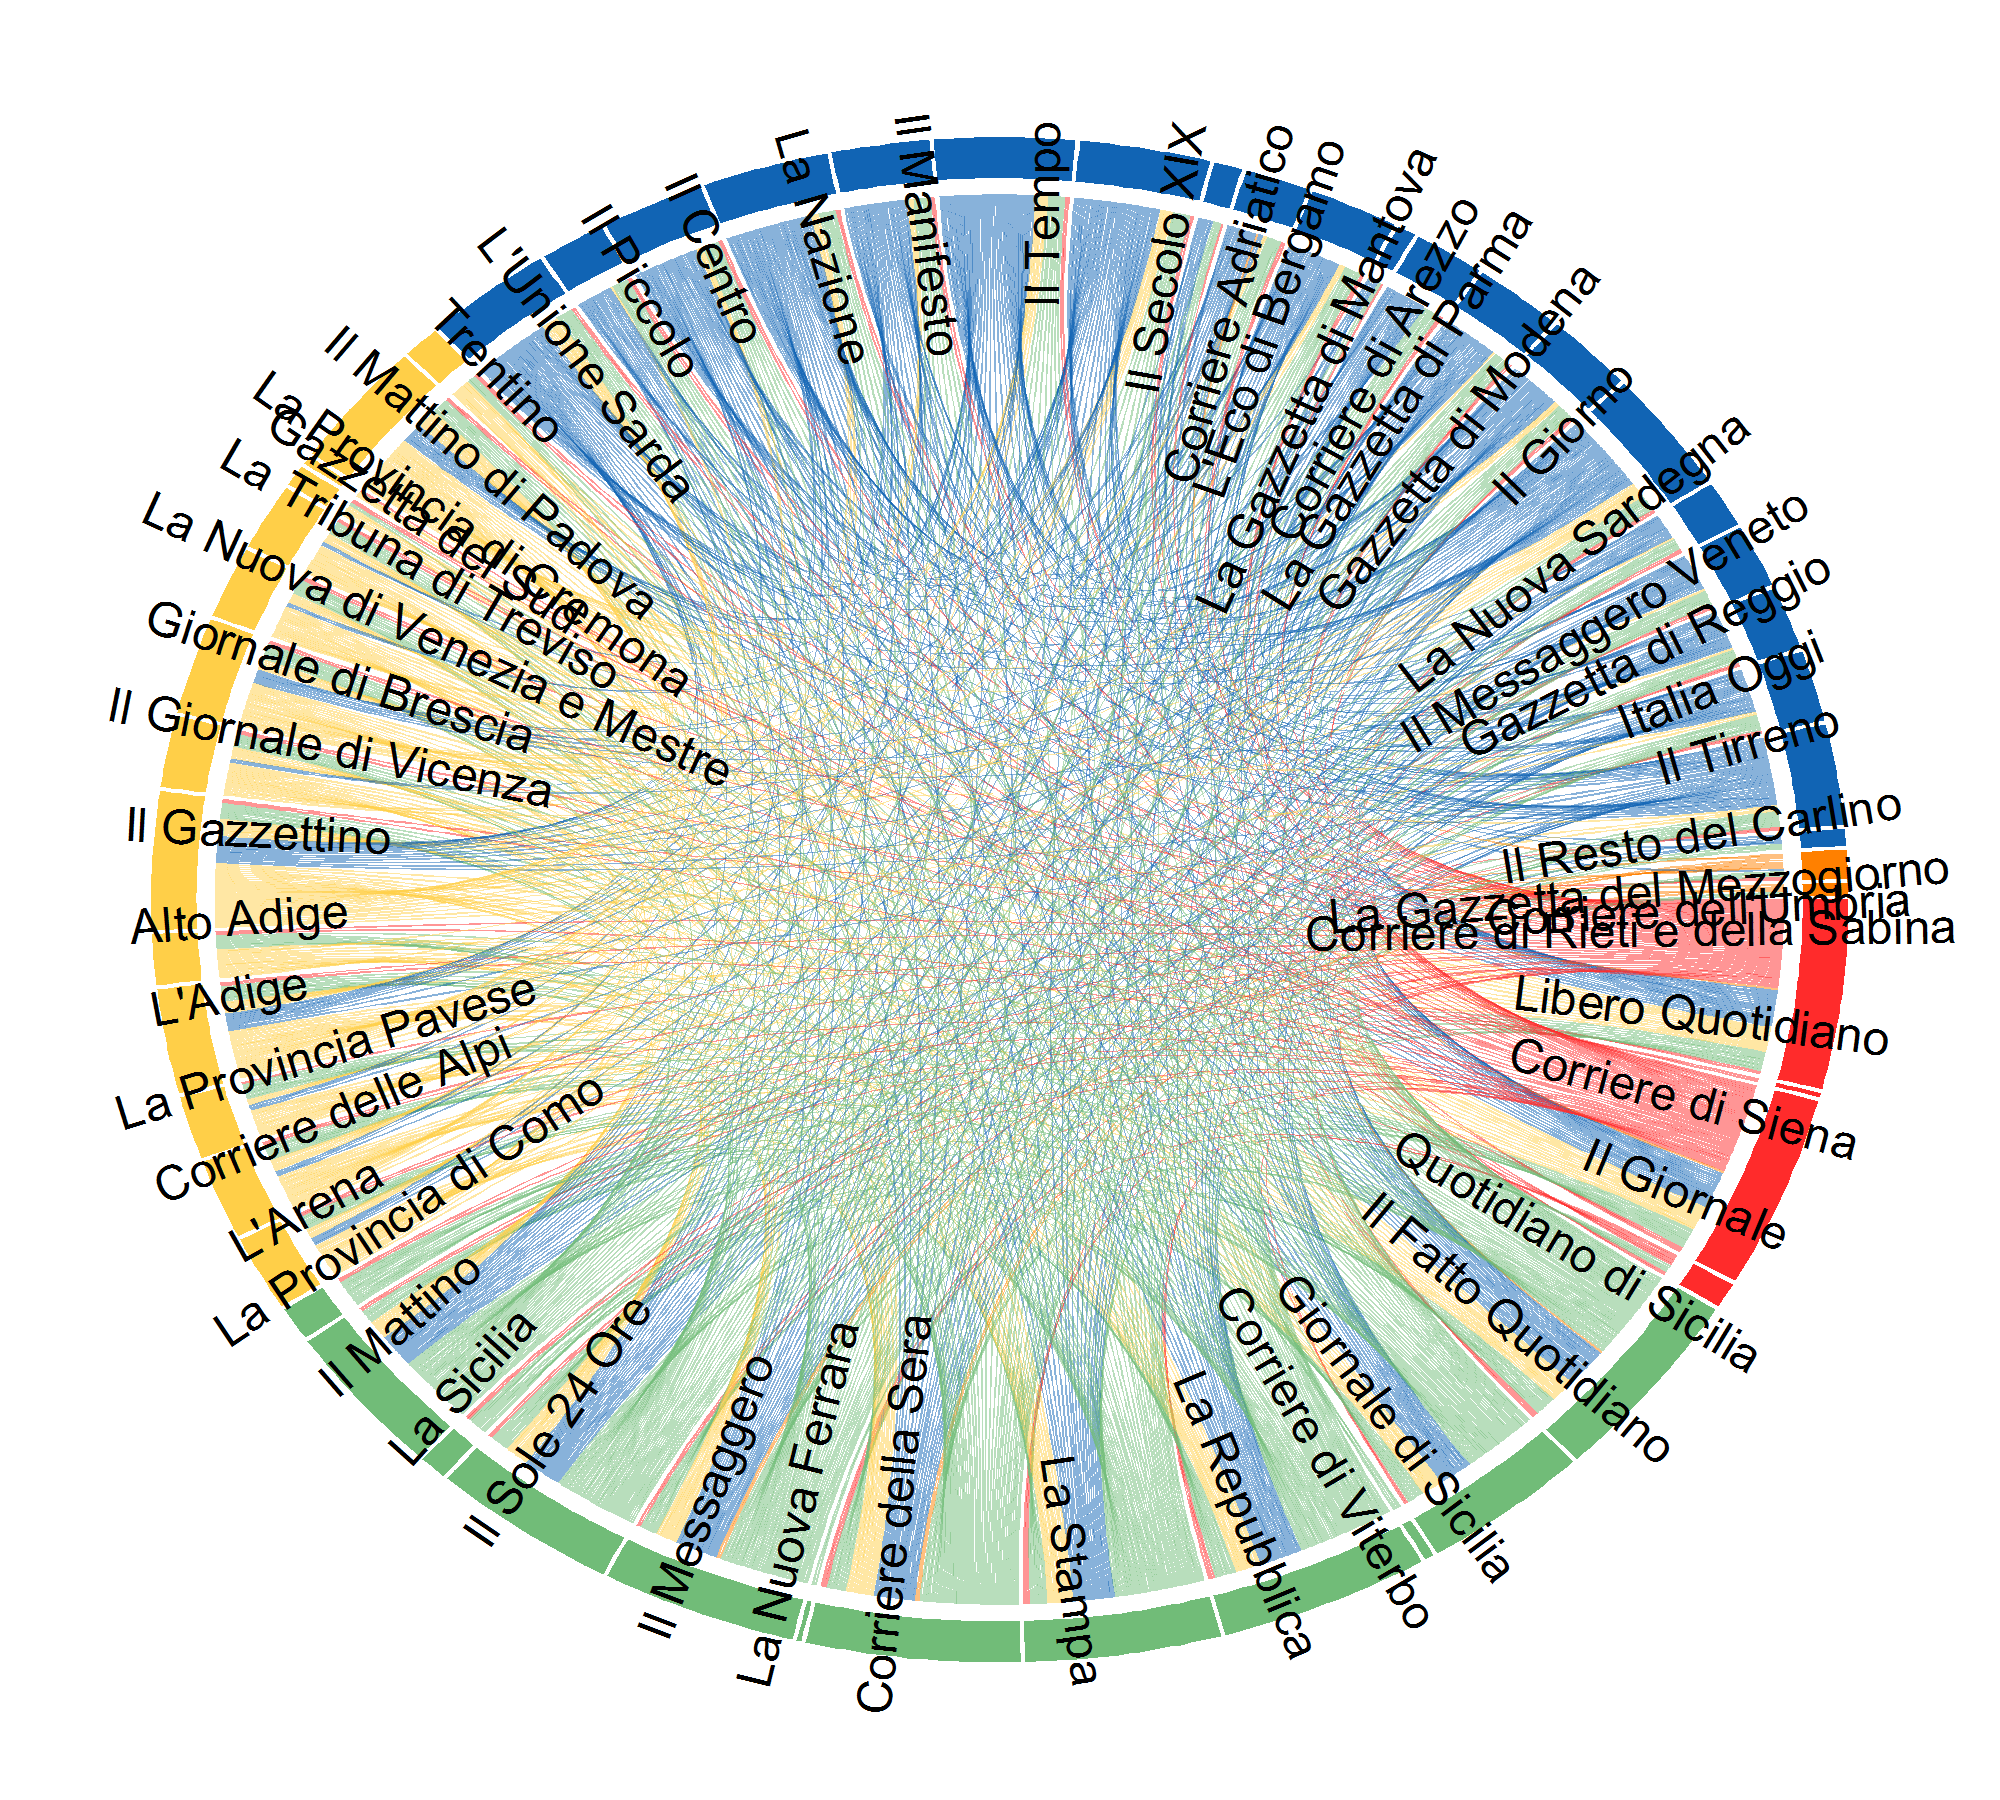
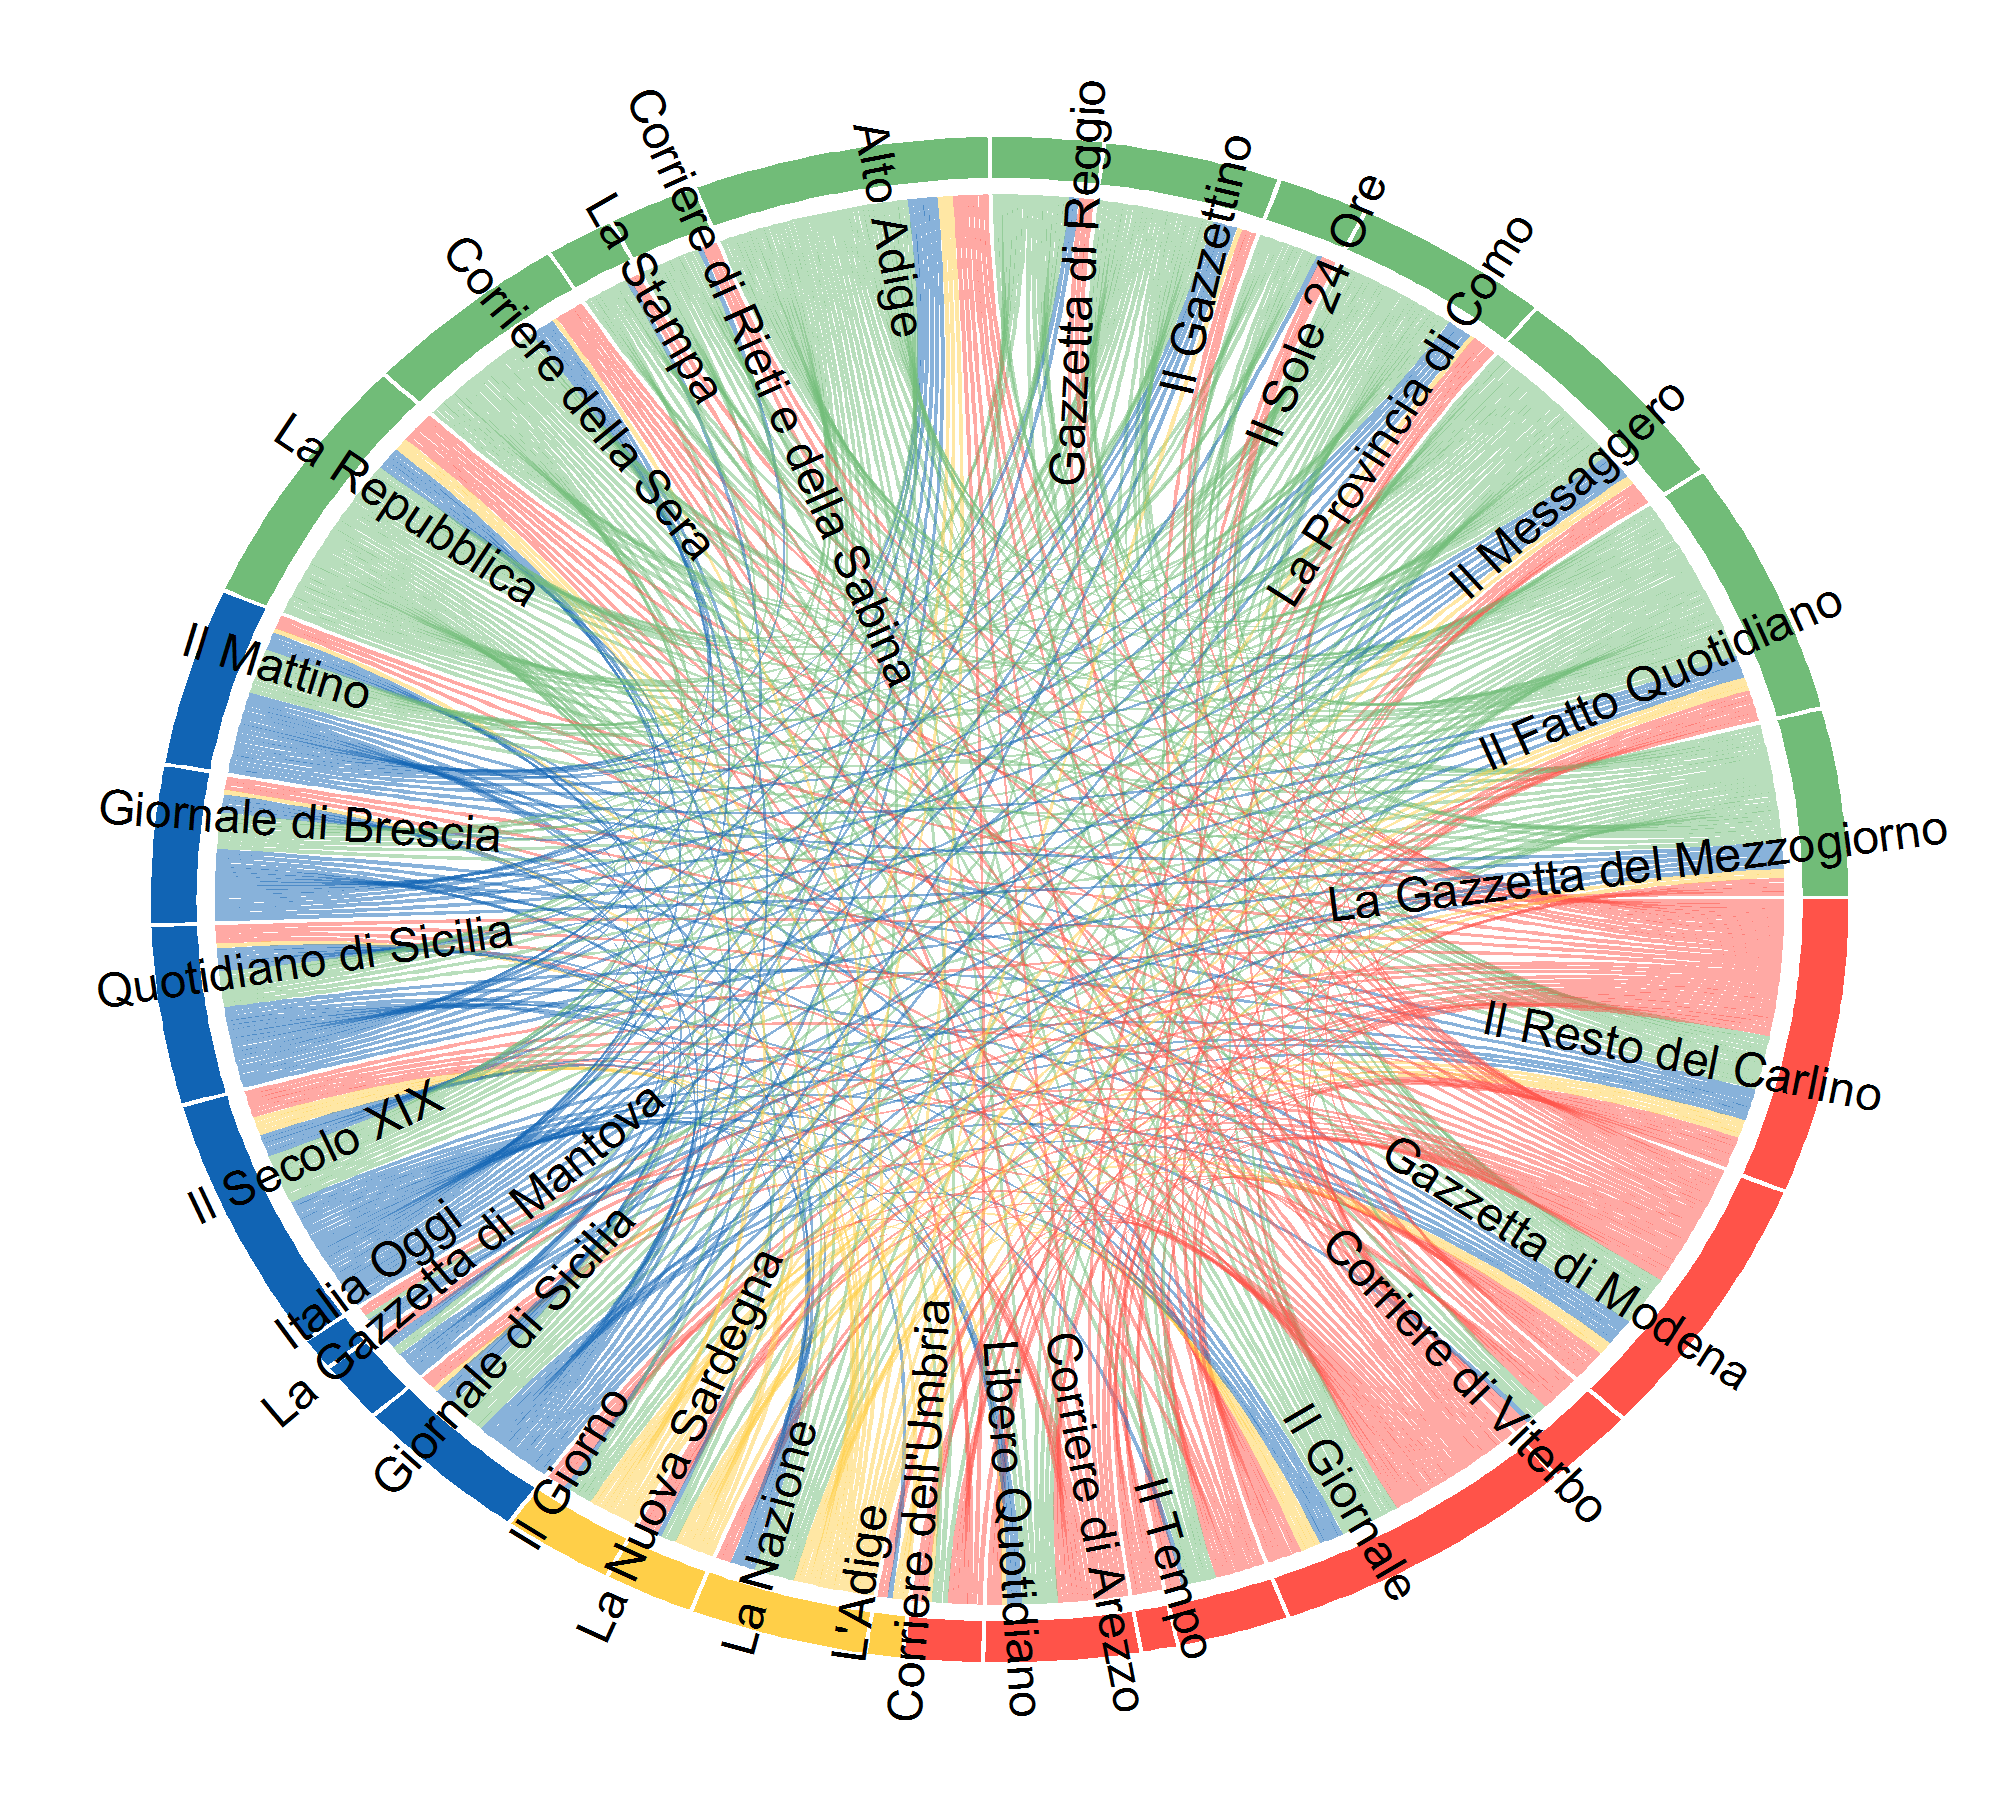
In Facebook we identify five communities of news pages, while in Twitter the communities are four. In Figure 1 we show the structure of Facebook and Twitter networks where vertices are grouped according to their community membership, while a complete list of the pages/accounts and their membership is reported in Table 2. For the case of both Facebook and Twitter, pages are not equally distributed among the communities, but we observe a main community () including about of vertices and two smaller communities ( and ), each one formed by of accounts. Activities on pages/accounts are even more skewed; the main community accounts for most of the activities () in both Facebook and Twitter.
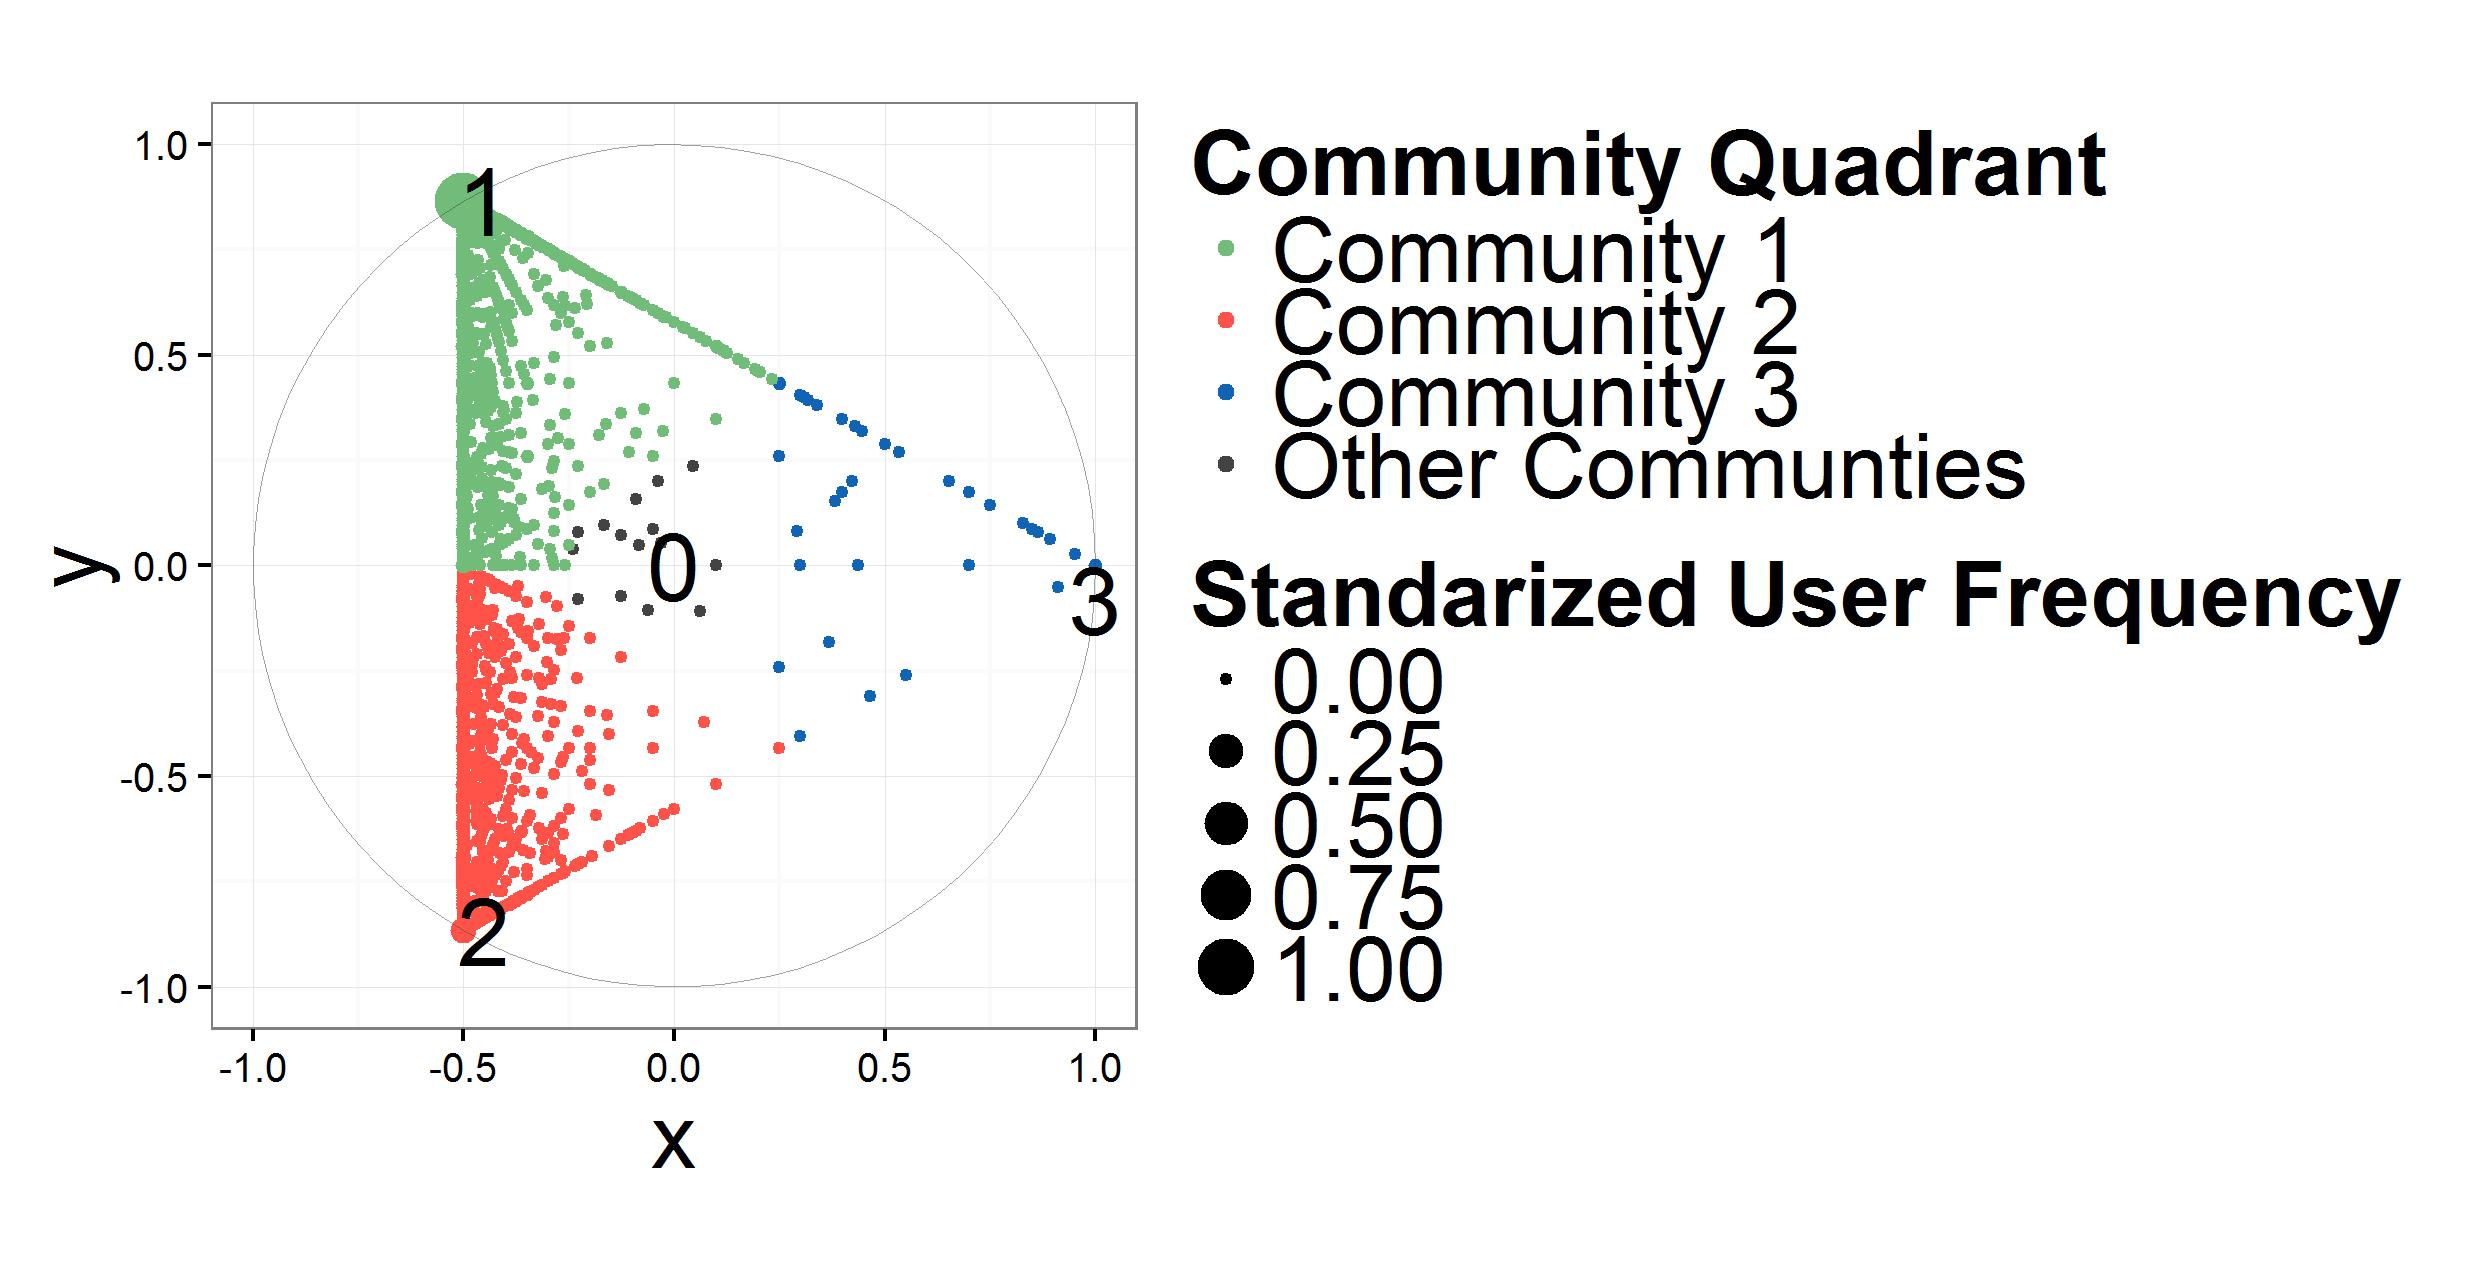
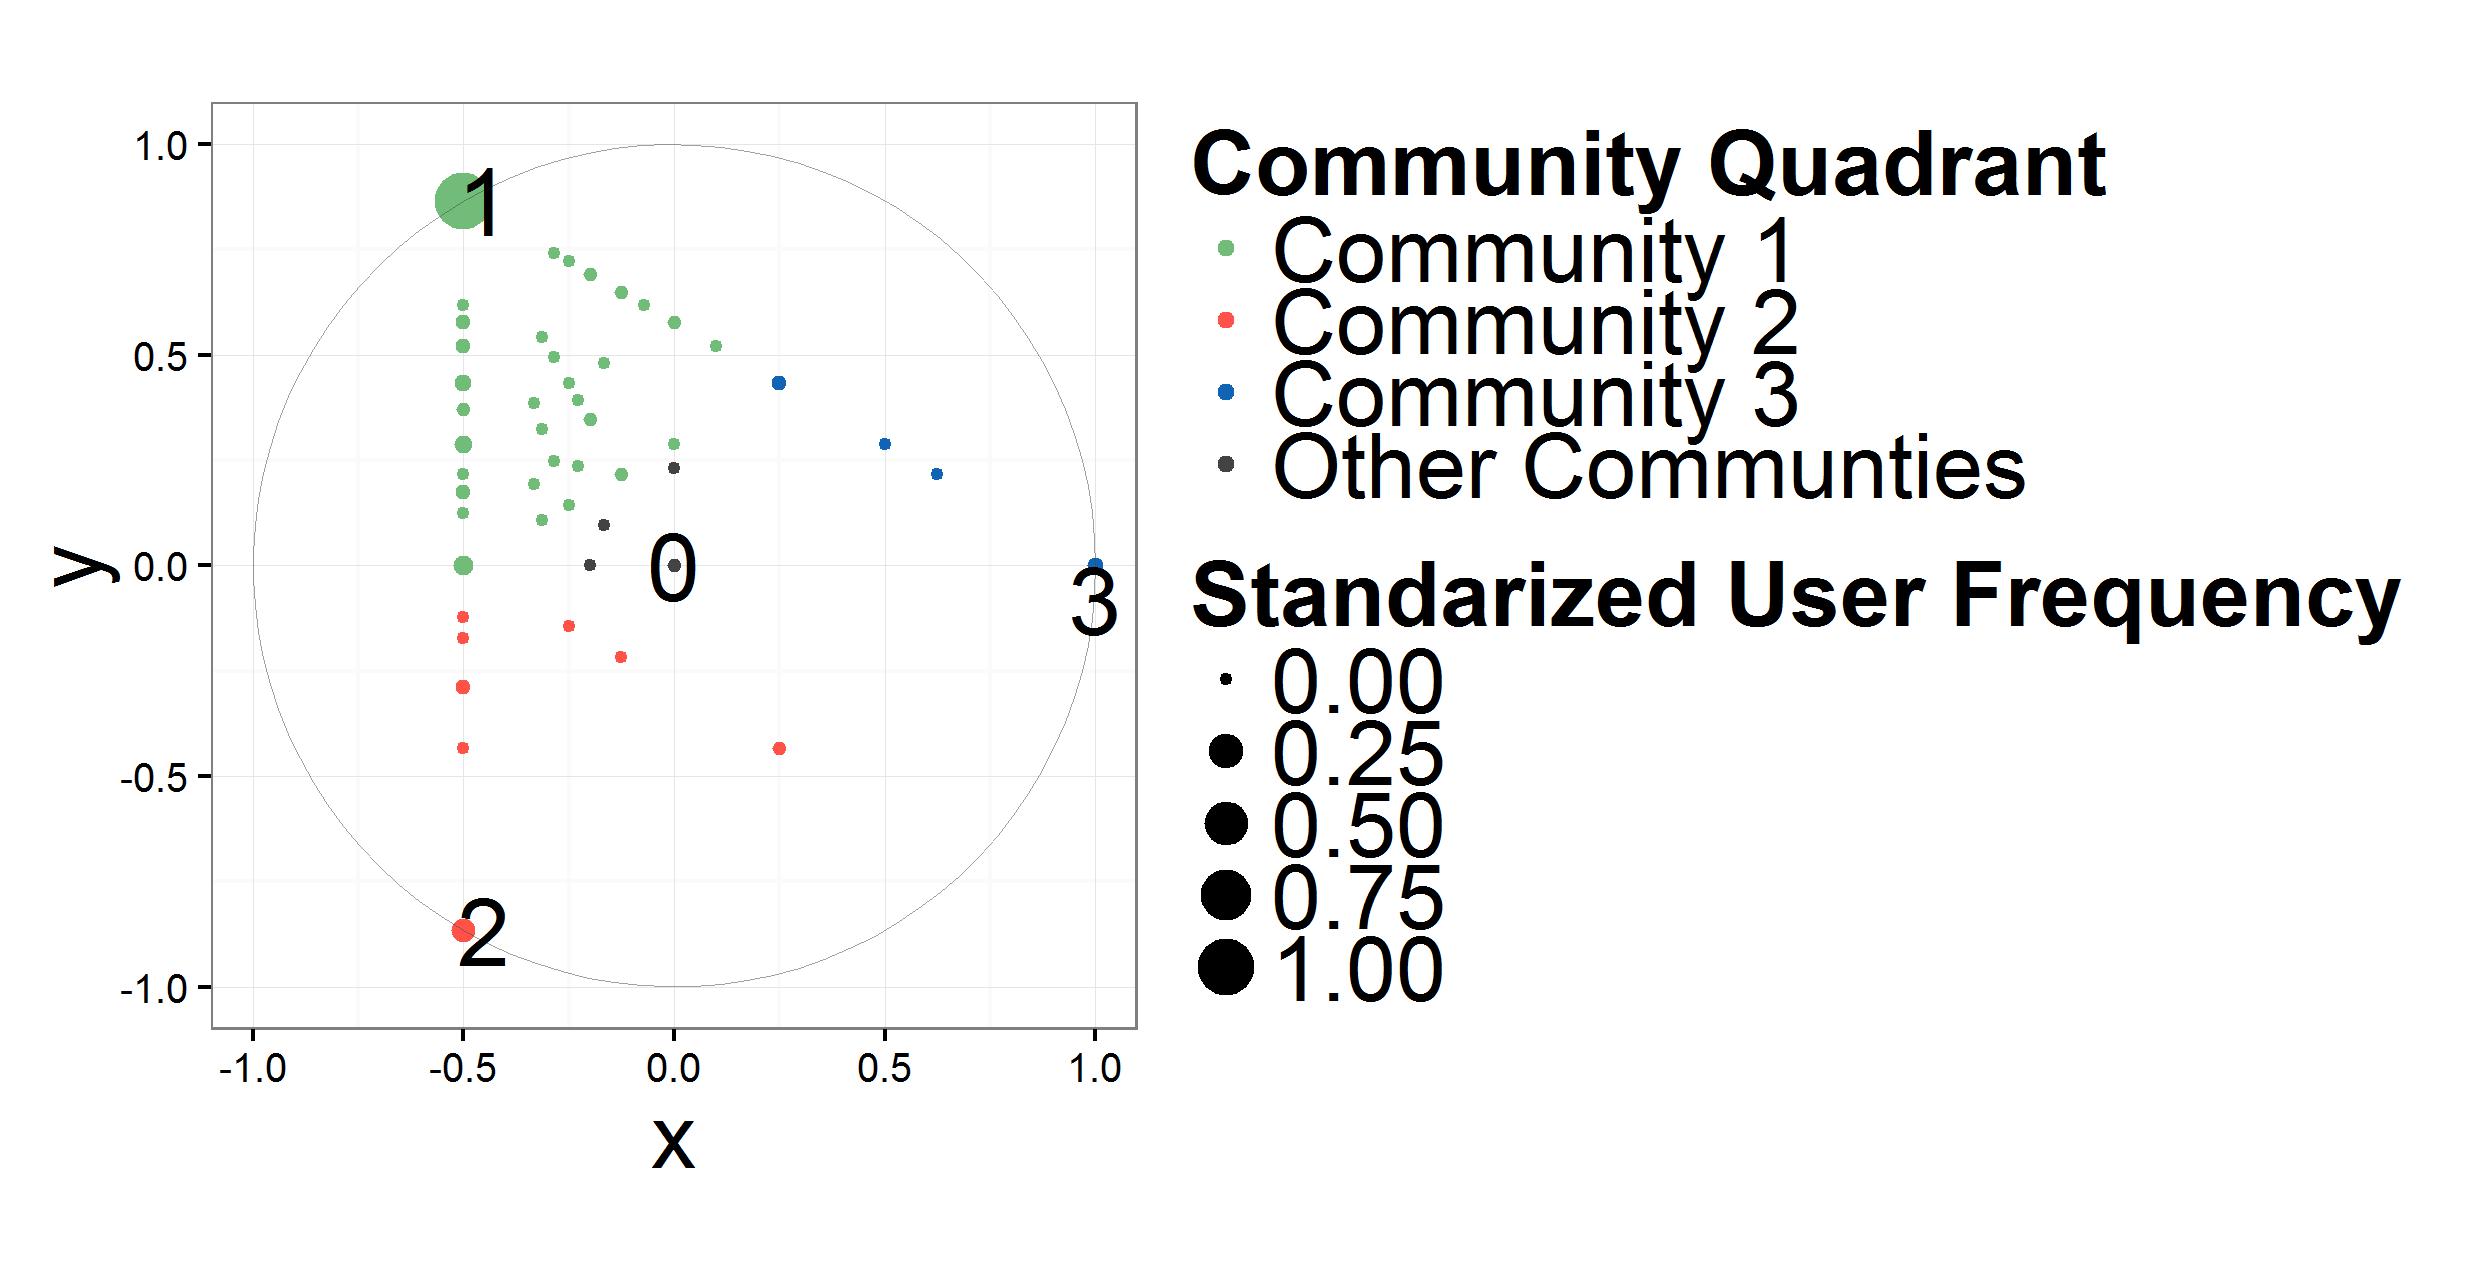
In order to characterize the relationship between the observed spontaneous emerging community structure of Facebook pages/ Twitter accounts and users behavior, we quantify the fraction of the activity of any user in the three most active communities versus that in any other community. Figure 2 shows the activity of users across the three most active communities emerging from either Facebook pages (Fig. 2(a)) or Twitter accounts (Fig. 2(b)). In both cases, we find that users are strongly polarized and that their attention is confined to a single community of pages. Both dynamics are similar, however we observe a substantial differentiation in the activity volume, with a smaller and even more polarized activity for the Twitter case.
4.2. News Presentation
We observed that users activity is mainly restricted to one echo chamber and that users show a limited interaction with other news sources. We are now interested in learning the process that drives such a pattern, which is observed in both Facebook and Twitter. We do that by measuring the distance between the sentiment with which the news is presented to the audience and the sentiment expressed by the users w.r.t. the same topic. To perform the analysis we make use of IBM Watson™ AlchemyLanguage service API (alc, 2017), which allows to extract semantic meta-data from posts content. Such a procedure applies machine learning and natural language processing techniques aimed to analyze text by automatically extracting relevant entities, their semantic relationships, as well as the emotional sentiment they express (Gangemi, 2013). In particular, we extract the sentiment and the main entities presented by each post of our datasets, whether it has a textual description or a link to an external document. Entities are represented by items such as persons, places, and organizations that are present in the input text. Entity extraction adds semantic knowledge to content to help understand the subject and context of the text that is being analyzed.
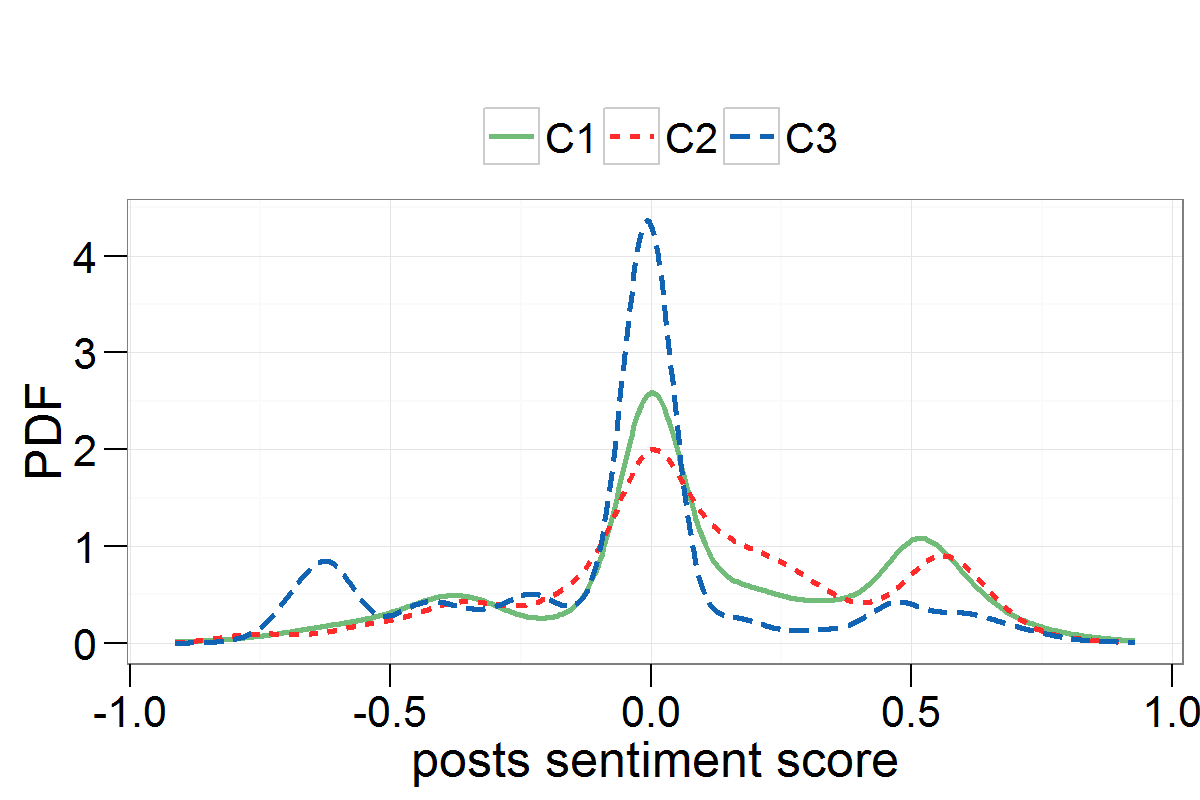
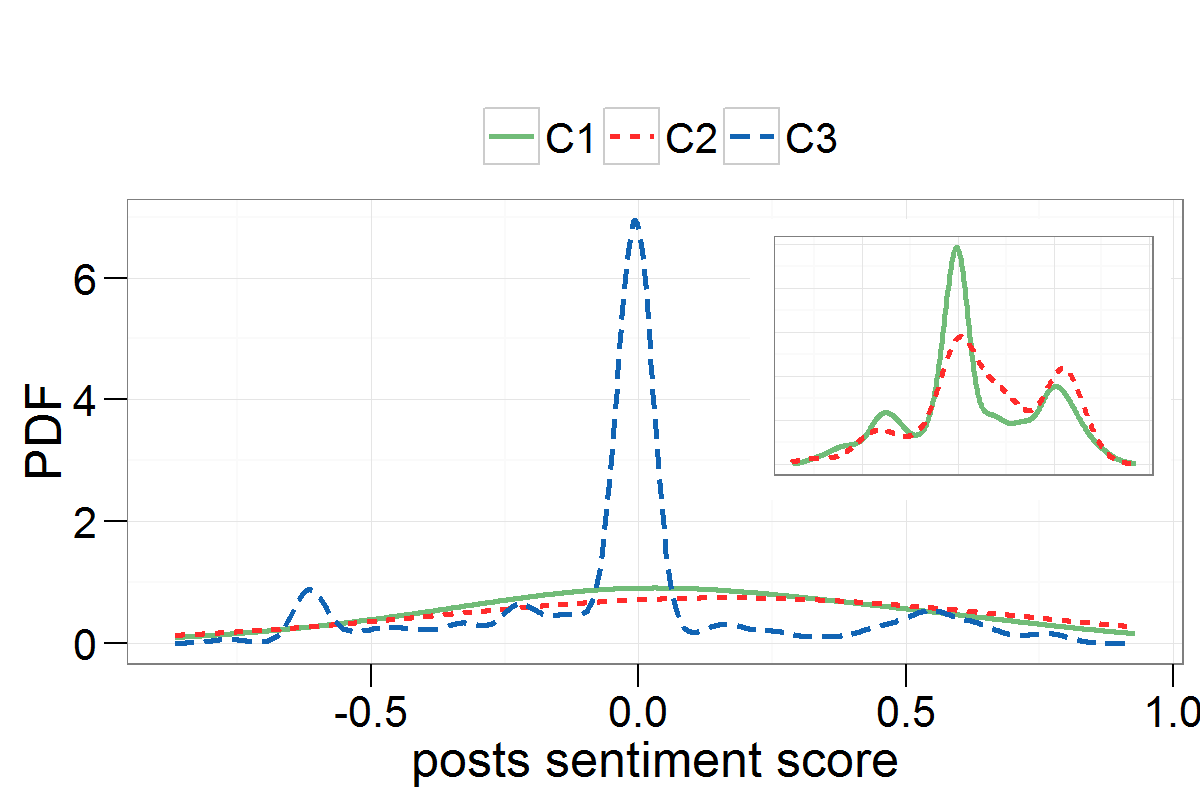
As a first step towards the identification and analysis of controversial topics, we look at how news are presented. Figure 3 shows the Probability Density Function of the posts sentiment score on the three most active communities for both Facebook (Figure 3(a)) and Twitter (Figure 3(b)). The sentiment score is defined in the range , where is negative, is neutral, and is positive. A neutral overall pattern is observed on both platforms meaning that topics are mainly presented in a neutral manner, although exhibiting a slightly higher probability of positive sentiment on the two largest communities (solid green and dashed red lines) with respect to the smaller one. Such a behavior is observed on both Facebook and Twitter. Notice that we consider how subjects are presented in a post; here we do not take into account the sentiment that the post may elicit in the reader, or the sentiment of users involved in the discussion.
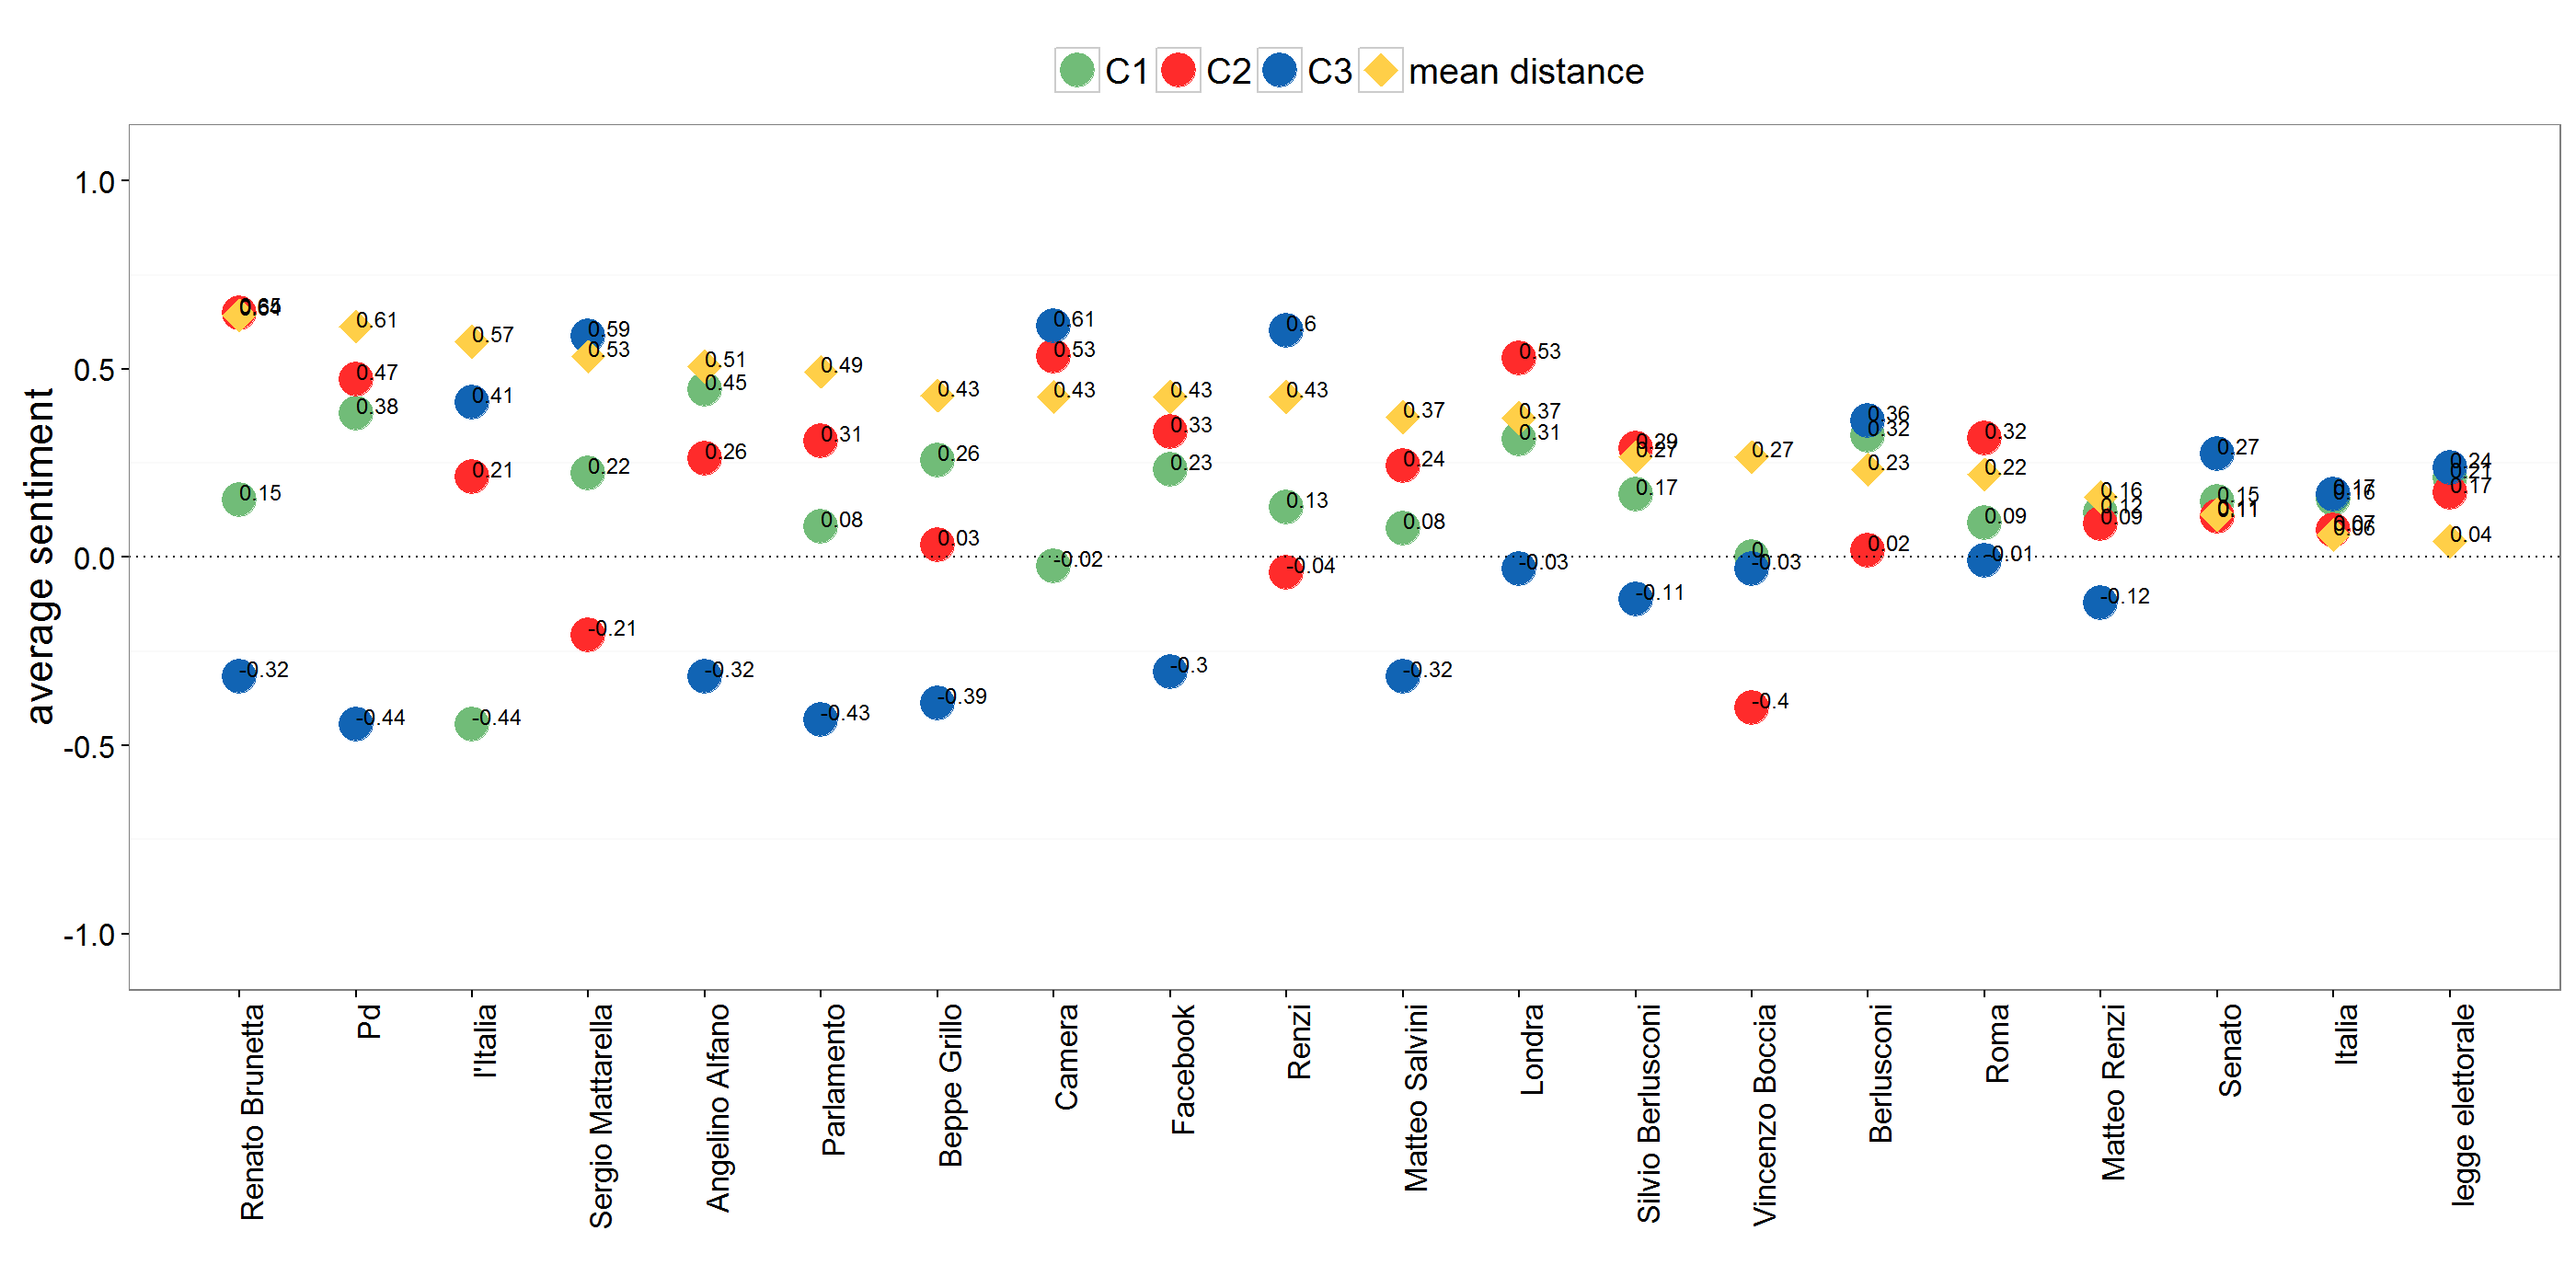
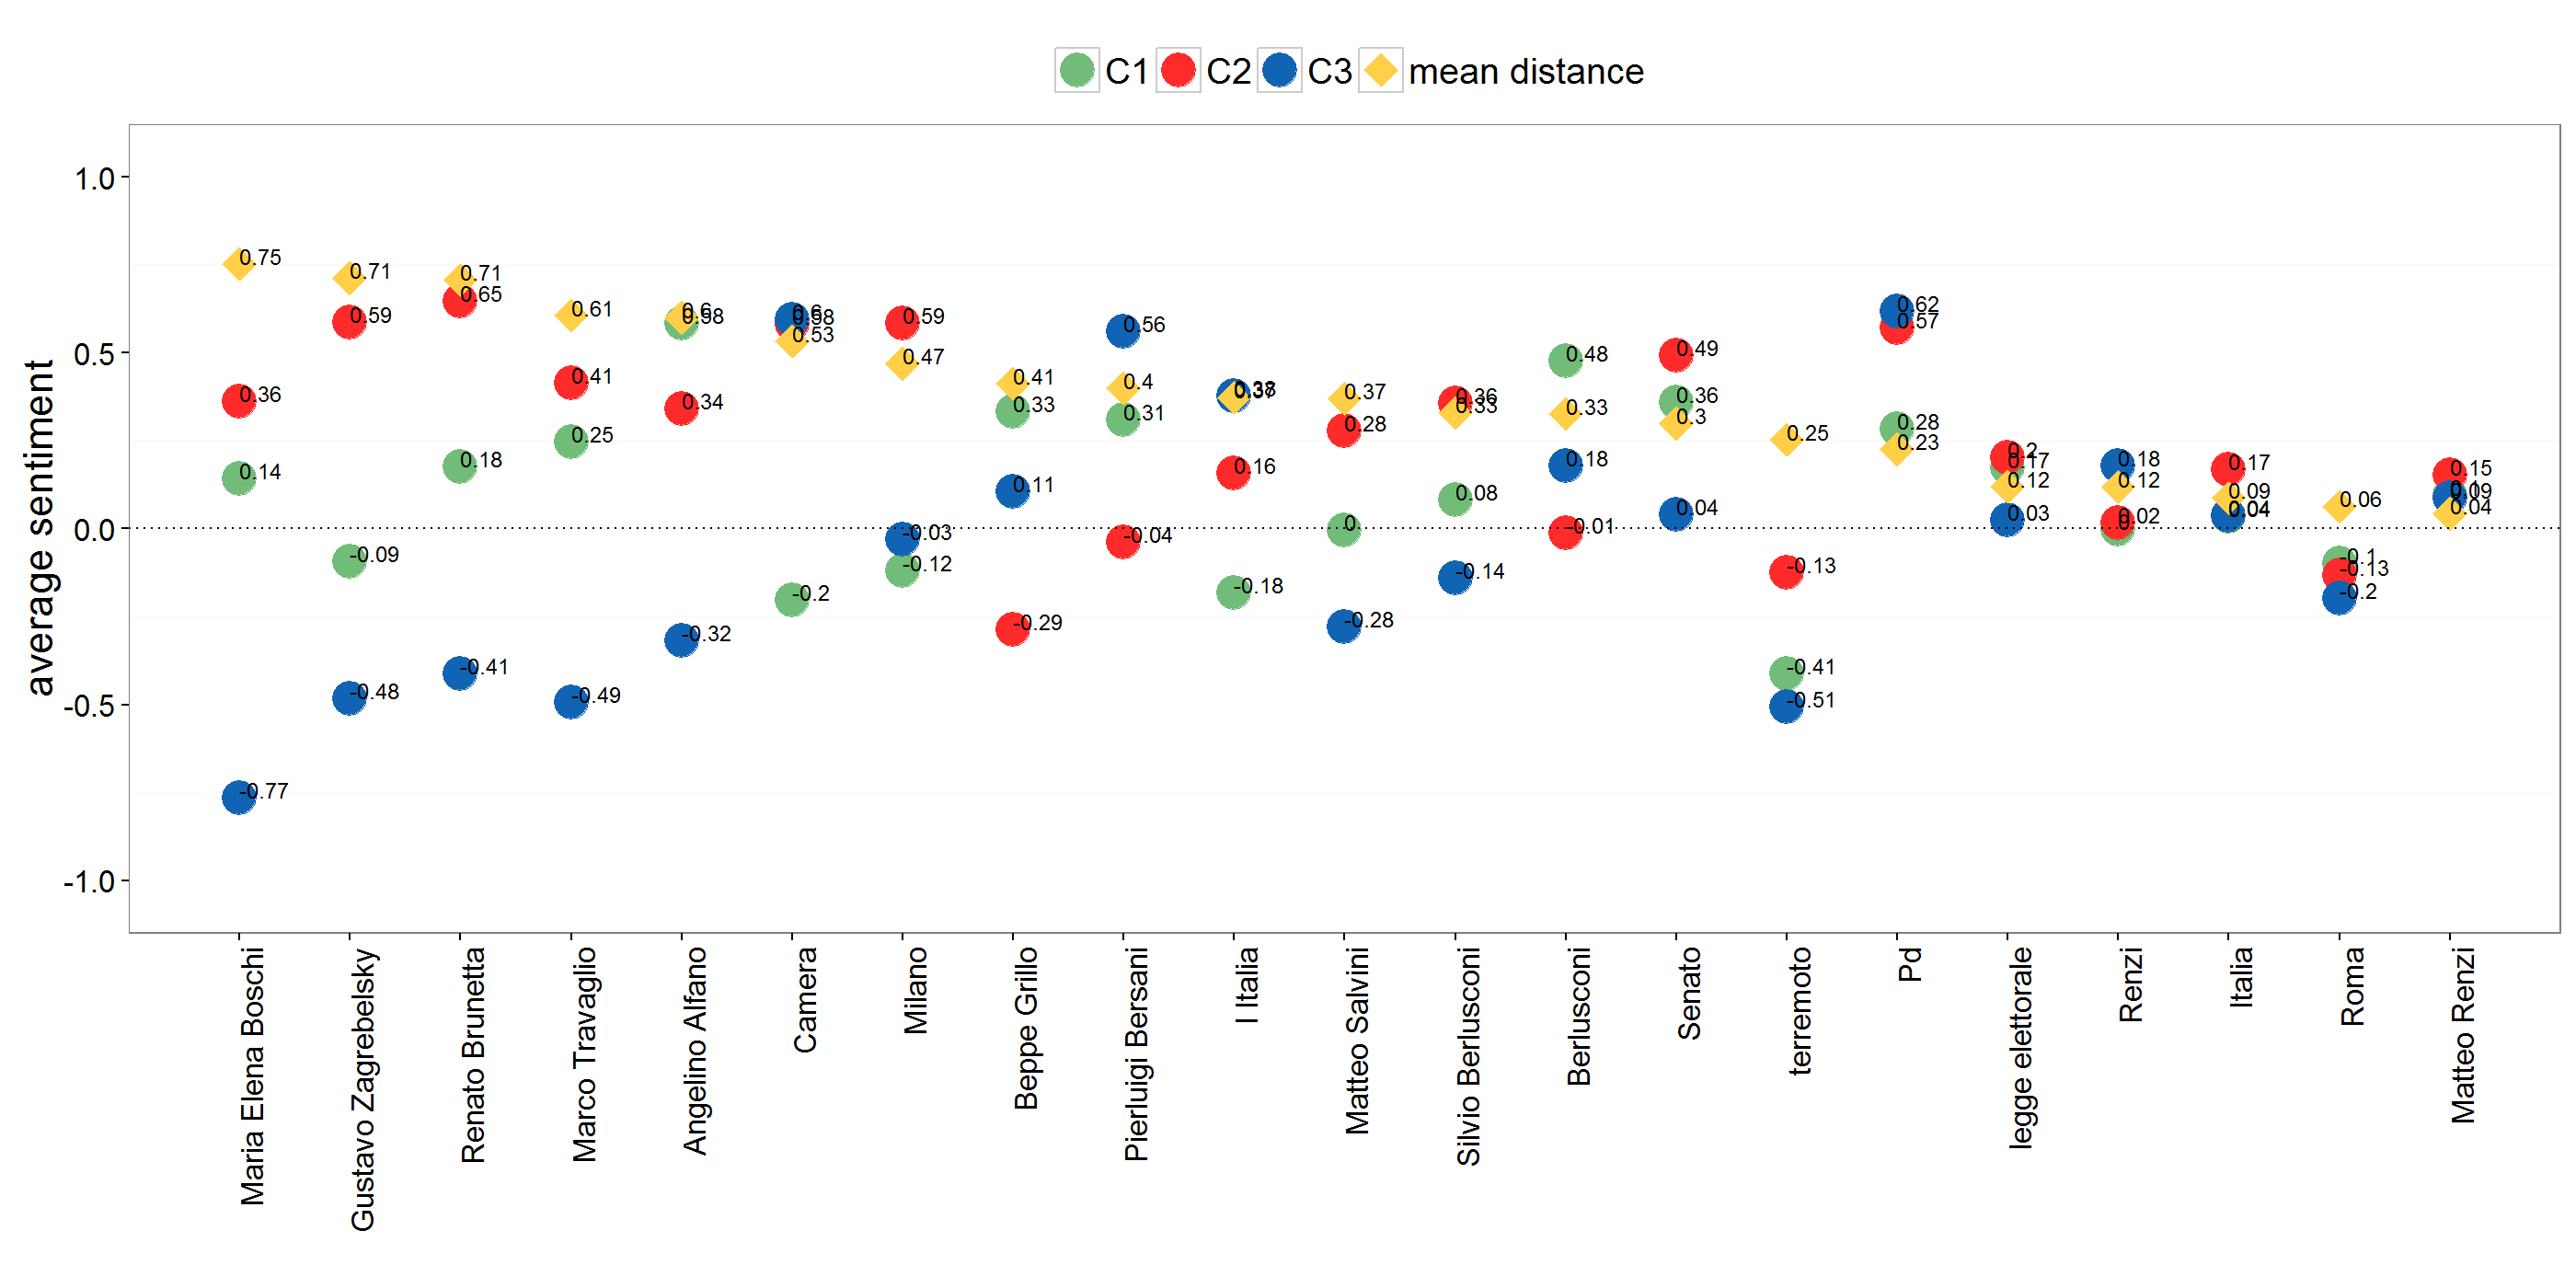
We now focus on the entities shared across communities: on Facebook we identify such entities appearing in posts from all the three most active communities, while on Twitter they are . For each entity we compute its average sentiment with respect to every community, i.e., we get three values representing the mean sentiment of the posts containing that entity in either , , or . The mean emotional distance of such entities is then the mean of the differences between the average sentiment pairwise computed. Figure 4(a) shows, for each entity, the average sentiment in each community (green dots fo , red for , and blue for ) and the mean emotional distance (yellow diamonds) among communities on Facebook, while Figure 4(b) reports the same information for Twitter. In both panels a) and b) entities are shown in descending order with respect to their mean emotional distance, with those on the left being the ones discussed with the greatest difference in sentiment, while those on the right the ones discussed in a much more similar way across the three echo chambers.
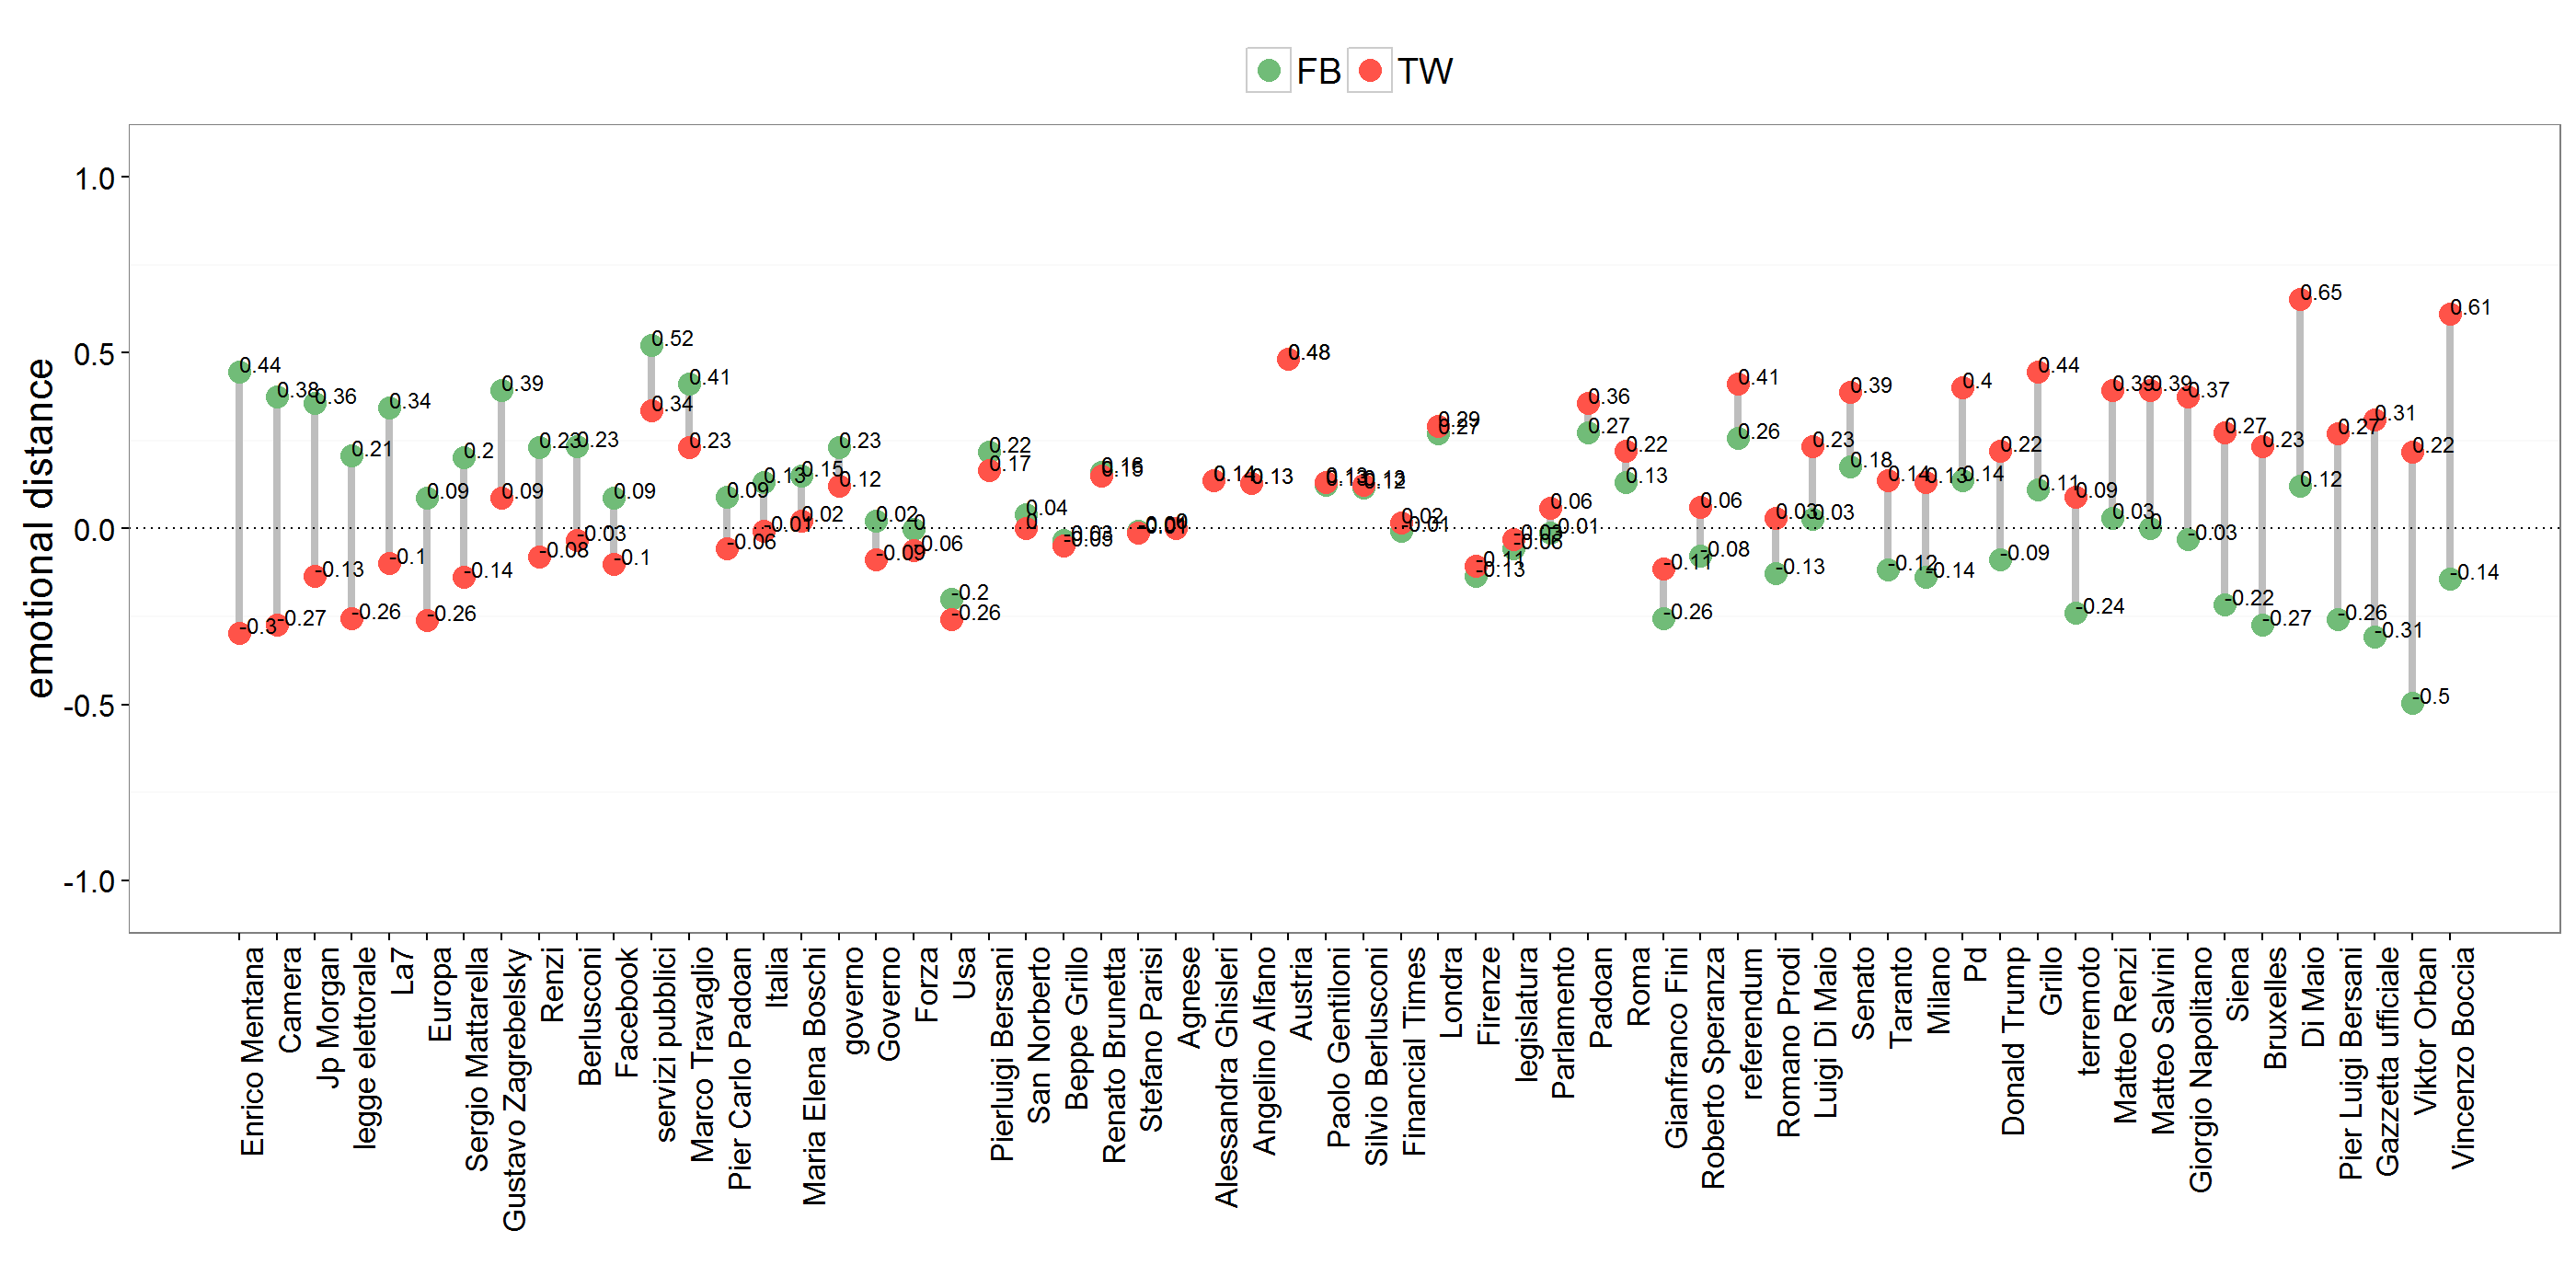
Figure 4(c) shows for each entity, the emotional distance between Facebook comunities aggregated (green dots) and Twitter ones (red dots). Entities on the left are presented in a more positive way on Facebook, and vice versa. We consider only entities appearing on both platforms and at least in two communities for each platform.
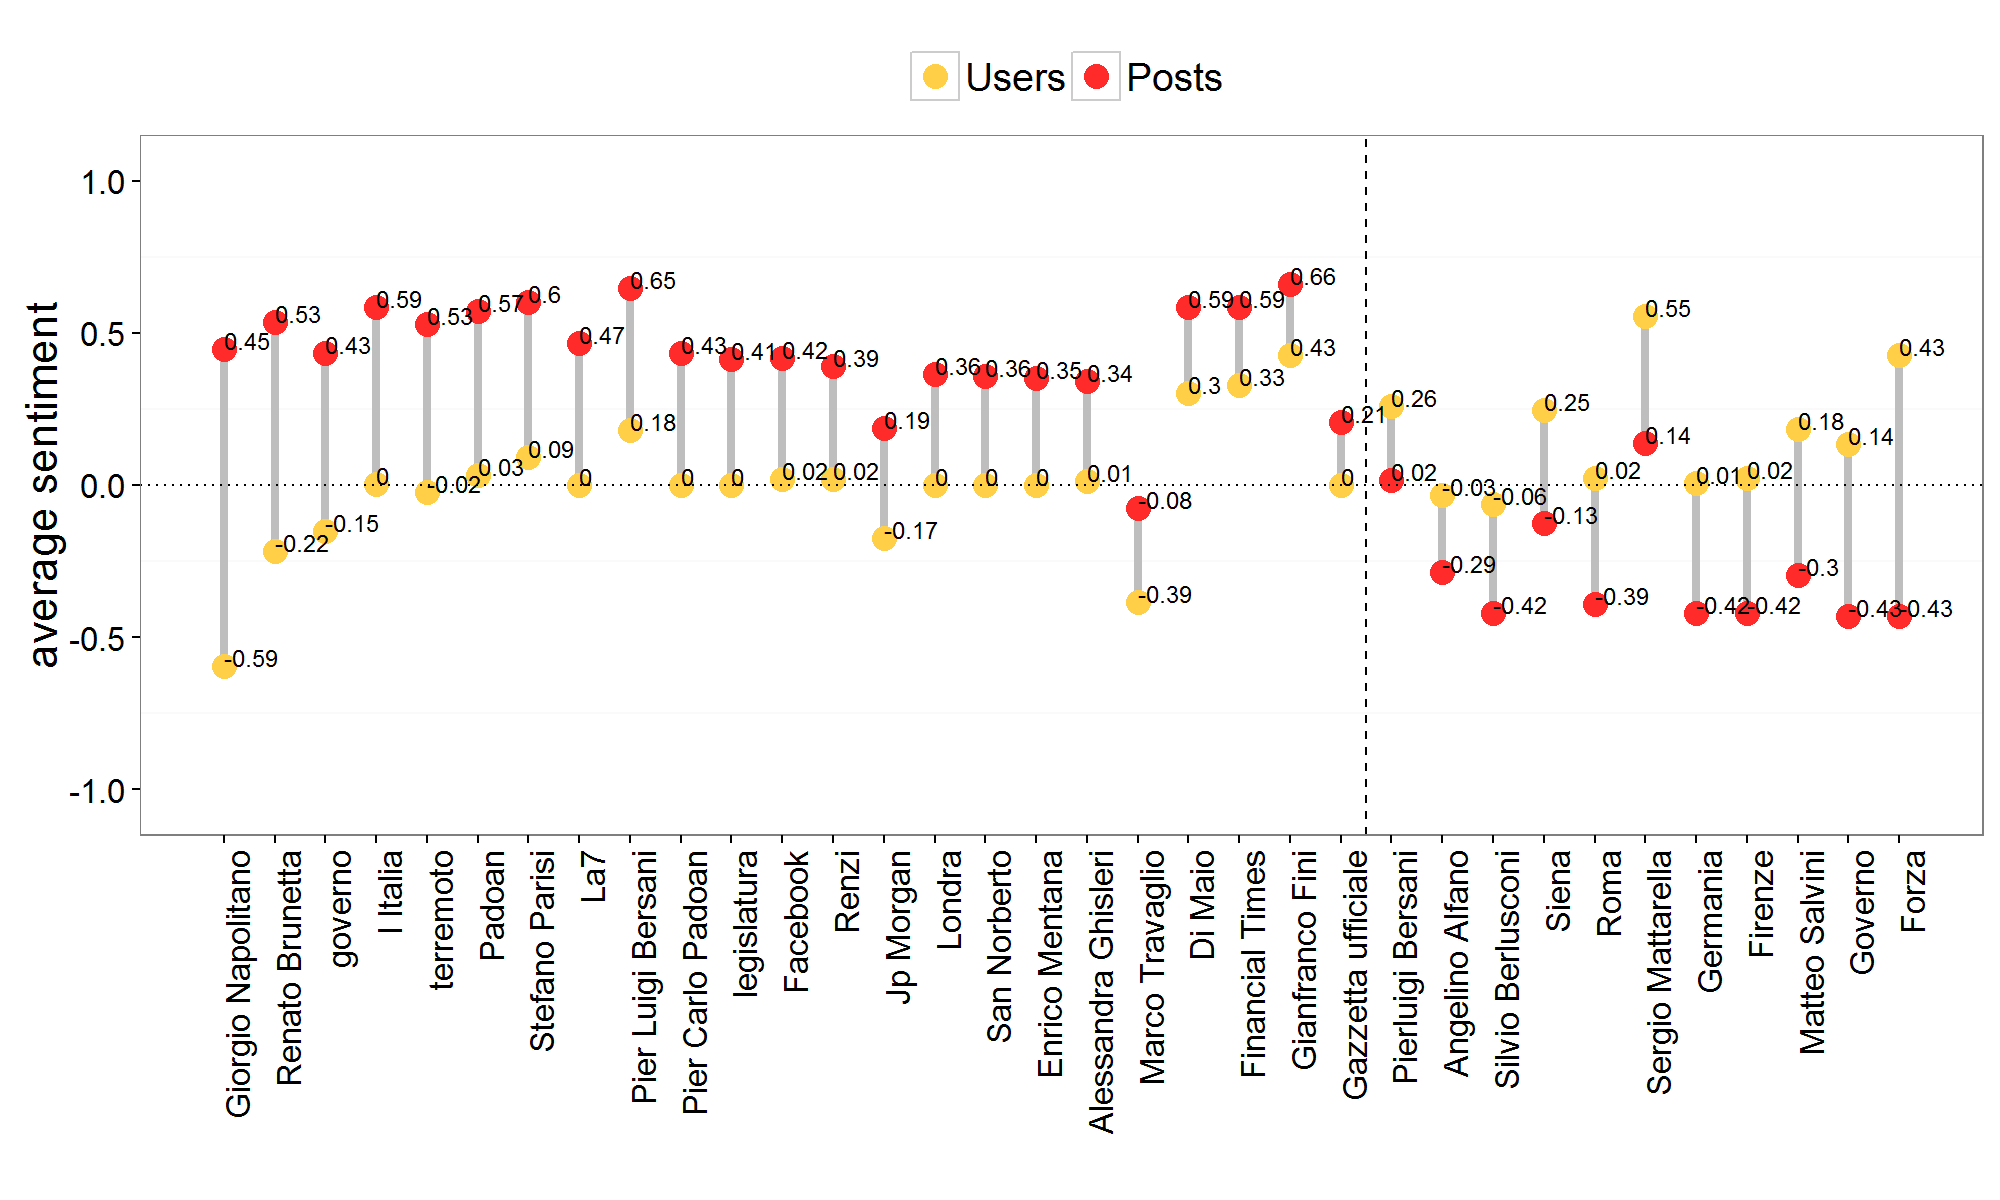
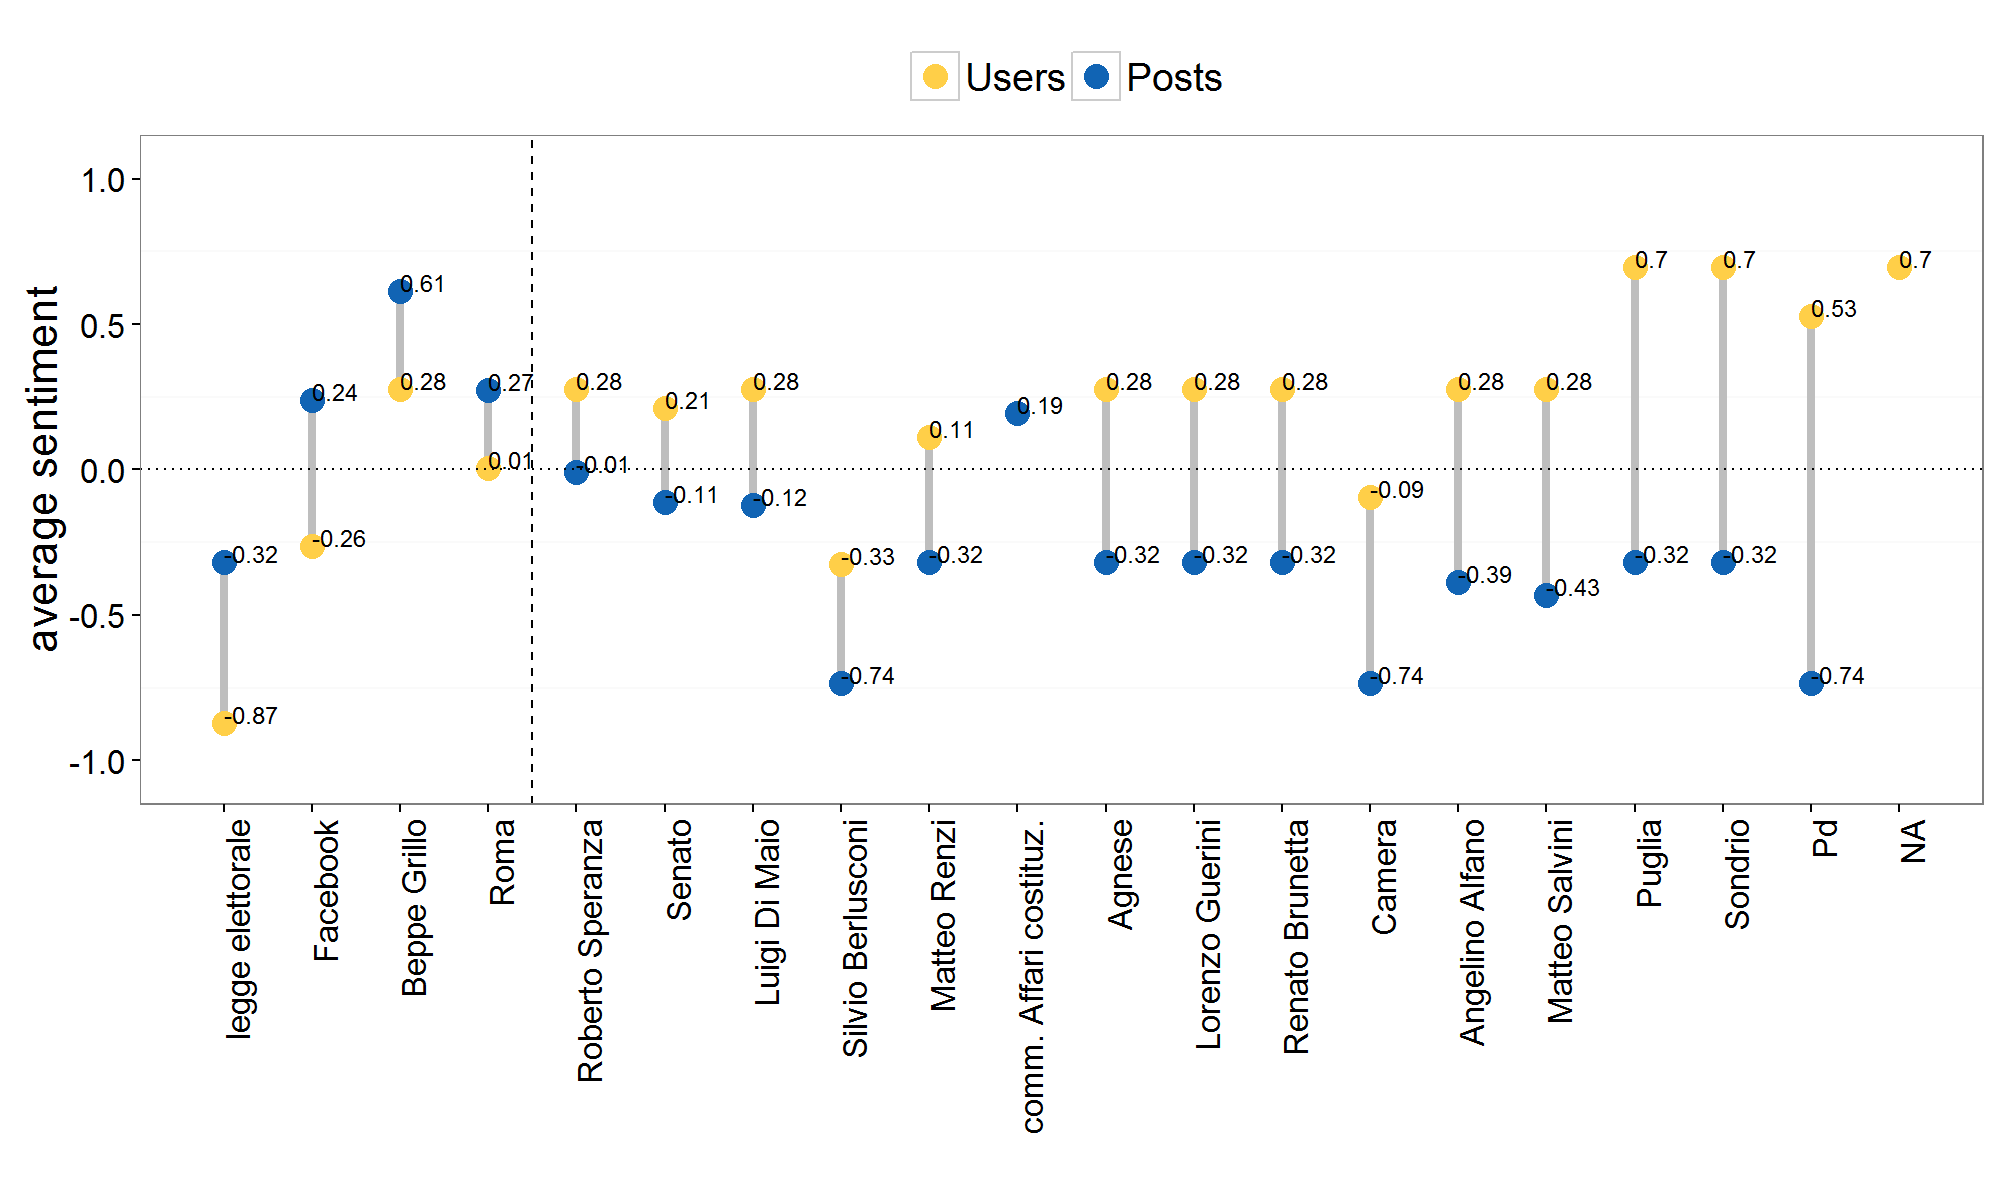
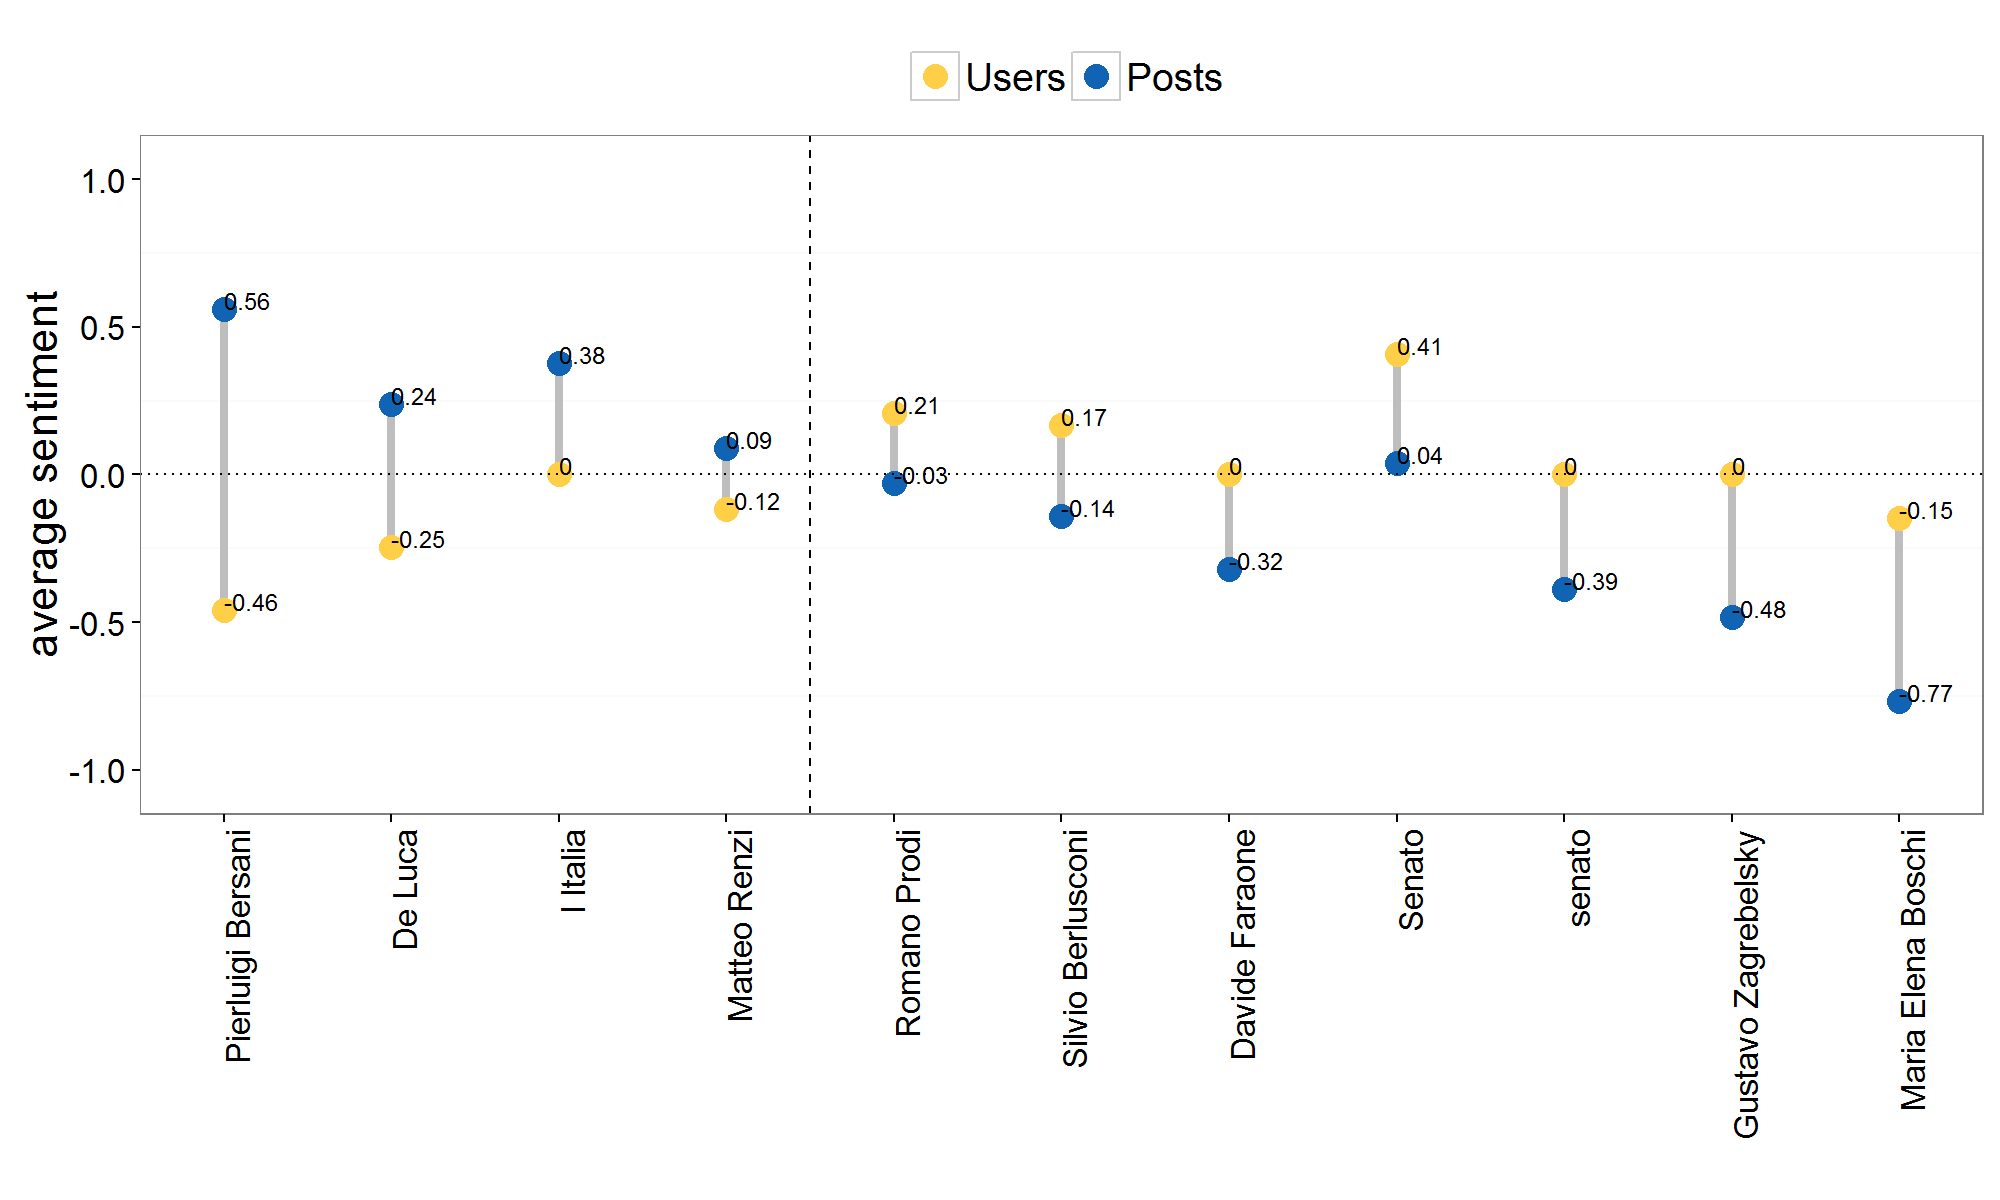
4.3. Users Response to Controversial Topics
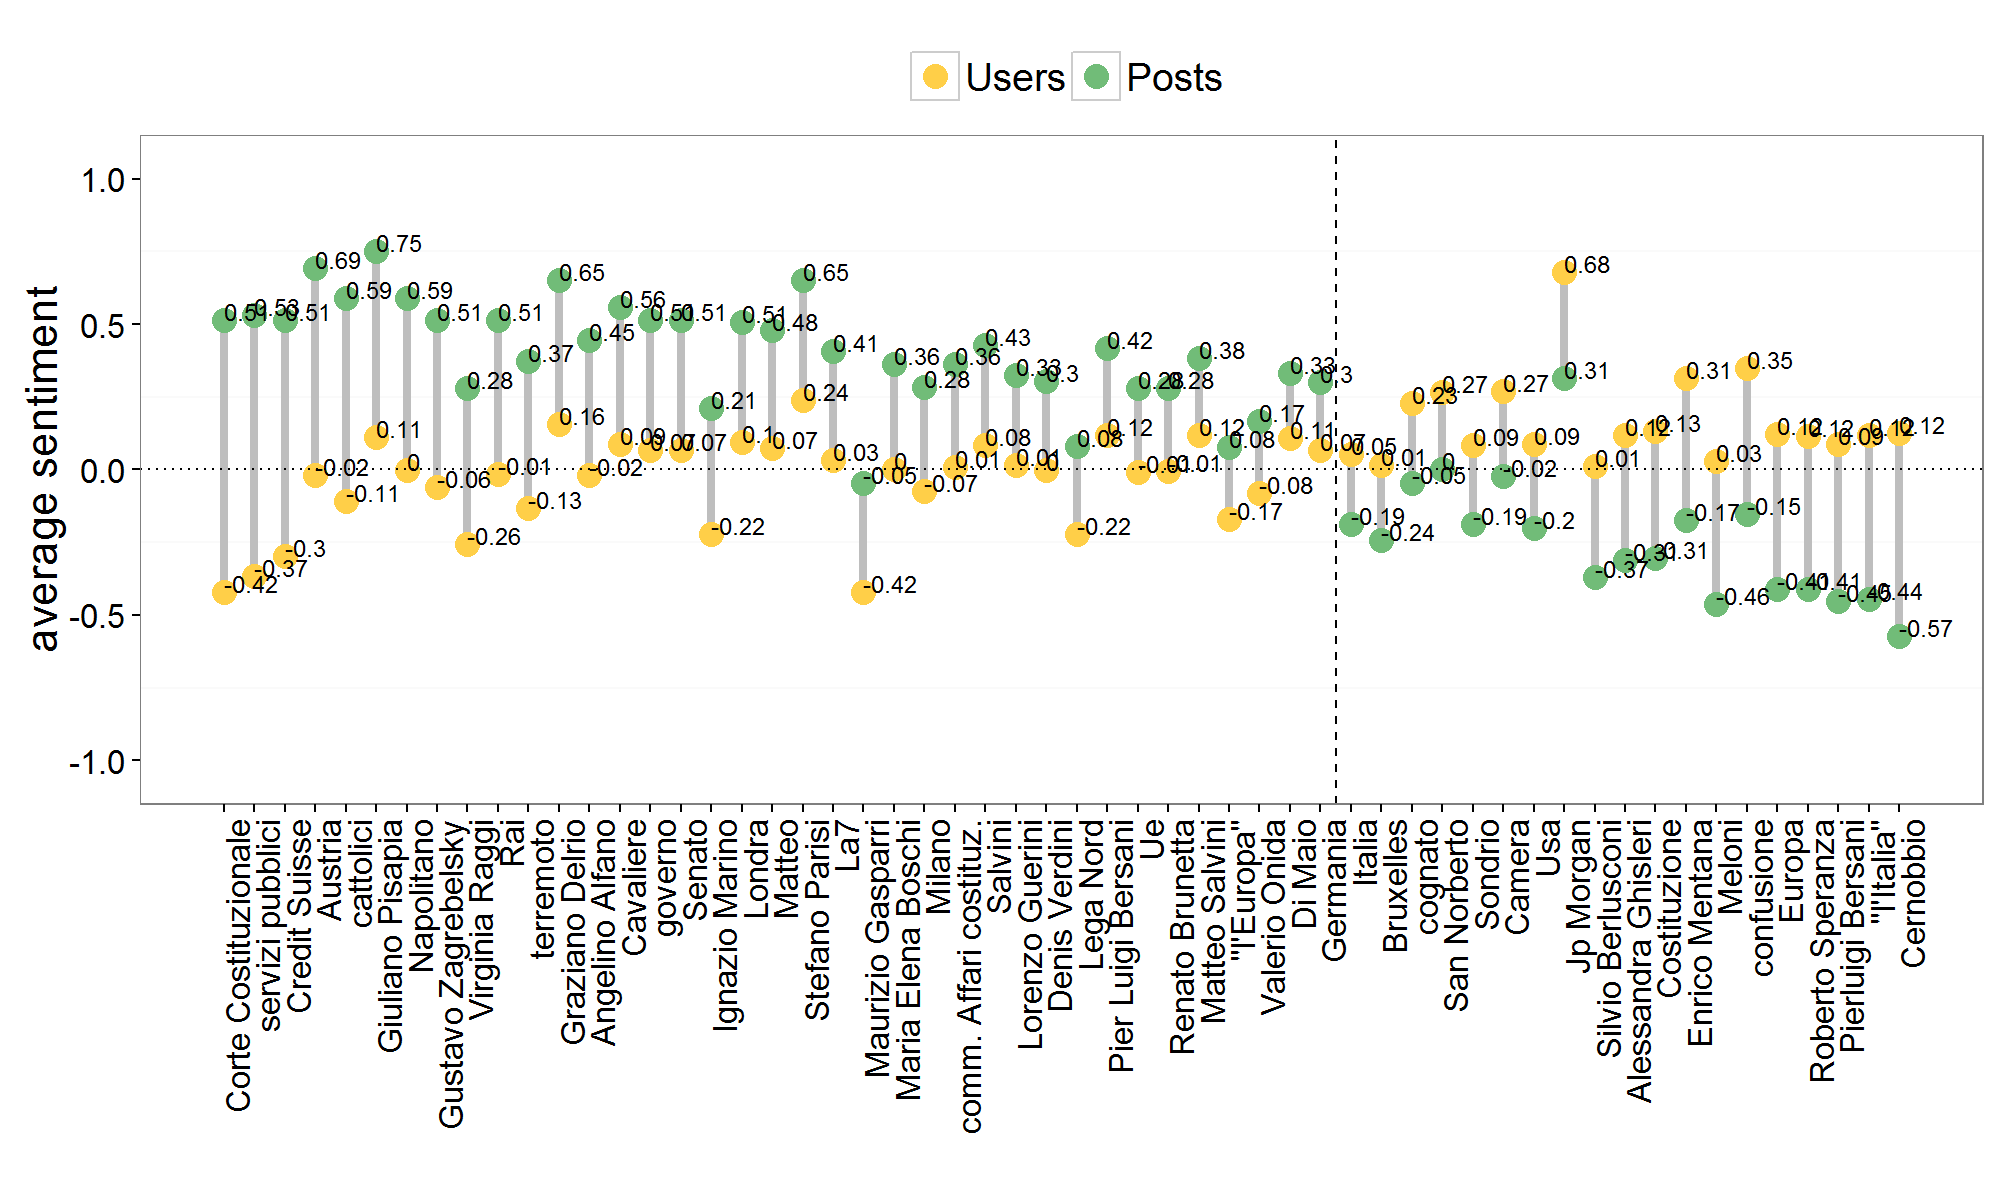
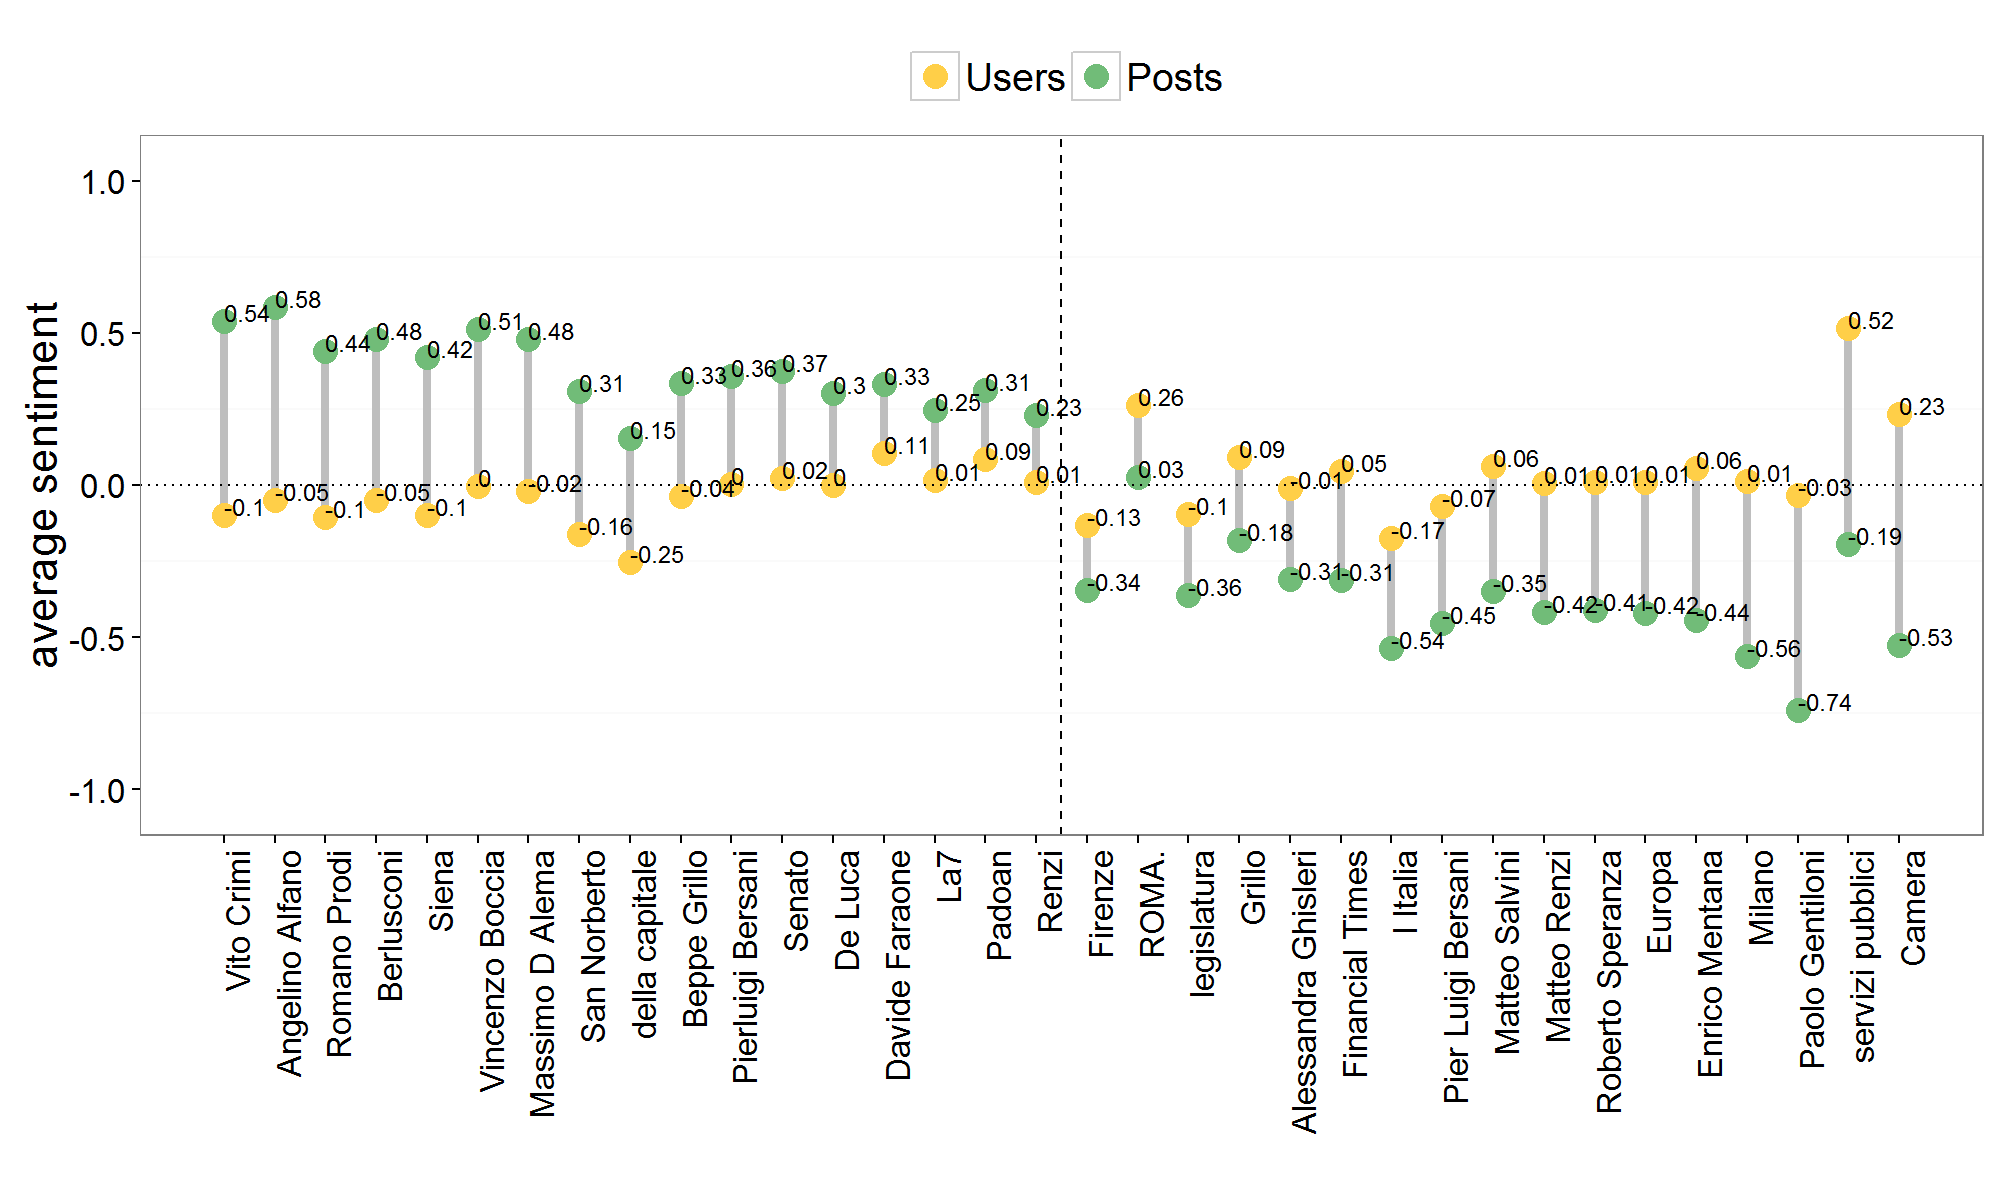
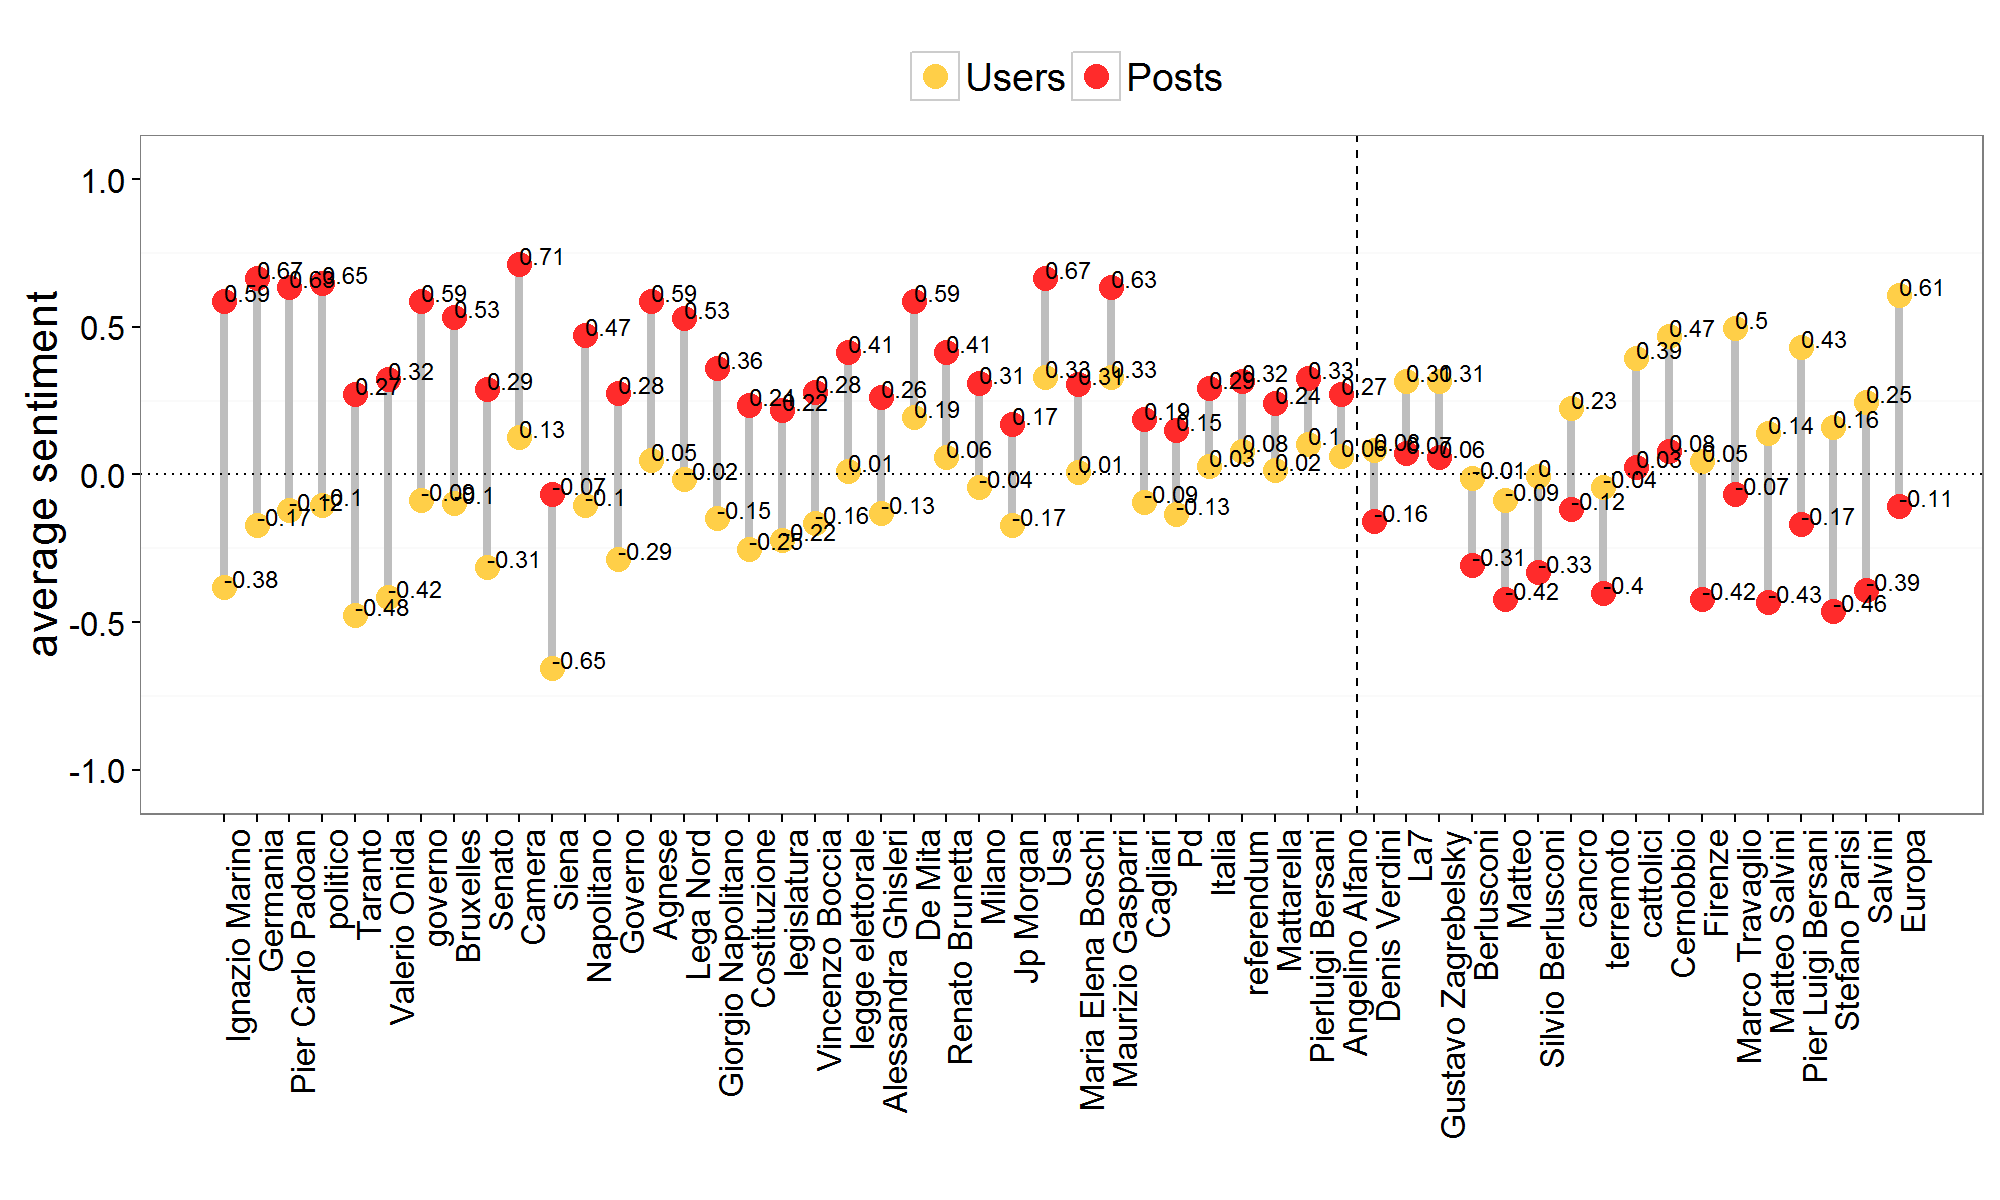
We have characterized how subjects are debated inside and across communities and we identified the emerging controversial topics. We are now interested in the attitude of users towards such topics. We then analyze the emotional response of users by looking at the sentiment they express when commenting. Specifically, we focus on comments left on posts containing entities shared by at least two posts and we then compute their sentiment score through AlchemyAPI. Thus,to each comment is associated a sentiment score in , characterized as before, and for each post (respectively, user) we compute the average sentiment of its (respectively, her) comments i.e., the mean of the sentiment of all comments of the post (respectively, user). Then, for each entity, we consider the emotional distance between the average sentiment of the post and that of its users. Since we are interested in identifying the most controversial entities, we consider only those for which the emotional distance (in absolute value) between the post and user is greater than . Figure 5 shows the emotional response of users to posts debating one of the listed controversial topics, on both Facebook and Twitter. Figures 5(a), 5(c) and 5(e) (respectively, 5(b), 5(d) and 5(f)) refer to , , and in Facebook (respectively, Twitter). In all panels a vertical dashed line denotes a change in users response: entities on the left are those for which users response is more negative than the sentiment expressed in the post, and vice versa for those on the right. We may notice that users tend to react to the content of the posts in and slightly more negatively on Facebook rather than Twitter, while the opposite is observed for .
| ID | Page Name | Facebook Community | Twitter Community |
|---|---|---|---|
| 1 | Corriere della Sera | C1 | C1 |
| 2 | Il Fatto Quotidiano | C1 | C1 |
| 3 | Il Sole 24 Ore | C1 | C1 |
| 4 | La Repubblica | C1 | C1 |
| 5 | La Stampa | C1 | C1 |
| 6 | Corriere di Viterbo | C1 | C2 |
| 7 | La Nuova Ferrara | C1 | - |
| 8 | La Provincia di Como | C2 | C1 |
| 9 | Il Giornale | C2 | C2 |
| 10 | Libero Quotidiano | C2 | C2 |
| 11 | Quotidiano di Sicilia | C2 | C3 |
| 12 | Corriere di Siena | C2 | - |
| 13 | Corriere Adriatico | C3 | N |
| 14 | Il Centro | C3 | N |
| 15 | Il Piccolo | C3 | N |
| 16 | Il Tirreno | C3 | N |
| 17 | L’Eco di Bergamo | C3 | N |
| 18 | La Gazzetta di Parma | C3 | N |
| 19 | Il Messaggero | C3 | C1 |
| 20 | Corriere di Arezzo | C3 | C2 |
| 21 | Gazzetta di Modena | C3 | C2 |
| 22 | Il Resto del Carlino | C3 | C2 |
| 23 | Il Tempo | C3 | C2 |
| 24 | Giornale di Sicilia | C3 | C3 |
| 25 | Il Mattino | C3 | C3 |
| 26 | Il Secolo XIX | C3 | C3 |
| 27 | La Nazione | C3 | C4 |
| 28 | Il Manifesto | C3 | - |
| 29 | La Sicilia | C3 | N |
| 30 | Il Messaggero Veneto | C4 | N |
| 31 | L’Unione Sarda | C4 | N |
| 32 | La Provincia di Cremona | C4 | N |
| 33 | Gazzetta di Reggio | C4 | C1 |
| 34 | La Gazzetta del Mezzogiorno | C4 | C1 |
| 35 | Giornale di Brescia | C4 | C3 |
| 36 | Italia Oggi | C4 | C3 |
| 37 | La Gazzetta di Mantova | C4 | C3 |
| 38 | Il Giorno | C4 | C4 |
| 39 | La Nuova Sardegna | C4 | C4 |
| 40 | Gazzetta del Sud | C4 | - |
| 41 | Il Giornale di Vicenza | C5 | N |
| 42 | Il Mattino di Padova | C5 | N |
| 43 | La Nuova di Venezia e Mestre | C5 | N |
| 44 | Trentino | C5 | N |
| 45 | Alto Adige | C5 | C1 |
| 46 | Il Gazzettino | C5 | C1 |
| 47 | L’Adige | C5 | C4 |
| 48 | Corriere delle Alpi | C5 | N |
| 49 | L’Arena | C5 | - |
| 50 | La Provincia Pavese | C5 | - |
| 51 | La Tribuna di Treviso | C5 | N |
| 52 | Corriere di Rieti e della Sabina | C6 | C1 |
| 53 | Corriere dell’Umbria | C6 | C2 |
| 54 | La Provincia di Lecco | N | N |
| 55 | La Provincia di Sondrio | N | N |
| 56 | Quotidiano di Puglia | N | N |
| 57 | Avvenire | N | - |
5. Conclusions
Social media have radically changed the paradigm of news consumption and the rising attention to the spreading of fake news and unsubstantiated rumors on online social media led researchers to investigate different aspects of the phenomenon. In this paper we aim to understand the main determinants behind content consumption on social media by focusing on the online debate around the Italian Constitutional Referendum. Throughout a quantitative, cross-platform analysis on both Facebook public pages and Twitter accounts, we characterize the structural properties of the discussion, observing the emergence of well-separeted communities on both platforms. Such a segregation is completely spontaneous; indeed, we find that users tend to restrict their attention to a specific set of pages/accounts. Finally, taking advantage of automatic topic extraction and sentiment analysis techniques, we are able to identify the most controversial topics inside and across both platforms, and to measure the distance between how a certain topic is presented in the posts/tweets and the related emotional response of users. Our novel approach may provide interesting insights for a) the understanding of the evolution of the core narratives behind different echo chambers and b) the early detection of massive viral phenomena around false claims on online social media.
References
- (1)
- alc (2017) 2017. Alchemy API — Powering the New AI Economy. An IBM Company. (February 2017). http://www.alchemyapi.com/
- Adamic and Glance (2005) Lada A Adamic and Natalie Glance. 2005. The political blogosphere and the 2004 US election: divided they blog. In Proceedings of the 3rd international workshop on Link discovery. ACM, 36–43.
- ADS (2016) ADS. 2016. Elenchi Testate. Website. (2016). http://www.adsnotizie.it/_testate.asp
- Asur and Huberman (2010) Sitaram Asur and Bernardo A Huberman. 2010. Predicting the future with social media. In Web Intelligence and Intelligent Agent Technology (WI-IAT), 2010 IEEE/WIC/ACM International Conference on, Vol. 1. IEEE, 492–499.
- Backstrom et al. (2013) Lars Backstrom, Jon Kleinberg, Lillian Lee, and Cristian Danescu-Niculescu-Mizil. 2013. Characterizing And Curating Conversation Threads: Expansion, Focus, Volume, Re-Entry. In Proceedings of WSDM. 13–22.
- Becker et al. (2010) Hila Becker, Mor Naaman, and Luis Gravano. 2010. Learning similarity metrics for event identification in social media. In Proceedings of the third ACM international conference on Web search and data mining. ACM, 291–300.
- Bessi et al. (2015a) Alessandro Bessi, Mauro Coletto, George Alexandru Davidescu, Antonio Scala, Guido Caldarelli, and Walter Quattrociocchi. 2015a. Science vs Conspiracy: collective narratives in the age of misinformation. PloS one 10, 2 (2015), 02.
- Bessi et al. (2015b) Alessandro Bessi, Fabio Petroni, Michela Del Vicario, Fabiana Zollo, Aris Anagnostopoulos, Antonio Scala, Guido Caldarelli, and Walter Quattrociocchi. 2015b. Viral Misinformation: The Role of Homophily and Polarization. In Proceedings of the 24th International Conference on World Wide Web Companion. International World Wide Web Conferences Steering Committee, 355–356.
- Blondel et al. (2008) Vincent D. Blondel, Jean-Loup Guillaume, Renaud Lambiotte, and Etienne Lefebvre. 2008. Fast unfolding of communities in large networks. Journal of Statistical Mechanics: Theory and Experiment 2008, 10 (2008), P10008.
- Castillo et al. (2014) Carlos Castillo, Mohammed El-Haddad, Jürgen Pfeffer, and Matt Stempeck. 2014. Characterizing the life cycle of online news stories using social media reactions. In Proceedings of the 17th ACM conference on Computer supported cooperative work & social computing. ACM, 211–223.
- Clauset et al. (2004) Aaron Clauset, M. E. J. Newman, and Cristopher Moore. 2004. Finding community structure in very large networks. Phys. Rev. E 70 (Dec 2004), 066111. Issue 6. DOI:http://dx.doi.org/10.1103/PhysRevE.70.066111
- Danon et al. (2005) Leon Danon, Albert Díaz-Guilera, Jordi Duch, and Alex Arenas. 2005. Comparing community structure identification. Journal of Statistical Mechanics: Theory and Experiment 2005, 09 (2005), P09008. http://stacks.iop.org/1742-5468/2005/i=09/a=P09008
- Del Vicario et al. (2016a) Michela Del Vicario, Alessandro Bessi, Fabiana Zollo, Fabio Petroni, Antonio Scala, Guido Caldarelli, H Eugene Stanley, and Walter Quattrociocchi. 2016a. The spreading of misinformation online. Proceedings of the National Academy of Sciences 113, 3 (2016), 554–559.
- Del Vicario et al. (2016b) Michela Del Vicario, Fabiana Zollo, Guido Caldarelli, Antonio Scala, and Walter Quattrociocchi. 2016b. The Anatomy of Brexit Debate on Facebook. arXiv preprint arXiv:1610.06809 (2016).
- Diao et al. (2012) Qiming Diao, Jing Jiang, Feida Zhu, and Ee-Peng Lim. 2012. Finding bursty topics from microblogs. In Proceedings of the 50th Annual Meeting of the Association for Computational Linguistics: Long Papers-Volume 1. Association for Computational Linguistics, 536–544.
- Facebook (2013) Facebook. 2013. Using the Graph API. Website. (8 2013). https://developers.facebook.com/docs/graph-api/using-graph-api/ last checked: 19.01.2014.
- Gangemi (2013) Aldo Gangemi. 2013. A comparison of knowledge extraction tools for the semantic web. In Extended Semantic Web Conference. Springer, 351–366.
- Grabowicz et al. (2012) Przemyslaw A Grabowicz, José J Ramasco, Esteban Moro, Josep M Pujol, and Victor M Eguiluz. 2012. Social features of online networks: The strength of intermediary ties in online social media. PloS one 7, 1 (2012), e29358.
- Hermida (2010) Alfred Hermida. 2010. Twittering the news: The emergence of ambient journalism. Journalism practice 4, 3 (2010), 297–308.
- Howell (2013) W. Lee Howell. 2013. Digital Wildfires in a Hyperconnected World. Technical Report Global Risks 2013. World Economic Forum.
- Hubert and Arabie (1985) Lawrence Hubert and Phipps Arabie. 1985. Comparing partitions. Journal of classification 2, 1 (1985), 193–218.
- Jenni Sargent (2017) Managing director: Jenni Sargent. 2017. First Draft Coalition. Website. (2017). https://firstdraftnews.com
- Ju et al. (2014) Alice Ju, Sun Ho Jeong, and Hsiang Iris Chyi. 2014. Will social media save newspapers? Examining the effectiveness of Facebook and Twitter as news platforms. Journalism Practice 8, 1 (2014), 1–17.
- Leskovec (2011) Jure Leskovec. 2011. Social media analytics: tracking, modeling and predicting the flow of information through networks. In Proceedings of the 20th international conference companion on World wide web. ACM, 277–278.
- Newman et al. (2015) Nic Newman, David AL Levy, and Rasmus Kleis Nielsen. 2015. Reuters Institute Digital News Report 2015. Available at SSRN 2619576 (2015).
- Olteanu et al. (2015) Alexandra Olteanu, Carlos Castillo, Nicholas Diakopoulos, and Karl Aberer. 2015. Comparing Events Coverage in Online News and Social Media: The Case of Climate Change. ICWSM 15 (2015), 288–297.
- Papadopoulos et al. (2012) Symeon Papadopoulos, Yiannis Kompatsiaris, Athena Vakali, and Ploutarchos Spyridonos. 2012. Community detection in social media. Data Mining and Knowledge Discovery 24, 3 (2012), 515–554.
- Pons and Latapy (2006) Pascal Pons and Matthieu Latapy. 2006. Computing communities in large networks using random walks. Journal of Graph Algorithms and Applications 10, 2 (2006), 191–218.
- Qazvinian et al. (2011) Vahed Qazvinian, Emily Rosengren, Dragomir R Radev, and Qiaozhu Mei. 2011. Rumor has it: Identifying misinformation in microblogs. In Proceedings of the Conference on Empirical Methods in Natural Language Processing. Association for Computational Linguistics, 1589–1599.
- Quattrociocchi et al. (2016) Walter Quattrociocchi, Antonio Scala, and Cass R Sunstein. 2016. Echo Chambers on Facebook. Available at SSRN (2016).
- Raghavan et al. (2007) Usha Nandini Raghavan, Réka Albert, and Soundar Kumara. 2007. Near linear time algorithm to detect community structures in large-scale networks. Phys. Rev. E 76 (Sep 2007), 036106. Issue 3. DOI:http://dx.doi.org/10.1103/PhysRevE.76.036106
- Rand (1971) William M Rand. 1971. Objective criteria for the evaluation of clustering methods. Journal of the American Statistical association 66, 336 (1971), 846–850.
- Romero et al. (2011) Daniel M Romero, Brendan Meeder, and Jon Kleinberg. 2011. Differences in the mechanics of information diffusion across topics: idioms, political hashtags, and complex contagion on twitter. In Proceedings of the 20th international conference on World wide web. ACM, 695–704.
- Rosvall et al. (2009) Martin Rosvall, Daniel Axelsson, and Carl T Bergstrom. 2009. The map equation. The European Physical Journal Special Topics 178, 1 (2009), 13–23.
- Schmidt et al. (2017) Ana Lucía Schmidt, Fabiana Zollo, Michela Del Vicario, Alessandro Bessi, Antonio Scala, Guido Caldarelli, H. Eugene Stanley, and Walter Quattrociocchi. 2017. Anatomy of News Consumption on Facebook. (to appear in) Proceedings of the National Academy of Sciences (2017).
- Sunstein (2002) Cass R Sunstein. 2002. The law of group polarization. Journal of political philosophy 10, 2 (2002), 175–195.
- Ugander et al. (2012) Johan Ugander, Lars Backstrom, Cameron Marlow, and Jon Kleinberg. 2012. Structural diversity in social contagion. Proceedings of the National Academy of Sciences 109, 16 (2012), 5962–5966.
- Zollo et al. (2015a) Fabiana Zollo, Alessandro Bessi, Michela Del Vicario, Antonio Scala, Guido Caldarelli, Louis Shekhtman, Shlomo Havlin, and Walter Quattrociocchi. 2015a. Debunking in a World of Tribes. arXiv preprint arXiv:1510.04267 (2015).
- Zollo et al. (2015b) Fabiana Zollo, Petra Kralj Novak, Michela Del Vicario, Alessandro Bessi, Igor Mozetič, Antonio Scala, Guido Caldarelli, and Walter Quattrociocchi. 2015b. Emotional dynamics in the age of misinformation. PloS one 10, 9 (2015), e0138740.