Sorbonnelaan 2, 3584 CA Utrecht, The Netherlands
11email: i.urdampilleta@sron.nl 22institutetext: Leiden Observatory, Leiden University
PO Box 9513, 2300 RA Leiden, The Netherlands
X-ray emission from thin plasmas
Every observation of astrophysical objects involving a spectrum requires atomic data for the interpretation of line fluxes, line ratios, and ionization state of the emitting plasma. One of the processes that determines it is collisional ionization. In this study, an update of the direct ionization (DI) and excitation-autoionization (EA) processes is discussed for the H to Zn-like isoelectronic sequences. In recent years, new laboratory measurements and theoretical calculations of ionization cross-sections have become available. We provide an extension and update of previous published reviews in the literature. We include the most recent experimental measurements and fit the cross-sections of all individual shells of all ions from H to Zn. These data are described using an extension of Younger’s and Mewe’s formula, suitable for integration over a Maxwellian velocity distribution to derive the subshell ionization rate coefficients. These ionization rate coefficients are incorporated in the high-resolution plasma code and spectral fitting tool SPEX V3.0.
Key Words.:
Atomic data – Plasmas – Radiation mechanisms: general – X-rays: general1 Introduction
In calculations of thermal X-ray radiation from hot optically thin plasmas, it is important to have accurate estimates of the ion fractions of the plasma, since the predicted line fluxes sometimes depend sensitively on the ion concentrations. The ion concentrations are determined from the total ionization and recombination rates. In this paper, we focus on collisional ionization rates. Radiative recombination rates (Mao & Kaastra 2016) and charge exchange rates (Gu et al. 2016) are treated in separate papers. These rates are essential for the analysis and interpretation of high-resolution astrophysical X-ray spectra, in particular for the future era of X-ray astronomy with Athena.
An often used compilation of ionization and recombination rates is given by Arnaud & Rothenflug (1985), AR hereafter. AR treat the rates for 15 of the most abundant chemical elements. Since that time, however, many new laboratory measurements and theoretical calculations of the relevant ionization processes have become available. A good example is given by Arnaud & Raymond (1992), who re-investigated the ionization balance of Fe using new data. Their newly derived equilibrium concentrations deviate sometimes even by a factor of 2–3 from AR. The most recent review has been performed by Dere (2007), D07 hereafter. D07 presents total ionization rates for all elements up to the Zn isoelectronic sequence that were derived mainly from laboratory measurements or Flexible Atomic Data (FAC, Gu 2002) calculations.
Motivated by the findings of AR and D07, we started an update of the ionization rates, extending it to all shells of 30 elements from H to Zn. Since we want to use the rates not only for equilibrium plasmas but also for non-equilibrium situations, it is important to know the contributions from different atomic subshells separately. Under non-equilibrium conditions inner shell ionization may play an important role, both in the determination of the ionization balance and in producing fluorescent lines.
In the following Sect. 2, we give an overview of the fitting procedure used in this work. In Sect. 3, we review the ionization cross-sections obtained from experimental measurements or theoretical calculations along isoelectronic sequences. Details of the ion rate coefficients analytical approach are given in Sect. 4, Appendix B and C. In Sect. 5 we compare and discuss the results of this work. The references used for the cross-sections are included in Appendix A.
2 Fitting procedure
Collisional ionization is mainly dominated by two mechanisms: direct ionization (DI), where the impact of a free electron on an atom liberates a bound electron; and excitation-autoionization (EA), when a free electron excites an atom into an autoionizing state during a collision.
2.1 Direct Ionization cross-sections
An important notion in treating DI is the scaling law along the isoelectronic sequence, as first obtained by Thomson (1912):
| (1) |
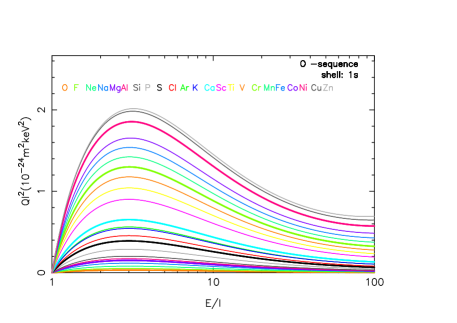
where with (keV) the incoming electron energy and (keV) the ionization potential of the atomic subshell; ( m2) is the ionization cross-section. The function does not – in lowest order – depend upon the nuclear charge of the ion, and is a unique function for each subshell of all elements in each isoelectronic sequence.
Direct ionization cross-sections are most readily fitted using the following formula, which is an extension of the parametric formula originally proposed by Younger (1981a):
| (2) |
The parameters , , and are in units of m2keV2 and can be adjusted to fit the observed or calculated DI cross-sections, see Section 2.3 for more details. is a relativistic correction discussed below. is the Bethe constant and corresponds to the high energy limit of the cross-section.
The parameter is given by Younger (1981c):
| (3) |
where is the photo-ionization cross-section of the current subshell, the ionization energy of Hydrogen and the fine structure constant. The Bethe constants used in this paper are derived from the fits to the Hartree-Dirac-Slater photoionization cross-sections, as presented by Verner & Yakovlev (1995).
As mentioned above, Eq. 2 is an extension of Younger’s formula, where we have added the term with . The main reason to introduce this term is that in some cases the fitted value for , as determined from a fit over a relatively low energy range, differs considerably from the theoretical limit for as determined from (3). For example, AR give = 12.0 m2keV2 for their fit to the 2p cross-section of C I, while the Bethe coefficient derived from (3) is 6.0 m2keV2. However, if we fix to the Bethe value in the fit, the resulting fit sometimes shows systematic deviations with a magnitude of 10% of the maximum cross-section. This is because the three remaining parameters , and are insufficient to model all details at lower energies. Therefore, we need an extra fit component which, for small is close to but vanishes for large , to accommodate for the discrepancy in .
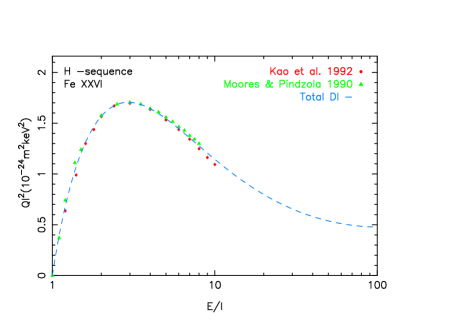
The relativistic correction in (2) becomes important for large nuclear charge (or equivalently large ionization potential ) and large incoming electron energy (Zhang & Sampson 1990; Moores & Pindzola 1990; Kao et al. 1992). This expression is only valid for the midly relativistic ( 1, where ) regime. Our approximations and cross-sections do not apply to the fully relativistic regime ( 1). The presence of this correction is clearly visible for the hydrogen and helium sequences, as shown in Fig. 2. Using a classical approach the relativistic correction can be written here as given by, for example, Quarles (1976) and Tinschert et al. (1989):
| (4) |
where , with the rest mass of the electron and the speed of light. The above correction factor , when applied to the simple Lotz-approximation (Lotz 1967), is consistent with the available observational data for a wide range of nuclear charge values (=1–83) and 5 magnitudes of energy, within a range of about 15% (Quarles 1976).
For the present range of ions up to Zn (=30), the ionization potential is small compared to and, hence, is small. On the other hand, we are interested in the cross-section up to high energies (100 keV) that applies to the hottest thin astrophysical plasmas, and therefore is not always negligible. By making a Taylor’s expansion in of (4) for small we obtain
| (5) |
We will use this approximation (5) in our formula for the DI cross-section (2).
Therefore, it is evident from (6) that the fit parameters to must satisfy the constraint . Further, the Bethe constant gives the asymptotic behaviour at high energies.
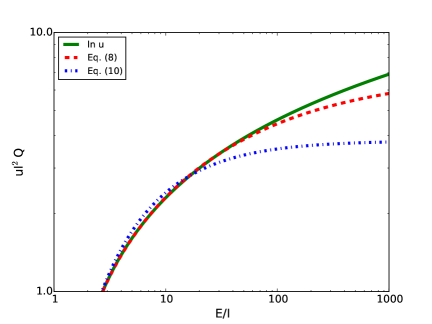
It appears that when is not too large, can be decomposed as (see Fig. 1)
| (8) | |||||
Equation 8 has a relative accuracy that is better than 1, 3, and 16% for smaller than 50, 100, and 1000, respectively; and the corresponding cross-section contribution deviates never more from the true cross-section than 0.5% of the corresponding maximum cross-section (which occurs at ).
In all cases, where we do not fit the cross-section, based on Equation 8, we use the following expression for the calculation of Younger’s formula parameter (with , , , and ), as given by the parameters of the isoelectronic sequence that we use as reference. For example, the Li-sequence is used as reference for the 1s cross-sections of the Be to Zn-sequences as detailed in Section 3.4.1.
| (9) |
This assures that, for most of the lower energies, the scaled cross-section is identical to the reference cross-section, while at high energies it has the correct asymptotic behaviour.
In some cases, we can get acceptable fits with . In these cases, we obtain a somewhat less accurate approximation for the logarithm:
| (10) | |||||
Equation 10 has a relative accuracy better than 14, 23, and 45% for smaller than 50, 100, and 1000, respectively; and the corresponding cross-section never deviates more from the true cross-section than 5.6% of the maximum cross-section (which occurs at ).
In the case of , the equivalent of Equation 9 becomes
| (11) |
2.2 Excitation-autoionization cross-sections
The excitation-autoionization (EA) process occurs when a free electron excites an atom or ion during a collision. In some cases, especially for the Li and Na isoelectronic sequence, the excited states are often unstable owing to Auger transitions, leading to simultaneous ejection of one electron and decay to a lower energy level of another electron. Many different excited energy levels can contribute to the EA process. In general, this leads to a complicated total EA cross-section, showing many discontinuous jumps at the different excitation threshold energies. Since in most astrophysical applications we are not interested in the details of the EA cross-section, but only in its value averaged over a broad electron distribution, it is reasonable to approximate the true EA cross-section by a simplified fitting formula.
The EA cross-section is most readily fitted using Mewe’s formula, originally proposed to fit excitation cross-sections by Mewe (1972):
| (12) |
where with the incoming electron energy; is the EA cross-section. The parameters to and can be adjusted to fit the observed or calculated EA cross-sections. We note that Arnaud & Raymond (1992) first proposed to use this formula for EA cross-sections, although they used a slightly different definition of the parameters.
For the Li, Be, and B isoelectronic sequences, we used the calculations of Sampson & Golden (1981). All the necessary formulae can be found in their paper. The scaled collision strengths needed were obtained from Golden & Sampson (1978), Table 5. For these sequences, we used the sum of two terms with Eq. 12, the first term corresponding to excitation 1s-2 and the second term corresponding to all excitations 1s- with . The total fitted EA cross-section deviates no more than 5% of the maximum EA contribution, using the exact expressions of Sampson & Golden. Since, for these sequences, the EA contribution is typically less than 10% of the total cross-section, our fit accuracy is sufficient given the systematic uncertainties in measurements and theory.
For the Na to Ar isoelectronic sequences, AR recommends to extend the calculations for the Na-sequence of Sampson (1982) to the Mg-Ar sequences. In doing so, they recommend to put all the branching ratios to unity. We follow the AR recommendations and use the method described in Sampson (1982), extended to the Mg-Ar sequences, to calculate the EA cross-section. We consider the branching ratio unity for these calculations. We include excitation from the 2s and 2p subshells to the s, p, and d subshells with ranging from 3–5. We then fit these cross-sections to Eq. 12, splitting it into two components: transitions towards and . The advantage of this approach is that we can estimate the EA contribution for all relevant energies. Other theoretical EA calculations are often only presented for a limited energy range.
For the K to Cr isoelectronic sequences we obtain the EA parameters by fitting to Eq. 12 the FAC EA cross-sections of D07, which are the same used by CHIANTI.
2.3 Fitting experimental and theoretical data
The main purpose of our fitting procedure is to obtain the parameters , , and of Eq. 2 for all inner and outer shells that contribute to DI process, together with the EA parameters, which are calculated as explained above.
For the H and He-sequences, the DI parameters are obtained directly by fitting the cross-sections from experimental measurements and theoretical calculations listed in Appendix A. The rest of sequences include the DI contribution of the outer and one or several inner shells. In this case, we cannot perform a direct fit to the data because most papers in the literature only present the total cross-sections, which are not split into subshells, while our purpose is to obtain the individual outer and inner shell cross-sections separately.
For this reason, we calculate first the EA and inner shell DI parameters and cross-sections. The particular method used for each isoelectronic sequence is explained in Sect. 3. Afterwards, to obtain the outer shell cross-section (for example for the Li-like sequence, 2s), we subtract the inner shell (in the Li-like case, 1s) and EA contributions from total cross-section. We then fit this outer shell contribution using Eq. 2 and obtain the parameters , , and .
The remaining cross-sections, for which no data are present are obtained, using Eq. 2 with interpolated or extrapolated DI parameters. In this case, , , and are calculated by applying linear interpolation or extrapolation of the DI parameters derived from the fitting of experimental or theoretical data along the same shell and isoelectronic sequence. The parameter is always calculated using Eq. 3.
3 Ionization cross-sections
The detailed discussion of the available data used for fitting the cross-sections can be found in the following subsections. In general, we follow the recommendations of AR and D07 in selecting the most reliable data sets, but also other reviews like Kallman & Palmeri (2007) have been take into account. We do not repeat their arguments here, therefore only the relevant differences in the selection criteria and application in the code have been highlighted . Moreover, the multi-searching platform GENIE111https://www-amdis.iaea.org/GENIE/ has additionally been used as cross-check. The references for the cross-section data sets used for each isoelectronic sequence (experimental data or theoretical calculation ) are listed in Appendix A.
3.1 H isoelectronic sequence
The cross-sections for this sequence include only the direct ionization process from the 1s shell. For He II, the cross-sections of Peart et al. (1969) have been selected instead of Dolder et al. (1961), Defrance et al. (1987) and Achenbach et al. (1984), because they have a larger extension to the highest energies and an acceptable uncertainty of 12%, compared to Dolder et al. (1961) with 25%.
Relativistic effects are important for the high elements of this sequence. This is the reason why the relativistic cross-sections of Kao et al. (1992) and Fontes et al. (1999) for Ne X; Kao et al. (1992) and Moores & Pindzola (1990) for Fe XXVI; and Moores & Pindzola (1990) for Cu XXIX have been chosen. They are, in general, around 5–10% larger than the non-relativistic ones. These effects are mainly present for high elements of the H and He isoelectronic sequences, as can be seen in Fig. 2, where the total DI normalized cross-section of Fe XXVI is shown. For this ion the cross-section increases asymptotically with the energy beyond . The measurements of O’Rourke et al. (2001) for Fe XXVI has been neglected because they present a considerable experimental error and are in poor agreement with the selected calculations.
The cross-section comparison of this sequence with D07 shows a good agreement for all the elements except for Be IV. We calculate by linear interpolation in between Li III and B V, which are fitted by experimental measurements. The value at the peak for our interpolation is 20% lower than the values used by D07. However, it follows a smooth increase, which is consistent with the trend of the rest of the elements in this sequence.
3.2 He isoelectronic sequence
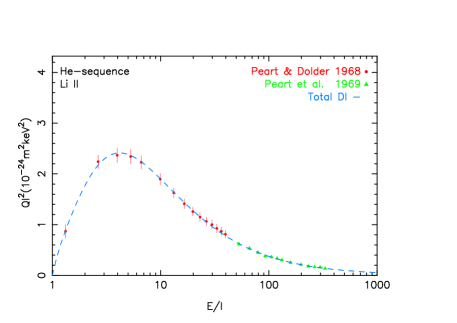
The He-like ions have an 1s2 structure and the DI process includes ionization of the 1s shell. For He I, the experimental data of Shah et al. (1988) and Montague et al. (1984b) have been used together with the more recent measurements of Rejoub et al. (2002). These data sets are in very good agreement with the cross-sections presented in Rapp & Englander-Golden (1965), although the value at the peak is 6% lower. The final fit has an uncertainty less than 6%. For Li II, the measurements of Peart & Dolder (1968) and Peart et al. (1969) were selected, as shown in Fig. 3, an example of the 1s shell DI fitting. For Be III the same difference with D07 as described for the H-like sequence occurs as well. The peak value using our linear interpolation in is 30% lower than D07.
Since the data range for Ne IX, as measured by Duponchelle et al. (1997), is rather limited, we have supplemented their data by adding the cross-sections at as interpolated from the calculations of Zhang & Sampson (1990) for O VII and Fe XXV.
The relativistic calculations for O VII, Fe XXV, and Zn XXIX of Zhang & Sampson (1990) yield cross-sections that are about 15% larger at the higher energies than the corresponding cross-sections interpolated from the theoretical results for N, Na and Fe (Younger 1981a, 1982a). This is similar to what we find for the H-like sequence, and is in agreement with the relativistic effects expected for high elements.
3.3 Li isoelectronic sequence
Li sequence ions have a structure of 1s22s and can experience DI in both the 1s and 2s shell with a significant presence of an EA contribution in the outer shell, mainly for highly ionized elements. The DI and EA cross-sections are calculated with the equations described in Section 2.1 and 2.2, respectively.
3.3.1 DI: 1s cross-sections
Younger (1981a) showed that, except for the lower end of the sequence, the cross-sections are similar to the values for the He-sequence. This is confirmed by the work of Zhang & Sampson (1990) for O, Fe, Zn, and U. Wherever needed, we have corrected for a difference in the Bethe constant between the He-like and Li-like sequence using Eq. 11. We note that, again for Ni, the cross-sections of Pindzola et al. (1991) are 15–25% lower than those of Zhang & Sampson (1990).
3.3.2 DI: 2s cross-sections
For Li I, we follow the recommendations of McGuire (1997) and we fit the convergent close-coupling calculations of Bray (1995) below 70 eV, together with the measurements of Jalin et al. (1973) above 100 eV.
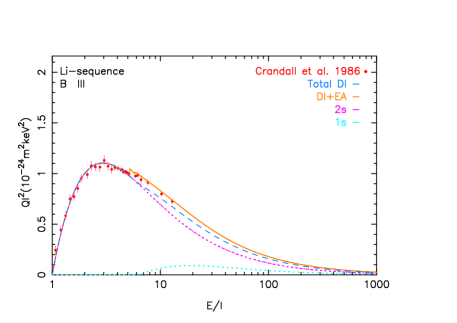
For B III, C IV, N V, O VI, and F VII, high resolution measurements exist near the EA threshold (Hofmann et al. 1990). These measurements are systematically higher than the measurements of Crandall et al. (1979) and Crandall et al. (1986), ranging from 9% for B III, 24% for N V to 31% for O VI. Moreover, for C IV Hofmann’s data above the EA onset are inconsistent in shape with both Crandall’s measurements and the calculations of Reed & Chen (1992). Therefore we did not use the measurements of Hofmann et al. (1990).
For N V, the measurements of Crandall et al. (1979) are 10% smaller than Defrance et al. (1990) below 300 eV, but 10% larger above 1000 eV. In the intermediate range, where the EA onset occurs, the agreement is better than 5%. We used Crandall et al. (1979), together with the high energy data of Donets & Ovsyannikov (1981).
For O VI, the measurements of Crandall et al. (1986) are 10% smaller than those of Defrance et al. (1990) below 450 eV and above 800 eV. In the intermediate range, where the EA onset occurs the agreement is good. We have used both data sets in our fit, but scaled the measurements of Defrance et al. by a factor of 0.95, and also we have included the high energy data of Donets & Ovsyannikov (1981). Using the statistical errors in the data sets, the relative weights used in the fit are approximately 5:1:2 for Crandall et al., Defrance et al., and Donets & Ovsyannikov, respectively.
For Fe XXIV and Zn XXVIII, we again considered the relativistic calculations of Zhang & Sampson (1990). Their scaled cross-sections for O VI, Fe XXIV, and Zn XXVIII are not too different; therefore we interpolate linearly in all elements between Ne and Fe, and similarly between Fe and Zn.
For Ti to Fe, measurements also exist at about 2.3 times the ionization threshold (Wong et al. 1993) with an uncertainty of 10%, which are also proposed by D07. The ratio of these observed cross-sections to the calculations are 0.83, 0.81, 0.85, 0.84, and 0.97, respectively for 22–26. Given the measurement uncertainty, and the agreement of the calculations of Zhang & Sampson in the region of overlap with those of Chen & Reed (1992), we finally decided to use the calculations of Zhang & Sampson.
As for the 1s cross-sections in the H, He, and Li sequences, the cross-sections of Younger (1982a) for Fe XXIV are 5% smaller than those of Zhang & Sampson at the highest energies, instead of the typically 15% for the 1s cross-sections. Thus relativistic effects are slightly less important, which can be understood given the lower ionization potential for the 2s shell, compared to the 1s shell.
3.3.3 EA contribution
Fits to the calculations of Sampson & Golden (1981) were used to approximate the shape of the EA contribution. The contributions, which are due to excitation towards =2, 3, 4, and 5, are treated separately. A comparison of the results of Sampson & Golden ) with the more sophisticated calculations of Reed & Chen (1992) and Chen & Reed (1992) () just above the excitation threshold for = 6, 9, 18, 26, and 36 gives for the ratio values of 0.52, 0.64, 0.77, 1.18, and 2.02, respectively. The following approximation has been made to these data:
| (13) |
A similar tendency is noted by AR. A more detailed analysis shows that for larger energies the discrepancy is slightly smaller. Unfortunately, Reed & Chen and Chen & Reed only give the EA cross-section near the excitation thresholds. Therefore, we decided to retain the calculations of Sampson & Golden (1981), but to scale all EA cross-sections using Eq. 13. We note that, for this isoelectronic sequence, the EA contribution is, in general, smaller than 10%, and thus slight uncertainties in the EA cross-section are not very great in the total ionization cross-section. Figure 4 shows an example of Li-like ion cross-sections scaling.
3.4 Be isoelectronic sequence
The Be sequence elements have a structure of 1s22s2 and can experience DI through collisions in the 1s and 2s shells. There is also an EA contribution. Moreover, in experimental data, some elements, like C III, N VI, and O V often show a high population of ions in metastable levels 1s22s2p.
3.4.1 DI: 1s cross-sections
The 1s cross-sections for all elements in the Be to Zn isoelectronic sequences have been calculated with Eq.11 and, using as a reference, the parameters obtained for the 1s inner shell of Li-like ions. An example can be seen in Fig. 5 for the oxygen isoelectronic sequence.
A comparison of some K-shell measurements compiled by Llovet et al. (2014), for example for C I, Al I, and Ti I (Limandri et al. 2012), demonstrated a good agreement with the maximum difference between the measurements and the calculations with (11) at the peak for Ti I of less than 15%.
3.4.2 DI: 2s cross-sections
The measurements in this sequence are often greatly affected by metastable ions (see the discussion in AR). As mentioned in Loch et al. (2003) and Loch et al. (2005), it is essential to know the ratio of the metastable configuration for an accurate determination of the ground-state cross-section.
D07 proposes using the measurements of Falk et al. (1983a) for B II, which we discard owinge to the existence of a significant population of ions in metastable levels, which results in a ground-state cross-section higher than that proposed by Fogle et al. (2008) for C III, N IV, and O V. Fogle’s measurements use the crossed-beam apparatus at Oak Ridge National Laboratory. In this experiment, it was possible to measure the metastable ion fractions present in the ion beams in the 1s22s2p levels, which were used to infer the rate coefficients for the electron-impact single ionization from the ground state and metastable term of each ion. Considering these mentioned rates in the paper for the ground cross-sections calculations, they are in good agreement (error of 7% for C III and 2% for N IV and O V) with the cross-sections obtained by the Younger (1981d) theoretical calculation. The measurements of Loch et al. (2003) for O V have been neglected because it was not possible to determine the metastable fraction at the experimental crossed-beam.
The measurements of Bannister for Ne VII are consistent with the Duponchelle et al. (1997) ones at high energies, but show a bump around 280 eV, and are finally rejected. For S XIII, Hahn et al. (2012a) eliminated all metastable levels using hyperfine induced decays, combined with an ion storage ring, obtaining a total cross-section with uncertainty of 15%. The measurements are in very good agreement with the theoretical data of Younger (1981c) and distorted-wave calculation of D07.
Lacking more reliable measurements for this isoelectronic sequence, and given the reasonable agreement with the measurements for Ne VII, we base our cross-sections on the theoretical calculations of Younger (Younger 1981d, 1982a) for F VI, Ar XV, and Fe XXIII. The calculations of Fe XXIII have been multiplied by a scaling factor of 1.05, to account for these effects, as are present in the Li-sequence for 2s electrons.
3.4.3 EA contribution
For all ions of this sequence, we also include the EA contribution according to Sampson & Golden (1981), although the contribution is small (in general smaller than 5%). A comparison of the results of Sampson & Golden ) with the more recent calculations of Badnell & Pindzola (1993) (), which include calculations for only Fe, Kr, and Xe just above the 1s-2p excitation threshold, was performed. This shows a systematic trend that can be approximated by
| (14) |
We assume that the rest of the elements of this isoelectronic sequence present the same behaviour. Therefore, we use the calculations of Sampson & Golden (1981), but scale all EA cross-sections to the results of Badnell & Pindzola using (14).
3.5 The B isoelectronic sequence
The elements of the B-like sequence (1s22s22p) have an EA contribution in the outer shell that is relatively small (Yamada et al. 1989a; Duponchelle et al. 1997; Loch et al. 2003).
3.5.1 DI: 2s cross-sections
Younger (1982a) shows that, for the iron ions of the Be to Ne sequences, the 2s cross-section is approximately a linear function of the number of the 2p electrons present in the ion. Following AR, we assume such a linear dependence to hold for all ions of these sequences. Thus, from the 2s cross-sections for the Be-sequence and those of the Ne-sequence, the 2s cross-sections for all ions between Na–Zn for intermediate sequences (B-like, C-like, N-like, O-like, and F-like) are obtained by linear interpolation plus the Bethe coefficient difference correction applying Eq. 9.
For ions of B to F in the B-F isoelectronic sequences, we cannot use the above interpolation since, in this case, there are no ions in the Ne-sequence. AR assume that the 2s cross-section of the Ne-sequence minus the 2s cross-section of the Be-sequence depends linearly upon the atomic number ; since our procedure is slightly different from Arnaud & Rothenflug, we cannot confirm clear linear trends in our data. For that reason, we use for the ions from B to F a linear extrapolation of the difference coefficients given by AR:
| (15) |
where is the atomic number and , and are in units of m2keV2.
3.5.2 DI: 2p cross-sections
For B I, we included the CHIANTI data obtained from Tawara (2002) (D07). The data of Aitken et al. (1971) for C II are slightly higher than the measurements of Yamada et al. (1989a), especially near the threshold. Nevertheless, we use both data sets in our fit, with a larger weight given to the data of Yamada et al.
For N III, we chose Aitken et al. (1971) and Bannister & Haverner (1996b) proposed by D07 because both data sets extend from near threshold to and, besides, they are in relatively good agreement, except below the peak where the data of Bannister & Haverner (1996b) are 5% higher.
The most recent measurement for the B-sequence is that of Hahn et al. (2010) for Mg VIII. The innovative aspect of the Hahn et al. data is the use of an ion storage ring (TSR) for the measurements. This new experimental technique achieves a radiative relaxation of ions to the ground state after being previously stored long enough in the TSR, decreasing considerably the contribution of possible metastable ions. The data show a 15% systematic uncertainty owing to the ion current measurement. Nevertheless, the data are in good agreement with the distorted-wave calculations with the GIPPER (Magee et al. 1995) and FAC (Gu 2002) codes, within the experimental uncertainties.
The theoretical data for Fe XXII are based upon Zhang & Sampson (1990) for Ne-like iron. Following Younger (1982a), we assume that the scaled 2p cross-section for B-like to Ne-like iron is a linear function of the number of 2p-electrons; we account for the slight difference in 2p1/2 and 2p3/2 cross-sections in the work of Zhang & Sampson. Finally, we use their data for Se (=34) to interpolate the ions between Fe and Zn on these sequences.
3.5.3 EA contribution
For all ions of this sequence, we include the EA contribution according to Sampson & Golden (1981), although the contribution is small (in general less than 2.5%). A comparison of the results of Sampson & Golden ) with the calculations of Badnell & Pindzola (1993) () for Fe, Kr and Xe just above the 1s-2p excitation threshold, shows a systematic trend that can be approximated by
| (16) |
We retain the calculations of Sampson & Golden, but scaled all EAcross-sections to the results of Badnell & Pindzola using Eq. 16.
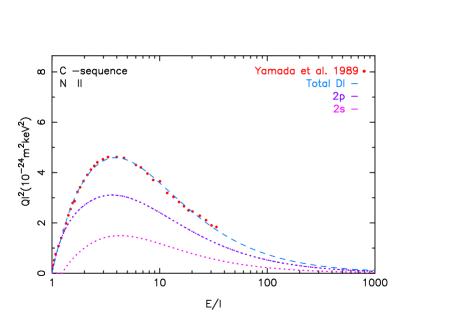
3.6 C isoelectronic sequence
The ions of the carbon isoelectronic sequence (1s22s22p2) can be directly ionized by the collision of a free electron with electrons in the 1s, 2s, and 2p shells; the same holds for all sequences up to the Ne-like sequence. There is no evidence for a significant EA processes in the C to Ne sequences.
3.6.1 DI: 2p cross-section
For O III, we use the measurements of Aitken et al. (1971), Donets & Ovsyannikov (1981), and Falk (1980). The first two are provided up to ten times the threshold. The Aitken et al. (1971) measurements are 15% lower than those of Falk (1980) beyond the cross-section peak. We also use the data of Donets & Ovsyannikov (1981) for the high energy range. Figure 6 shows an example of the DI contribution for the 2s and 2p shells.
3.7 N isoelectronic sequence
3.7.1 DI: 2p cross-section
The measurements for Si VIII (Zeijlmans van Emmichoven et al. 1993) were correctly fitted using Eq. 2, obtaining a maximum uncertainty of 6%. The peak value of Si VIII compared with CHIANTI data is 10% lower. This difference also affects the cross-sections of interpolated components between Ne IV and Si VIII.
The data of Yamada et al. (1989a) for O II are about 5% higher than the older data of Aitken et al. (1971); our fit lies between both sets of measurements. For O II and Ne IV, the high energy measurements of Donets & Ovsyannikov (1981) are significantly higher than our fit, including that data set; we have therefore discarded these measurements for these ions.
3.8 O isoelectronic sequence
3.8.1 DI: 2p cross section
We note that the measurements for Si VII (Zeijlmans van Emmichoven et al. 1993) could be affected by metastable ions that show an increase between 10-20% of the cross-section at the peak compared with the distorted-wave calculations. This is the reason we neglect this data set. For Ne III, we discard the high energy measurements of Donets & Ovsyannikov since these are 30% below our fit including those data.
3.9 F isoelectronic sequence
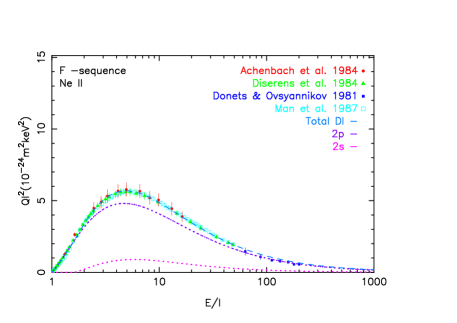
3.9.1 DI: 2p cross-section
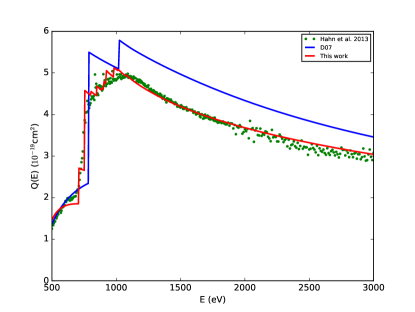
The Yamada et al. (1989a) measurements were included for F I up to . The most recent measurements in this sequence are from Hahn et al. (2013) for Fe XVIII up to energies of . The measurements given by Hahn et al. (2013) are 30% lower than the values provided by Arnaud & Raymond (1992) and 20% lower than D07. This is achieved by the new experimental technique of the ion storage ring. We combine these data with the theoretical calculations of Zhang & Sampson (1990) for high energies. These theoretical data were obtained directly from the total cross-section modelling for the 2p shell, as explained in Section 3.5.2. The Fig. 7 above shows the DI fitting of four different experimental measurements for Ne II.
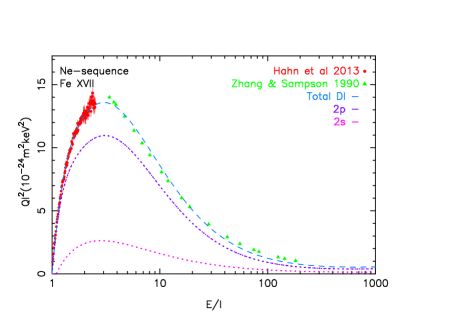
3.10 Ne isoelectronic sequence
3.10.1 DI: 2s cross-section
For Na, Mg and Al Younger (1981c) calculates the 2s cross-sections in the Na-like sequence. For the high end of the sequence (Ar and Fe), the difference between the Ne-like and Na-like 2s cross-section is, in general, at most a few percent. Accordingly, we assume that, for the low end of the Ne-sequence, the shape of the cross-section is at least similar to that of the Na-sequence.
Therefore, we have extrapolated the Na-like data of Younger (1981c) to obtain the cross-sections of Na II, Mg III, Al IV, P VI, and Ar IX. We found that the ratio of the Ne-like to the Na-like 2s cross-section is about 1.38, 1.23, 1.06, and 1.00 for the elements Na, Mg, Al, and Ar. We included a scaling factor of 1.00 for P. Our adopted 2s ionization cross-section for the Ne-like ions Na II, Mg III, Al IV, P VI, and Ar IX are thus based upon the corresponding Na-like cross-section, multiplied by the above scaling factors. Lacking other data, for Ne I we simply used the correlation Eq. 3.5.1 between Ne-like and Be-like 2s cross-sections. For the remaining elements from Si and higher, we use linear interpolation in .
3.10.2 DI: 2p cross-sections
We used the calculations of Younger (1981b) for the 2p shell of Al IV instead of the Aichele et al. (2001) measurements because, as they explain, their data contain a 20% contribution from metastable ions contamination.
For Ar IX, we did not use the data of Zhang et al. (1991), because they contain a 3% contribution of a metastable state, which is strongly auto-ionising. The contribution of this metastable state, which is described well by the calculations of Pindzola et al. (1991), makes the measured cross-section 5% higher at 1 keV; however, owing to the complex ionization cross-section of this metastable state, we do not attempt to subtract it, but merely use the data of Defrance et al. (1987) and Zhang et al. (2002) for this ion, which appears to be free of metastable contributions.
We have used the measurements of Hahn et al. (2013) for Fe XVII up to energies close to , together with Zhang & Sampson (1990) for high energies, as in the same case of Fe XVIII, see Fig. 8.
3.11 Na isoeletronic sequence
3.11.1 DI: 2s and 2p cross-section
3.11.2 DI: 3s cross-section
We decided not to include the measurements for Ar VIII (Rachafi et al. 1991; Zhang et al. 2002) and Cr XIV (Gregory et al. 1990), because they are higher and lower, respectively, compared with the other elements on this sequence. The Ar VIII measurements are probably affected by the presence of resonant excitation double Auger ionization (REDA).
Ti XII was fitted using Gregory et al. (1990), although there are only measurements up to . For this reason we included some values from Griffin et al. (1987) calculation for higher energies. The data of Gregory et al. (1990) are about 10% higher than the calculations of Griffin et al. (1987), therefore we decided to apply a scaling factor of 0.9.
For Fe XVI, the measurements of Gregory et al. (1987) and Linkemann et al. (1995) were used, which extend till . The data of Gregory et al. (1987) are 30% higher than those of Linkemann et al. (1995), resulting in a fit with values around 15% higher than proposed by the Griffin et al. (1987). To achieve a better agreement of 5-10%, we applied a scaling factor of 0.9 to the Gregory et al. (1987) measurements. Finally, we included the theoretical calculations of Pindzola et al. (1991) for Ni XVIII, which agree with Griffin et al. (1987) better than 10%.
The total cross-sections obtained with our method are systematically higher than D07 by 10-30%. For several elements, the DI level seems to be of the same order and the main difference is related to EA contributions. A possible explanation could be that we use the calculations of Sampson (1982), which include more excitation transitions (from 2s, 2p, and 3s subshells to the s, p and d subshells with =3–5), while D07 use the FAC EA calculation scaled by a certain factor for excitation into 27 33 and 27 34.
3.11.3 EA contribution
For the low elements of this sequence (Mg II, Al III and Si IV) the theoretical calculations of Griffin et al. (1982) for the EA contribution fail to correctly model the measurements, mainly due to too large 2p3p and 2p4p cross-sections, but also becuase of the presence of REDA contributions in the measured cross-sections (Müller et al. 1990; Peart et al. 1991b). The measured cross-sections show a distinct EA contribution, but not with the sharp edges that are usually produced by theory owing to limitations in the way the EA contribution is calculated. Therefore, we fitted the measured cross-sections of Mg II, Al III, and Si IV to (12) after subtracting the DI contributions.
For Na I and Mg II, there are no signs of the EA onset owing to the regularity of the measurements although some REDA contributions could be present. For Al III and Si IV, we have followed the same procedure chosen by D07 for scaling all the EA cross-sections to recreate the measured values. Therefore, we retained the calculations of Sampson (1982), but scaled by a factor of 0.4 for Al III and 0.5 for Si IV. The rest of elements have been maintained with a scaling factor equal to 1.0.
3.12 Mg isoelectronic sequence
3.12.1 DI: 2s and 2p cross-section
The 2s and 2p cross-sections for all elements from the Mg to Zn isoelectronic sequences have been calculated with Eq. 9 using, as a reference, the parameters obtained for the 2s and 2p subshell, respectively, of the previous isoelectronic sequence. Therefore, for the Mg-sequence, the reference parameters for all elements are taken from the Na-sequence.
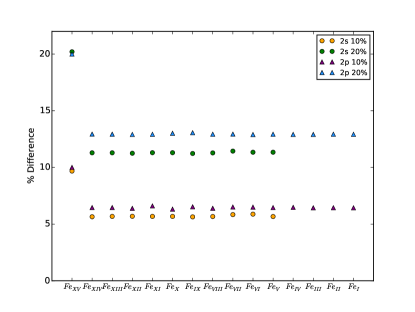
To evaluate the robustness of this method, we introduced a 10% and 20% increase in the to parameters of the Fe XV 2s shell and analysed how it affects the 2s shells of Fe ions for the following isoelectronic sequences. If we compare the difference in the peak of the cross-sections, from the Al to Ti sequences (there is no 2s shell contribution for the V to Fe-sequence) the error is reduced to 5-6% and 11%, respectively. This difference is maintained almost constantly for all the sequences as seen in Fig. 9. We also evaluated the impact in the calculation of the outer shell DI cross-sections using the fitting procedure explained in Section 2.3 and the effects are negligible, being the maximum difference of 0.03%, 0.07%, and 0.06%, for an initial increase of 10%, 20%, and 50%, respectively. The main reason for this behaviour is because the 2s shell cross-sections and their contribution to the single ionization is much lower than the outer shells. Therefore, a variation in the DI parameters of the 2s shell has no appreciable effects on the other shell cross-sections.
We performed the same study for the 2p shell as explained above for the 2s shell. The results are slightly similar and the same conclusions are applicable in this case.
3.12.2 DI: 3s cross-sections
Following the discussion in McGuire (1997), we scaled-down the experimental results for Mg I and Al II by multiplying by a factor of 0.8. For Si III and S V the measurements of Djuric et al. (1993b) and Howald et al. (1986), respectively, were omitted because the measurements present clear evidence of metastable ions.
In the case of Ar VII, the measurements of Chung (1996) do not show evidence of 3s3p 3P metastable ions unlike Djuric et al. (1993b), Howald et al. (1986) and Zhang et al. (2002). However, they only extend up to , where they seem to be in good agreement with Zhang et al. (2002), which contains data till 30 times the threshold. For this reason, we used the Chung (1996) measurement adding the Zhang et al. (2002) cross-sections above .
Bernhardt et al. (2014) present recent measurements for Fe XV in the range 0–2600 eV. Bernhardt et al. use the TSR storage-ring technique, also applied to several measurements of Hahn et al., which allows them to reduce the fraction of metastable ions in the stored ion beam.
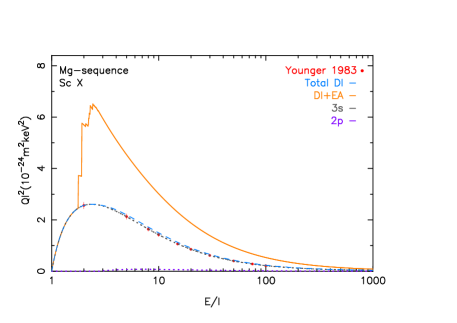
Figure 10 shows the total cross-section calculated as the sum of 3s shell data of Younger (1983) for Sc X with the rest of the inner-shell contributions. In this case, the main contributor to the total DI cross-section is the 3s shell followed by the 2p shell in a very low proportion. The EA contribution was added from Sampson (1982) after applying a scaling factor, as explained in the following section. As in the case of the Na-like sequence, the total cross-section compared to D07 is systematically10-40% higher, probably for the same reason.
3.12.3 EA contribution
For the Mg-sequence, we compared the EA contributions calculated with the method explained in Section 2.2 to other calculations available for 13, 16, 17 and 18 (Tayal & Henry 1986), and 28 (Pindzola et al. 1991). We have compared Sampson’s cross-sections at about twice the EA onset towards these other calculations , and have found the following relation for these elements. We assume the same relation for 14 of the Mg-sequence:
| (17) |
For Al II and Si III the scaling factor is smaller: 0.20. The observations for neutral Mg I (Freund et al. 1990; McCallion et al. 1992a) show no evidence for EA and therefore we neglected this process for neutral Mg. The available measurements (Chung 1996; Bernhardt et al. 2014) show EA enhancements that are consistent with the above scaling.
3.13 Al isoelectronic sequence
3.13.1 DI: 3s cross-sections
For the Al-sequence up to the Ar-sequence the 3s inner-shell contribution is interpolated from the theoretical calculations of Younger (1982a) for Ar, Sc, and Fe ions. For the P-like and S-like sequences, we included the data for Ni ions from Pindzola et al. (1991) because they correctly follow the trend of the rest of the elements in the same sequence, which is not the case for the other sequences.
3.13.2 DI: 3p cross-sections
For Fe XIV, the recent measurements of Hahn et al. (2013) using the TSR ion ring storage confirm the existence of a considerably lower cross-section than previous measurements (Gregory et al. 1987) or calculations (AR; D07). Hahn’s results agree with Gregory’s from threshold up to 700 eV, and after that they decrease until they show a difference of 40%. One of the reason for this difference could be the presence of the metastable ions in Gregory’s experiment. The major discrepancies with the theory could come from the fact that theory overestimates the EA component, specially the transitions, in the case of D07.
3.13.3 EA contribution
For the Al to Ar-sequences, the EA calculations of Pindzola et al. (1991) for Ni ions can be used for comparison with the EA parameters derived from Sampson (1982). The scaling factors needed to bring the Sampson data in accordance with the Pindzola data are given in Table 1. These data show that the scaling factor gets smaller for higher sequences. This is no surprise since Sampson’s calculations were, in particular, designed for the Na-sequence. We note that the relative importance of the EA process diminishes anyway for the higher sequences.
Lacking other information we assumed that, for all other ions of these isoelectronic sequences, the same scaling factors apply as for the Ni-ions. Where there are measurements available with clear indications of the EA process, this scaling appeared to be justified. The possible exception is Ni XIII (S-sequence), where Pindzola et al. (1991) suggest that there is an additional contribution in the measurements of Wang et al. (1988) owing to resonant recombination followed by double autoionization. However, we decided to apply the same process as explained above for calculating the scaling factor of the S-sequence, only taking into consideration the Pindzola data.
| Isoelectronic | Scaling |
| sequence | factor |
| Al | 0.79 |
| Si | 0.81 |
| P | 0.75 |
| S | 0.62 |
| Cl | 0.64 |
| Ar | 0.52 |
3.14 Si isoelectronic sequence
3.14.1 DI: 3p cross-sections
The experimental data available for Ar V (Crandall et al. 1979; Müller et al. 1980; Sataka et al. 1989) agree well below 200 eV but, above this energy, the Crandall et al. data are slightly higher. The three data sets are about 20% larger than expected based upon Younger’s calculations, probably due to some contamination by metastable levels in the beam. For this reason, theoretical calculations were obtained for Ar V, taking the , , and parameters proposed by AR for Younger’s formula.The same situation occurs for Cr XI (Sataka et al. 1989) and the data were discarded.
The measurements of Hahn (Hahn et al. 2011b, 2012b) are used for Fe XIII. These data are 20% lower than the Arnaud & Raymond (1992) calculations and 15% lower above 680 eV, compared with the FAC calculations of D07. The Hahn et al. experimental data show a faster increase of the cross-section in the onset compared with the calculations, probably owing to the excitation of the 3s shell electron, which the calculations did not include. The possible explanation for the higher EA contribution above the threshold proposed by Hahn is that the calculations overestimate the branching ratio of the autoionization and, additionally, the intermediate states could decay by double ionization rather than single ionization.
3.15 P isoelectronic sequence
3.15.1 DI: 3p cross-sections
The measurements of Freund et al. (1990) for P I are used for the 3p cross-section fitting with an error less than 6%. In the case of S II, two data set are available, Yamada et al. (1988) and Djuric et al. (1993a), which agree within . Yamada’s measurements extent up to . However, the cross-section at the peak appears about larger than expected base on the general trend of the elements in this sequence. The measurements are probably affected by metastable ions in the beam. For this reason, we decided to use interpolation for this element. The measurements of Hahn et al. (2011a) are used for Fe XII instead of Gregory et al. (1983) because the latter data are compromised owing to metastable ions in the beam. Hahn’s data are about lower than the data of Gregory et al. (1983) and the calculations of Arnaud & Raymond (1992), and are in agreement with the theoretical cross-section of D07 within .
3.16 S isoelectronic sequence
3.16.1 DI: 3p cross-sections
For Ar III, we followed the discussion in Diserens et al. (1988) and did not include the data of Müller et al. (1980), Mueller et al. (1985), and Danjo et al. (1984),whose data are larger at high energies than the presently adopted data of Diserens et al. (1988) and Man et al. (1993). As explained by Diserens, the increased cross-sections may indicate the presence of metastable ions in the beam.
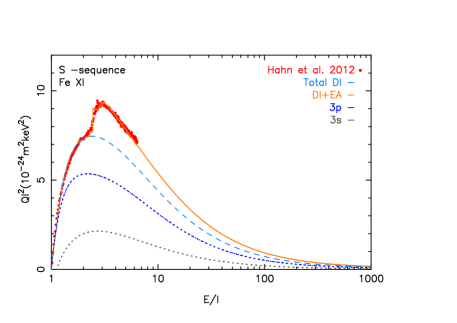
The measurements of Hahn et al. (2012c) for Fe XI are about 35% lower than the Arnaud & Raymond (1992) theoretical calculations and are in reasonable good agreement with D07. The main differences are twofold. First, at 650 eV, a step appears in the cross-section owing to excitations not included in D07; and secondly, for higher energies D07 considers the and EA transitions, resulting in a higher cross-section. However, the experiments do not show evidence for these last processes.
3.17 Cl isoelectronic sequence
3.17.1 DI: 3p cross-sections
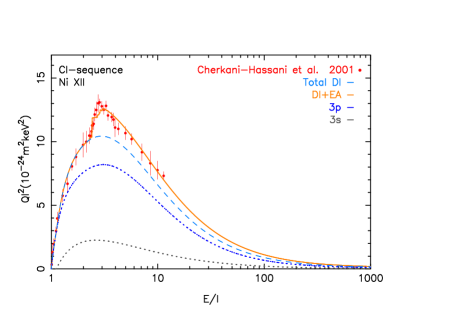
For K III and Sc V, the theoretical calculations of Younger (1982c) for the 3p shell were used. For Ni XII, the measurements of Cherkani-Hassani et al. (2001) and the calculations of Pindzola et al. (1991) seem to be in good agreement, see Fig. 13.
The measurements of Hahn et al. (2012c) are used for Fe X. These are 35% lower than the Gregory et al. (1987) measurements. The theoretical calculations of Arnaud & Raymond (1992) and D07 lie within the experimental uncertainties, although some discrepancies can be found owing to the non-identical EA processes modeling. The reason for these differences are the same as for Fe XI, explained in section 3.16.1.
3.18 Ar isoelectronic sequence
3.18.1 DI: 3p cross-sections
The theoretical data of Younger (1982d) for the 3p shell of Sc IV were taken into account, which are in good agreement with the D07 FAC calculations. Otherwise, for Fe IX recent measurements of Hahn et al. (2016) are available. In this case, the storage ring could not eliminate all the metastable ions from the beam. However, Hahn et al. are able to estimate a metastable fraction of 30% in the 3p53d level and they obtain a new estimated ground state cross-section (subtracting the metastable states from the experimental data), which is 15-40% lower than the AR and D07 calculations, and 20% lower than the total cross-section derived from the Younger (1982d) data for the 3p shell. Owing to those lower values of the total cross-section, the rest of the elements interpolated or extrapolated based on Fe IX will be affected as well by a systematic decrease of their total cross-section.
3.19 K isoelectronic sequence
The K-like (3s23p64s) ions have the 3p and 3d shells as the main contributors to the DI and the EA process is dominated by excitation from 3p63d to the 3p53d levels with . The DI contribution of 4s is taken into account for the elements that have some electrons in the 4s shell, such as K I and Ca II with a structure of 3s23p64s. The same process has been followed for the ions up to the Zn-like sequence that have the 4s shell contribution.
3.19.1 DI: 3s & 3p cross-sections
For the calculation of the 3s and 3p shells DI cross-section contribution, we have followed the same procedure as for the 2s and 2p shells, explained in section 3.12.1. We calculated the , , and parameters with Eq. 9 using, as reference, the parameters of the previous isoelectronic sequence. The same process was applied for all elements from the K-sequence up to the Zn-sequence.
3.19.2 DI: 3d & 4s cross-sections
For K I and Ni X we used the theoretical data of McCarthy & Stelbovics (1983) and Pindzola et al. (1991), respectively, which are well fitted. For Fe VIII, the recent measurements of Hahn et al. (2015) were used, from the ionization threshold up to 1200 eV. They remain 30-40% lower than theoretical calculations of Arnaud & Raymond (1992), based on Pindzola et al. (1987), and are in good agreement (10%) with D07. The reason for these discrepancies are similar to the case of Fe XI, as explained in section 3.16.1.
3.19.3 EA contribution
We adopted the EA parameters calculated by D07 from his FAC EA calculations, which are the same as used by CHIANTI for all the sequences from the K-like up to the Cr-like sequences.
3.20 Ca isoelectronic sequence
3.20.1 DI: 3d & 4s cross-sections
For Ca I we selected three data sets (McGuire 1977, 1997; Roy & Kai 1983) of theoretical calculations. The first two sets of McGuire are in reasonably good agreement, although they are 30% higher than Roy’s. There are no apparent reasons for discarding any of the three sets and therefore we decided to include all of them. For Fe VII we use the sets of Gregory et al. (1986) and Stenke et al. (1999) and forNi IX the calculations of Pindzola et al. (1991) and Wang et al. (1988).
3.21 Sc isoelectronic sequence
3.21.1 DI: 3d & 4s cross-sections
We include measurements of Ti II, Fe VI, and Ni VIII to obtain the DI and EA cross-sections of the scandium (3p63d3) sequence. The rest of the elements are interpolated or extrapolated. For Fe VI, the measurements of Gregory et al. (1987) and Stenke et al. (1999) are in good agreement with our fit. The data sets of Wang et al. (1988) and Pindzola et al. (1991) were used for Ni VIII.
3.22 Ti isoelectronic sequence
3.22.1 DI: 3d & 4s cross-sections
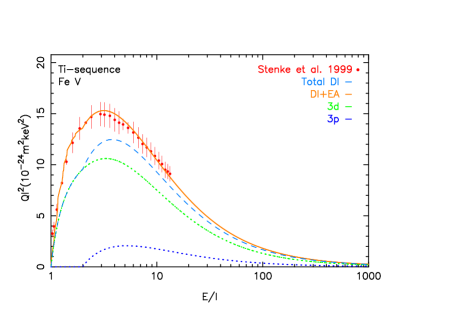
For the titanium sequence (3p63d4) the measurements of Stenke et al. (1999) for the Fe V, as can be seen in Fig. 13, and Ni VII 3d shell, respectively, were selected. In the case of Ti I, with an irregular structure of 3d24s2, the McGuire (1977) theoretical calculations are used to obtain the 4s shell contribution.
3.23 V isoelectronic sequence
3.23.1 DI: 3d & 4s cross-sections
3.24 Cr isoelectronic sequence
3.24.1 DI: 3d & 4s cross-sections
3.25 Mn isoelectronic sequence
3.25.1 DI: 3d & 4s cross-sections
For the manganese sequence (3p63d7) elements 3d shell DI cross-section, we use the theoretical calculation of Younger (1983) for Fe II and the measurements of Gregory et al. (1986) for Ni IV. Since the Fe II element has a ground state configuration of 3d64s, we considered the measurements of the total DI cross-section of Montague et al. (1984a) for subtracting the contribution of the rest of the inner-shells and for obtaining the 4s shell DI cross-sections. Mn I was fitted with data of Tawara (2002) taken from CHIANTI (D07). The remaining elements of the sequence are interpolated.
3.26 Fe isoelectronic sequence
3.26.1 DI: 3d & 4s cross-sections
For Fe I, we included the measurements of Freund et al. (1990) and the FAC DI calculations of D07 for Co II. We use the Pindzola et al. (1991) theoretical calculations for Ni III, which are in good agreement with Stenke et al. (1999) at high energies; and Gregory et al. (1986) for Cu IV. The rest of the elements of the sequence are interpolated.
3.27 Co isoelectronic sequence
3.27.1 DI: 3d & 4s cross-sections
3.28 Ni isoelectronic sequence
3.28.1 DI: 3d & 4s cross-sections
For Ni I (with ground configuration 3d84s2) the Pindzola et al. (1991) and McGuire (1977) data were selected for the 3d and 4s DI contribution, respectively. For Cu II and Zn III, there are no known measurements, therefore, the 3d DI cross-sections were calculated as the extrapolation of Pindzola’s data for Ni I.
3.29 Cu isoelectronic sequence
3.29.1 DI: 3d & 4s cross-sections
The measurements considered for the 4s shell DI fit of the copper sequence (3d104s) are for Cu I, Bolorizadeh et al. (1994) and Bartlett & Stelbovics (2002); and for Zn II, Peart et al. (1991a) and Rogers et al. (1982). The fit is in a reasonably good agreement with the measurements. The 3d shell DI contribution of both elements were calculated with FAC.
3.30 Zn isoelectronic sequence
3.30.1 DI: 3d & 4s cross-sections
For the Zn I ion, which has a 3d104s2 ground configuration, the calculations of Omidvar & Rule (1977) were used for the fit of the 4s DI cross-section contribution instead of McGuire (1977), because they are around 5-10% higher than Omidvar’s values before the cross-section peak and more than 20% lower after, which disagrees with the contribution of the inner-shells. Otherwise, FAC was used forthe 3d DI cross-section calculation.
4 Ionization rate coefficients
In the previous section, we obtained the ionization cross-sections for all subshells of all elements from H to Zn isoelectronic sequence by applying Eq. 2 for DI and Eq. 12 for EA. The total cross-section for DI can be written as the sum of inner-shells, where with the incoming electron energy (in keV) and the ionization potential of the atomic subshell (in keV):
| (18) |
The parameters , , , , and (in units of 10-24m2keV2) for Si-like Fe XI are given in Table E.1.
The direct ionization rate is written as a function of the temperature as
| (19) |
where and are the electron and ion density, respectively, the electron mass, and and are given in Appendix B. The same approach can be taken with the EA process. The EA cross-section contribution to the outer shell of each ion, is the sum of energy level transitions with the excitation-autoionization threshold (in keV):
| (20) |
where , , , , and (in units of 10-24m2keV2) are the parameters obtained for each ion in presence of the EA process.
Moreover, the total excitation-autoionization rate coefficient is expressed as
| (21) |
A detailed description of the and terms of this parametric formula is shown in Appendix C.
The total ionisation rate coefficient is given by the sum of Eq.19 and 21 and includes the contributions from all inner-shells.
5 Discussion
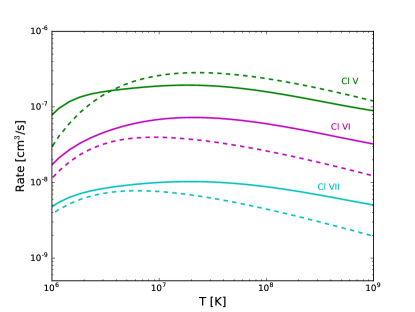
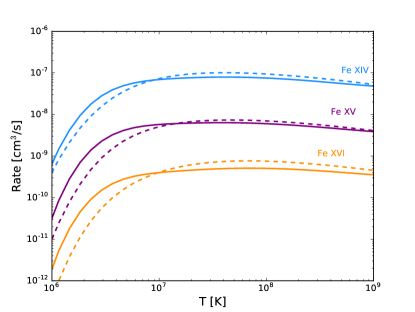
A systematic comparison was made with the Bryans et al. (2009) atomic data, which adopt the D07 electron-impact ionization rates. This shows that the present work and Bryans et al. (2009) rates are in good agreement (differences less than 10-20%) for more than 85% of the elements. The highest differences appear for the isoelectronic sequences of Na, Mg (Si III, P IV, S V and Cl VI), and Al (P III, S IV, Cl V and Ar VI), where some of the ions show a difference of 30-40% in the cross-sections compared with D07. As a consequence, the ionization rates for these ions are up to 2-3 times higher than D07 for high temperatures. An example for Cl is shown in Fig. 14. This difference decreases for high elements as can be seen in Fig. 15 where the ionization rates for Fe are represented.
A possible explanation could be that the D07 cross-sections are mainly calculated with FAC, instead of fitted to experimental data, as performed in the present work (see Appendix A). The measurements represent a more realistic scenario and include more transitions, since REDA or multiple ionization are not usually incorporated in the theoretical calculations.
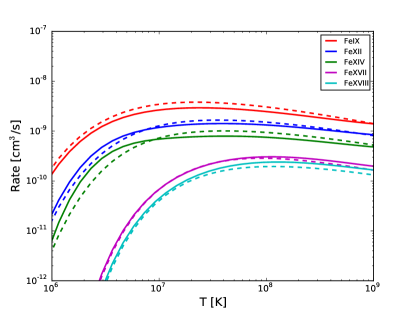
As explained in the previous sections, the most recent experimental measurements included in this work are Fe XVIII, Fe XVII, and Fe XIV (Hahn et al. 2013), Fe XIII (Hahn et al. 2012b), Fe XII (Hahn et al. 2011a), Fe XI and Fe X (Hahn et al. 2012c), Fe IX (Hahn et al. 2016) and Fe VIII (Hahn et al. 2015), and Bernhardt et al. (2014) for Fe XV. They used the new TSR technique to reduce the metastable ion levels to obtain lower cross-sections than AR for all the ions. D07’s cross-sections are about 20% higher than Hahn’s for Fe XIV, Fe XIII, Fe XII, Fe XI, Fe X, Fe IX, and Fe VIII. For the other ions, the cross-sections are comparable, with the difference that the D07 EA threshold is located at higher energy, probably because D07 does not include the excitations, see Fig. 16.
Figure 17 contains the ionization comparison rates for some ions: Fe XVIII, Fe XVII, Fe XIV, Fe XII, and Fe IX. The plot shows that the ionization rates are similar or lower than D07, as expected from the experimental measurements. For Fe XI to Fe XV we obtain a higher value than D07 for low temperature. The reason for this is probably that, at low temperature, the rates are very sensitive to the weighting of the cross-section with the Maxwellians velocity and a small variance in the cross-section fit at low energies could have a major impact in this region.
The major impact of the new cross-sections used in this work is on the ion fractions obtained by the ionization balance. As an example, we compared the ion fractions from Bryans et al. (2009) with the present work for all ions of Fe. In this comparison, we used the same recombination rates as Bryans et al. (2009), so the only differences are the ionization rates.
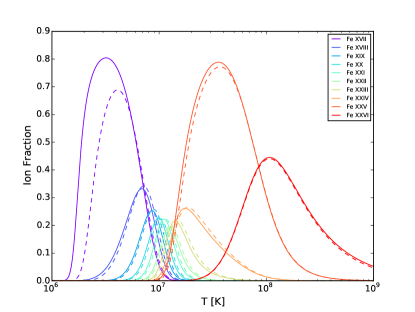
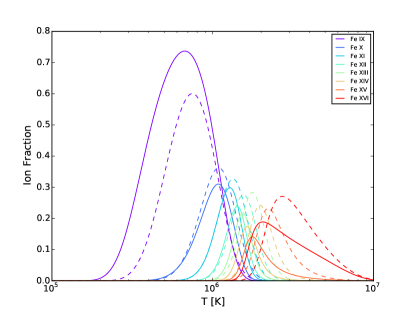
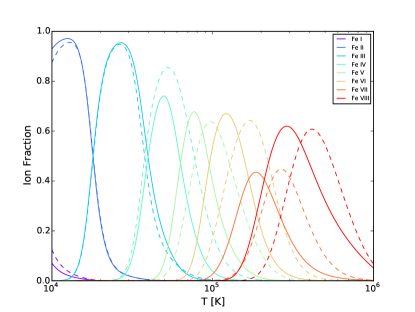
Fig. 18 (top) shows the first ten ions from Fe XXVI to Fe XVII. The ion fraction is relatively similar for all ions, except for Ne-like Fe XVII. The lower temperature ionic fraction in this work is clearly higher than using Bryans et al. (2009). This is mainly influenced by ions of adjacent isoelectronic sequences such as Na-like or Mg-like, which have higher ionization rates, as explained above.
Figure 18 (middle) presents the ion fraction for Fe IX up to Fe XVI. In this case, there is a more appreciable difference. The peak ion concentration in the present work is lower than in Bryans et al. and it seems to be slightly displaced to lower temperatures. However, for Fe XVI the ion concentration behaviour is similar to Fe XVII. The least ionized Fe (Fe VIII up to Fe I) ion fractions are plotted in Fig. 18 (bottom). From Fe VIII to Fe VI, the values at the peak of the ion fractions are similar but they are displaced at lower temperatures around 104-105 K. For Fe III, the value at the peak is 20% lower. The Fe I and Fe II ions are in good agreement.
6 Summary and conclusions
We produced a complete set of electron direct collisional ionization cross-sections together with excitation-autoionization cross-sections. We were able to obtain not only the total cross-sections, such as D07, but all the individual inner shells cross-section of all elements from the H to Zn isoelectronic sequences. They were obtained from experimental measurements, theoretical calculations, and interpolation/extrapolation among the data sets. We incorporated the most recent experimental measurements available at the moment, taken by Fogle et al. (2008), Hahn et al. (2011a, b, 2012a, 2012b, 2012c, 2013, 2015, 2016), and Bernhardt et al. (2014).
This method enables a much more efficient analytical calculation of ionization rate coefficients than other plasma codes with a comparable accuracy. The corresponding rates are in good agreement with Bryans et al. (2009) in at least 85% of the cases. This capability is essential to resolve emission lines and line fluxes in a high-resolution X-ray spectra.
The results of the present work are included in the SPEX222https://www.sron.nl/spex (Kaastra et al. 1996) software, utilized for X-ray spectra modeling, fitting, and analysis.
Acknowledgements.
SRON is supported financially by NWO, the Netherlands Organization for Scientific Research. We thank J. Mao, L. Gu, T. Raassen and J. de Plaa for their support in the different stages of this project.References
- Achenbach et al. (1984) Achenbach, C., Müller, A., Salzborn, E., & Becker, R. 1984, J. Phys. B: At. Mol. Phys., 17, 1405
- Aichele et al. (1998) Aichele, K., Hartenfeller, U., Hathiramani, D., et al. 1998, J. Phys. B: At. Mol. Opt. Phys., 31, 2369
- Aichele et al. (2001) Aichele, K., Steidl, M., Hartenfeller, U., et al. 2001, J. Phys. B: At. Mol. Opt. Phys., 34, 4113
- Aitken et al. (1971) Aitken, K. L., Harrison, M. F. A., & Rundel, R. D. 1971, J. Phys. B: At. Mol. Phys., 4, 1189
- Almeida et al. (1995) Almeida, D. P., Fontes, A. C., & Godinho, C. F. L. 1995, J. Phys. B: At. Mol. Opt. Phys., 28, 3335
- Arnaud & Raymond (1992) Arnaud, M. & Raymond, J. 1992, ApJ, 398, 394
- Arnaud & Rothenflug (1985) Arnaud, M. & Rothenflug, R. 1985, A&AS, 60, 425
- Badnell & Pindzola (1993) Badnell, N. R. & Pindzola, M. S. 1993, Phys. Rev. A, 47
- Bannister (1996a) Bannister, M. E. 1996a, Phys. Rev. A, 54, 1435
- Bannister & Guo (1993) Bannister, M. E. & Guo, X. Q. 1993, Unpublished, http://www-cfadc.phy.ornl.gov/xbeam/xbmintro.html
- Bannister & Haverner (1996b) Bannister, M. E. & Haverner, C. C. 1996b, Unpublished, http://www-cfadc.phy.ornl.gov/xbeam/xbmintro.html
- Bartlett & Stelbovics (2002) Bartlett, P. L. & Stelbovics, A. T. 2002, Phys. Rev. A, 66, 012707
- Becker et al. (2004) Becker, C., Knopp, H., Jacobi, J., et al. 2004, J. Phys. B: At. Mol. Opt. Phys., 37, 1503
- Belic et al. (1987) Belic, D. S., Falk, R. A., Timmer, C., & Dunn, G. H. 1987, Phys. Rev A, 36, 1073
- Bernhardt et al. (2014) Bernhardt, D., Becker, A., Grieser, M., et al. 2014, Phys. Rev. A, 90, 012702
- Boivin & Srivastava (1998) Boivin, R. F. & Srivastava, S. K. 1998, J. Phys. B: At. Mol. Opt. Phys., 31, 2381
- Bolorizadeh et al. (1994) Bolorizadeh, M. A., Patton, C. J., Shah, M. B., & Gilbody, H. B. 1994, J. Phys. B: At. Mol. Opt. Phys., 27, 175
- Bray (1995) Bray, I. 1995, J. Phys. B: At. Mol. Opt. Phys., 28, 247
- Brook et al. (1978) Brook, E., Harrison, M. F. A., & Smith, A. C. H. 1978, J. Phys. B: At. Mol. Phys., 11, 3115
- Bryans et al. (2009) Bryans, P., Landi, E., & Savin, D. W. 2009, ApJ, 691, 1540
- Chen & Reed (1992) Chen, M. H. & Reed, K. J. 1992, Phys. Rev. A, 45, 4525
- Cherkani-Hassani et al. (2001) Cherkani-Hassani, S., Khouilid, M., & Defrance, P. 2001, Physica Scripta, 92, 287
- Chung (1996) Chung, S. 1996, Unpublished ORNL data http://www-cfadc.phy.ornl.gov/xbeam/xbmintro.html
- Crandall et al. (1982) Crandall, D. H., Phaneuf, A., Falk, A., Belic, D. S., & Dunn, H. 1982, Phys. Rev. A, 25
- Crandall et al. (1986) Crandall, D. H., Phaneuf, R. A., Gregory, D. C., et al. 1986, Phys. Rev. A, 34, 1757
- Crandall et al. (1979) Crandall, D. H., Phaneuf, R. A., Hasselquist, B. E., & Gregory, D. C. 1979, J. Phys. B: At. Mol. Phys., 12, 249
- Danjo et al. (1984) Danjo, A., Matsumoto, A., Ohtani, S., et al. 1984, J. Phys. Soc. Jpn, 53, 4091
- Defrance et al. (1990) Defrance, P., Chantrenne, S., Rachafi, S., et al. 1990, J. Phys. B: At. Mol. Opt. Phys., 23, 2333
- Defrance et al. (1987) Defrance, P., Rachafi, S., Jureta, J., Meyer, F., & Chantrenne, S. 1987, Nuclear Instruments and Methods in Physics Research Section B: Beam Interactions with Materials and Atoms, 23, 265
- Dere (2007) Dere, K. P. 2007, A&A, 466, 771
- Diserens et al. (1984) Diserens, M. J., Harrison, M. F. A., & Smith, A. C. H. 1984, J. Phys. B: At. Mol. Phys., 17, 621
- Diserens et al. (1988) Diserens, M. J., Smith, A. C. H., & Harrison, M. F. A. 1988, J. Phys. B: At. Mol. Opt. Phys., 21, 2129
- Djuric et al. (1993a) Djuric, N., Bell, E. W., & Dunn, G. H. 1993a, Internationa Journal of Mass Spectrometry and Ion Processes, 123, 187
- Djuric et al. (1993b) Djuric, N., Bell, W., Guo, Q., et al. 1993b, Phys. Rev. A, 47, 4786
- Dolder et al. (1961) Dolder, K. T., Harrison, M. F. A., & Thonemann, P. C. 1961, Proceedings of the Royal Society of London. Series A, Mathematical and Physical Sciences, 264, 367
- Donets & Ovsyannikov (1981) Donets, E. D. & Ovsyannikov, V. P. 1981, Sov. Phys. JETP, 53, 466
- Duponchelle et al. (1997) Duponchelle, M., Khouilid, M., Oualim, E. M., Zhang, H., & Defrance, P. 1997, J. Phys. B: At. Mol. Opt. Phys., 30, 729
- Falk (1980) Falk, R. 1980, Unpublished, http://www-cfadc.phy.ornl.gov/xbeam/xbmintro.html
- Falk et al. (1983c) Falk, R. A., Dunn, G. H., G. D., & Crandall, D. H. 1983c, Phys. Rev. A, 27, 762
- Falk & Dunn (1983b) Falk, R. A. & Dunn, G. H. 1983b, Phys. Rev. A, 27, 754
- Falk et al. (1983a) Falk, R. A., Stefani, G., Camilloni, R., et al. 1983a, Phys. Rev. A, 28, 91
- Fogle et al. (2008) Fogle, M., Bahati, E. M., Bannister, M. E., et al. 2008, ApJS, 58, 543
- Fontes et al. (1999) Fontes, C. J., Sampson, D. H., & Zhang, H. L. 1999, Phys. Rev. A, 59, 1329
- Freund et al. (1990) Freund, R. S., Wetzel, R. C., Shul, R. J., & Hayes, T. R. 1990, Phys. Rev. A, 41, 7
- Gao et al. (1997) Gao, H., Fang, D., Lu, F., et al. 1997, Nucl. Instr. Meth. Phys. Res. B, 132, 364
- Golden & Sampson (1978) Golden, L. B. & Sampson, D. H. 1978, ApJS, 38, 19
- Gregory & Crandall (1982) Gregory, D. C. & Crandall, D. H. 1982, Unpublished, http://www-cfadc.phy.ornl.gov/xbeam/xbmintro.html
- Gregory et al. (1983) Gregory, D. C., Dittner, P. F., & Crandall, D. H. 1983, Phys. Rev. A, 27, 724
- Gregory et al. (1986) Gregory, D. C., Meyer, F. W., Mueller, A., & Defrance, P. 1986, Phys. Rev. A, 34, 1
- Gregory et al. (1987) Gregory, D. C., Wang, L. J., Meyer, F. W., & Rinn, K. 1987, Phys. Rev. A, 35, 3256
- Gregory et al. (1990) Gregory, D. C., Wang, L. J., Swenson, D. R., Sataka, M., & Chantrenne, S. J. 1990, Phys. Rev. A, 41, 6512
- Griffin et al. (1982) Griffin, D. C., Bottcher, C., & Pindzola, M. S. 1982, Phys. Rev. A, 25, 154
- Griffin et al. (1987) Griffin, D. C., Pindzola, M., & Bottcher, C. 1987, Phys. Rev. A, 36, 3642
- Gu et al. (2016) Gu, L., Kaastra, J., & Raassen, T. 2016, A&A, 588, A52
- Gu (2002) Gu, M. F. 2002, ApJ, 579, 103
- Hahn et al. (2016) Hahn, M., Becker, A., Bernhardt, D., et al. 2016, J. Phys. B: At. Mol. Opt. Phys., 49, 084006
- Hahn et al. (2013) Hahn, M., Becker, A., Bernhardt, D., et al. 2013, ApJ, 767, 47
- Hahn et al. (2015) Hahn, M., Becker, A., Bernhardt, D., et al. 2015, ApJ, 813, 16
- Hahn et al. (2012c) Hahn, M., Becker, A., Grieser, M., et al. 2012c, ApJ, 760, 80
- Hahn et al. (2011a) Hahn, M., Bernhardt, D., Grieser, M., et al. 2011a, ApJ, 729, 76
- Hahn et al. (2012a) Hahn, M., Bernhardt, D., Grieser, M., et al. 2012a, Phys. Rev. A, 85, 042713
- Hahn et al. (2010) Hahn, M., Bernhardt, D., Lestinsky, M., et al. 2010, ApJ, 712, 1166
- Hahn et al. (2011b) Hahn, M., Grieser, M., Krantz, C., et al. 2011b, ApJ, 735, 105
- Hahn et al. (2012b) Hahn, M., Grieser, M., Krantz, C., et al. 2012b, ApJ, 761, 79
- Hayes et al. (1987) Hayes, T. R., Wetzel, R. C., & Freund, R. S. 1987, Phys. Rev. A, 35, 578
- Hirayama et al. (1986) Hirayama, T., Oda, K., Morikawa, Y., et al. 1986, J. Phys. Soc. Jpn, 55, 1411
- Hofmann et al. (1990) Hofmann, G., Müller, A., Tinschert, K., & Salzborn, E. 1990, Z. Phys. D-Atoms, Molecules and Clusters, 16, 113
- Hooper et al. (1966) Hooper, J. W., Lineberger, W. C., & Bacon, F. M. 1966, Physical Review, 141
- Howald et al. (1986) Howald, A. M., Gregory, D. C., Ridge, O., et al. 1986, Phys. Rev. A, 33, 3779
- Jacobi et al. (2004) Jacobi, J., Knopp, H., Schippers, S., & Müller, A. 2004, Phys. Rev. A, 042717, 2015
- Jalin et al. (1973) Jalin, R., Hagemann, R., & Botter, R. 1973, The Journal of Chemical Physics, 59, 952
- Kaastra et al. (1996) Kaastra, J. S., Mewe, R., & Nieuwenhuijzen, H. 1996, UV and X-ray Spectroscopy of Astrophysical and Laboratory Plasmas, 411
- Kallman & Palmeri (2007) Kallman, T. R. & Palmeri, P. 2007, Reviews of Modern Physics, 79, 79:133
- Kao et al. (1992) Kao, H. C., Kuo, T. Y., Yen, H. P., Wei, C. M., & Huang, K. N. 1992, Phys. Rev. A, 45, 4646
- Kumar & Roy (1979) Kumar, A. & Roy, B. N. 1979, J. Phys. B: At. Mol. Phys., 12, 3979
- Limandri et al. (2012) Limandri, S. P., Vasconcellos, M. A. Z., Hinrichs, R., & Trincavelli, J. C. 2012, Phys. Rev. A, 86, 042701
- Linkemann et al. (1995) Linkemann, J., Müller, A., Kenntner, J., et al. 1995, Physical Review Letters, 74, 4173
- Llovet et al. (2014) Llovet, X., Powell, C. J., Salvat, F., & Jablonski, A. 2014, J. Phys. Chem. Ref. Data, 43, 013102
- Loch et al. (2003) Loch, S. D., Colgan, J., Pindzola, M. S., et al. 2003, Phys. Rev. A, 67, 042714
- Loch et al. (2005) Loch, S. D., Witthoeft, M., Pindzola, M. S., et al. 2005, Phys. Rev. A, 71, 012716
- Lotz (1967) Lotz, W. 1967, Z. Phys., 206, 205
- Ma et al. (1991) Ma, C., Sporleder, C. R., & Bonham, R. A. 1991, Review of Scientific Instruments, 62, 909
- Magee et al. (1995) Magee, N. H., Abdallah, J., JR., et al. 1995, Astropyshical Applications of Powerful New Databases, ASP Conf., 78, 51
- Man et al. (1987a) Man, K. F., Smith, A. C. H., & Harrison, M. F. A. 1987a, J. Phys. B: At. Mol. Phys., 20, 5865
- Man et al. (1987b) Man, K. F., Smith, A. C. H., & Harrison, M. F. A. 1987b, J. Phys. B: At. Mol. Phys., 20, 2571
- Man et al. (1993) Man, K. F., Smith, A. C. H., & Harrison, M. F. A. 1993, J. Phys. B: At. Mol. Opt. Phys., 26, 1365
- Mao & Kaastra (2016) Mao, J. & Kaastra, J. 2016, A&A, 587, A84
- Martin et al. (1968) Martin, S. O., Peart, B., & Dolder, K. T. 1968, J. Phys. B, 1, 537
- McCallion et al. (1992a) McCallion, P., Shah, M. B., & Gilbody, H. B. 1992a, J. Phys. B: At. Mol. Opt. Phys., 25, 1051
- McCallion et al. (1992b) McCallion, P., Shah, M. B., & Gilbody, H. B. 1992b, J. Phys. B: At. Mol. Opt. Phys., 25, 1061
- McCarthy & Stelbovics (1983) McCarthy, I. E. & Stelbovics, A. T. 1983, Phys. Rev. A, 28, 1322
- McFarland & Kinney (1965) McFarland, R. H. & Kinney, J. D. 1965, Physical Review, 137, A1058
- McGuire (1977) McGuire, E. J. 1977, Phys. Rev. A, 16, 62
- McGuire (1982) McGuire, E. J. 1982, Phys. Rev. A, 26, 125
- McGuire (1997) McGuire, E. J. 1997, J. Phys. B: At. Mol. Opt. Phys., 30, 1563
- Mewe (1972) Mewe, R. 1972, A&A, 20, 215
- Montague et al. (1984a) Montague, R. G., Diserens, M. J., & Harrison, M. F. A. 1984a, J. Phys. B: Atom. Molec. Phys., 17, 2085
- Montague et al. (1984b) Montague, R. G., Harrison, M. F. A., & Smith, A. C. H. 1984b, J. Phys. B: At. Mol. Phys., 17, 3295
- Moores & Pindzola (1990) Moores, D. L. & Pindzola, M. S. 1990, Phys. Rev. A, 42, 5384
- Mueller et al. (1985) Mueller, D. W., Morgan, T. J., Dunn, G. H., Gregory, D. C., & Crandall, D. H. 1985, Phys. Rev. A, 31, 2905
- Müller et al. (1980) Müller, A., Salzborn, E., Frodl, R., et al. 1980, J. Phys. B: At. Mol. Phys., 13, 1877
- Müller et al. (1990) Müller, A., Hofmann, G., Tinschert, K., Weibecker, B., & Salzborn, E. 1990, Z. Phys. D-Atoms, Molecules and Clusters, 15, 145
- Nagy et al. (1980) Nagy, P., Skutlartz, A., & Schmidt, V. 1980, J. Phys. B: At. Mol. Phys., 13, 1249
- Omidvar & Rule (1977) Omidvar, K. & Rule, D. 1977, International Conference on the Physics of Electronic and Atomic Collisions: ICPEAC X, 544
- O’Rourke et al. (2001) O’Rourke, B., Currell, F. J., Kuramoto, H., et al. 2001, J. Phys. B: At. Mol. Opt. Phys., 34, 4003
- Peart & Dolder (1975) Peart, B. & Dolder, K. 1975, J. Phys. B: At. Mol. Phys., 8, 56
- Peart & Dolder (1968) Peart, B. & Dolder, K. T. 1968, J. Phys. B, 1, 872
- Peart et al. (1991a) Peart, B., Thomason, J. W. G., & Dolder, K. 1991a, J. Quant. Spectrosc. Radiat. Transfer, 24, 489
- Peart et al. (1991b) Peart, B., Thomason, J. W. G., & Dolder, K. 1991b, J. Phys. B: At. Mol. Opt. Phys., 24, 4453
- Peart et al. (1989) Peart, B., Underwood, J. R. A., & Dolder, K. 1989, J. Phys. B: At. Mol. Opt. Phys., 22, 2789
- Peart et al. (1969) Peart, B., Walton, D. S., & Dolder, K. T. 1969, J. Phys. B, 2, 1347
- Pindzola et al. (1994) Pindzola, M. S., Gorczyca, T. W., Badnell, N. R., et al. 1994, Phys. Rev. A, 49, 943
- Pindzola et al. (1991) Pindzola, M. S., Griffin, D. C., Bottcher, C., Buie, M. J., & Gregory, D. C. 1991, Physica Scripta, 37, 35
- Pindzola et al. (1987) Pindzola, M. S., Griffin, D. C., Bottcher, C., Younger, S. M., & Hunter, H. T. 1987, Nucl. Fusion Special Suppl., 27, 21
- Quarles (1976) Quarles, C. A. 1976, Phys. Rev. A, 13, 1278
- Rachafi et al. (1991) Rachafi, S., Belic, D. S., Duponchelle, M., et al. 1991, J. Phys. B: At. Mol. Opt. Phys., 24, 1037
- Rapp & Englander-Golden (1965) Rapp, D. & Englander-Golden, P. 1965, J. Phys. Chem., 43, 1464
- Reed & Chen (1992) Reed, K. J. & Chen, M. H. 1992, Phys. Rev. A, 45, 4519
- Reid et al. (1992) Reid, R. H. G., Bartschat, K., & Burke, P. G. 1992, J. Phys. B: At. Mol. Opt. Phys., 25, 3175
- Rejoub et al. (2002) Rejoub, R., Lindsay, B. G., & Stebbings, R. F. 2002, Phys. Rev. A, 65, 042713
- Riahi et al. (2001) Riahi, A., Laghdas, K., Reid, R. H. G., et al. 2001, J. Phys. B: At. Mol. Opt. Phys., 34, 175
- Rogers et al. (1982) Rogers, W. T., Stefani, G., Camilloni, R., et al. 1982, Phys. Rev. A, 25
- Roy & Kai (1983) Roy, B. N. & Kai, D. K. 1983, J. Phys. B: At. Mol. Phys., 16, 4677
- Sampson (1982) Sampson, D. H. 1982, J. Phys. B: At. Mol. Phys., 15, 2087
- Sampson & Golden (1981) Sampson, D. H. & Golden, L. B. 1981, J. Phys. B: At. Mol. Phys., 14, 903
- Sataka et al. (1989) Sataka, M., Ohtani, S., Swanson, D., & Gregory, D. C. 1989, Phys. Rev. A, 39, 2397
- Shah et al. (1987) Shah, M. B., Elliott, D. S., & Gilbody, H. B. 1987, J. Phys. B: At. Mol. Phys., 20, 3501
- Shah et al. (1988) Shah, M. B., Elliott, D. S., McCallion, P., & Gilbody, H. B. 1988, J. Phys. B: At. Mol. Opt. Phys., 21, 2751
- Stenke et al. (1999) Stenke, M., Aichele, K., Hartenfeller, U., et al. 1999, J. Phys. B: At. Mol. Opt. Phys., 32, 3627
- Stephan et al. (1980) Stephan, K., Helm, H., & Märk, T. D. 1980, J. Phys. Chem., 73, 3763
- Straub et al. (1995) Straub, H., Renault, P., Lindsay, B., Smith, K., & Stebbings, R. 1995, Phys. Rev. A, 52, 1115
- Tawara (2002) Tawara, H. 2002, Numerical Data and Functional Relationships in Science and Technology, ed. Y. Hahn, A. K. Pradhan, H. Tawara, H. L. Zhang and Itakawa (gen. ed.), Landolt-Bornstein, 103
- Tayal & Henry (1986) Tayal, S. S. & Henry, R. J. W. 1986, Phys. Rev. A, 33, 3825
- Teng et al. (2000) Teng, H., Knopp, H., Ricz, S., et al. 2000, Phys. Rev. A, 61, 060704
- Thomason & Peart (1998) Thomason, J. W. G. & Peart, B. 1998, J. Phys. B: At. Mol. Opt. Phys., 31, 201
- Thompson & Gregory (1994) Thompson, J. S. & Gregory, D. C. 1994, Phys. Rev. A, 50, 1377
- Thompson et al. (1995) Thompson, W. R., Shah, M. B., & Gilbody, H. B. 1995, J. Phys. B: At. Mol. Opt. Phys., 28, 1321
- Thomson (1912) Thomson, J. J. 1912, Phil. Mag., 23, 449
- Tinschert et al. (1989) Tinschert, K., Müller, A., Hofmann, G., et al. 1989, J. Phys. B: At. Mol. Opt. Phys., 22, 531
- Verner & Yakovlev (1995) Verner, D. A. & Yakovlev, D. G. 1995, A&AS, 109, 125
- Wang et al. (1988) Wang, L. J., Rinn, K., & Gregory, D. C. 1988, J. Phys. B: Atom. Molec. Phys., 21, 2117
- Wetzel et al. (1987) Wetzel, R. C., Baiocchi, F. A., Hayes, T. R., & Freund, R. S. 1987, Phys. Rev. A, 35, 559
- Wong et al. (1993) Wong, K. L., Beiersdorfer, P., Chen, M. H., et al. 1993, Phys. Rev. A, 48, 2850
- Yamada et al. (1988) Yamada, I., Danjo, A., Hirayama, T., et al. 1988, J. Phys. Soc. Jpn, 57, 2699
- Yamada et al. (1989a) Yamada, I., Danjo, A., Hirayama, T., et al. 1989a, J. Phys. Soc. Jpn, 58, 1585
- Yamada et al. (1989b) Yamada, I., Danjo, A., Hirayama, T., et al. 1989b, J. Phys. Soc. Jpn, 58, 3151
- Younger (1981a) Younger, S. M. 1981a, J. Quant. Spectrosc. Radiat. Transfer, 26, 329
- Younger (1981b) Younger, S. M. 1981b, Phys. Rev. A, 23, 1138
- Younger (1981c) Younger, S. M. 1981c, Phys. Rev. A, 24, 1272
- Younger (1981d) Younger, S. M. 1981d, Phys. Rev. A, 24, 1278
- Younger (1982a) Younger, S. M. 1982a, J. Quant. Spectrosc. Radiat. Transfer, 27, 541
- Younger (1982b) Younger, S. M. 1982b, Journal of research of the national Bureau of Standards, 87, 49
- Younger (1982c) Younger, S. M. 1982c, Phys. Rev. A, 25, 3396
- Younger (1982d) Younger, S. M. 1982d, Phys. Rev. A, 26, 3177
- Younger (1983) Younger, S. M. 1983, J. Quant. Spectrosc. Radiat. Transfer, 29, 61
- Zapesochnyi & Aleksakhin (1969) Zapesochnyi, I. P. & Aleksakhin, I. S. 1969, Soviet Physics Jetp, 28, 41
- Zeijlmans van Emmichoven et al. (1993) Zeijlmans van Emmichoven, P., Bannister, M., Gregory, D., et al. 1993, Phys. Rev. A, 47, 2888
- Zhang et al. (2002) Zhang, H., Cherkani-Hassani, S., B lenger, C., et al. 2002, J. Phys. B: At. Mol. Opt. Phys., 35, 3829
- Zhang & Sampson (1990) Zhang, H. L. & Sampson, D. H. 1990, Phys. Rev. A, 42, 5378
- Zhang et al. (1991) Zhang, Y., Reddy, C. B., Smith, R. S., et al. 1991, Phys. Rev. A, 44, 4368
Appendix A References for used cross-section data
| Ion | Type 1 | Reference | Uncertainty |
| H-sequence | |||
| H I | e | Shah et al. (1987) | 7% |
| He II | e | Peart et al. (1969) | 12% |
| Li III | e | Tinschert et al. (1989) | 10% |
| B V | e | Aichele et al. (1998) | 10% |
| C VI | e | Aichele et al. (1998) | 10% |
| N VII | e | Aichele et al. (1998) | 10% |
| O VIII | e | Aichele et al. (1998) | 10% |
| Ne X | t | Fontes et al. (1999) | – |
| t | Kao et al. (1992) | – | |
| Fe XXVI | t | Kao et al. (1992) | – |
| t | Moores & Pindzola (1990) | – | |
| Cu XXIX | t | Moores & Pindzola (1990) | – |
| He-sequence | |||
| He I | e | Montague et al. (1984b) | 4% |
| e | Rejoub et al. (2002) | 5% | |
| e | Shah et al. (1988) | 6% | |
| Li II | e | Peart & Dolder (1968) | 6% |
| e | Peart et al. (1969) | 11% | |
| B IV | e | Crandall et al. (1979) | 4% |
| C V | e | Crandall et al. (1979) | 7% |
| e | Donets & Ovsyannikov (1981) | 6% | |
| O VII | t | Zhang & Sampson (1990) | – |
| Ne IX | e | Duponchelle et al. (1997) | 11% |
| t | Zhang & Sampson (1990) | – | |
| Fe XXV | t | Zhang & Sampson (1990) | – |
| Zn XXIX | t | Zhang & Sampson (1990) | – |
| Li-sequence (1s) | |||
| Li I | t | Younger (1981a) | – |
| Be II | t | Younger (1981a) | – |
| O VI | t | Zhang & Sampson (1990) | – |
| Fe XXIV | t | Zhang & Sampson (1990) | – |
| Zn XXVIII | t | Zhang & Sampson (1990) | – |
| Li-sequence (2s) | |||
| Li I | t | Bray (1995) | – |
| e | Jalin et al. (1973) | 18% | |
| Be II | e | Falk & Dunn (1983b) | 8% |
| B III | e | Crandall et al. (1986) | 7% |
| C IV | e | Crandall et al. (1979) | 7% |
| e | Teng et al. (2000) | 14% | |
| N V | e | Crandall et al. (1979) | 7% |
| e | Donets & Ovsyannikov (1981) | – | |
| O VI | e | Crandall et al. (1986) | 16% |
| e | Defrance et al. (1990) | 7% | |
| e | Donets & Ovsyannikov (1981) | 7% | |
| Ne VIII | e | Riahi et al. (2001) | –% |
| Fe XXIV | t | Zhang & Sampson (1990) | – |
| Zn XXVIII | t | Zhang & Sampson (1990) | – |
| List of references for used cross-section data |
-
1
e: experimental data, t: theoretical calculations
| Ion | Type111 | Reference | Uncertainty |
| Be-sequence (2s) | |||
| C III | e | Fogle et al. (2008) | 8% |
| N IV | e | Fogle et al. (2008) | 8% |
| O V | e | Fogle et al. (2008) | 8% |
| F VI | t | Younger (1981d) | – |
| Ne VII | t | Duponchelle et al. (1997) | 6% |
| S XIII | e | Hahn et al. (2012a) | 15% |
| Ar XV | t | Younger (1981d) | – |
| Fe XXIII | t | Younger (1982a) | – |
| B-sequence (2p) | |||
| B I | e | Tawara (2002) (CHIANTI) | – |
| C II | e | Aitken et al. (1971) | 7% |
| e | Yamada et al. (1989a) | 10% | |
| N III | e | Aitken et al. (1971) | 7% |
| e | Bannister & Haverner (1996b) | 8% | |
| O IV | e | Crandall et al. (1979) | 8% |
| Ne VI | e | Bannister (1996a) | 11% |
| e | Duponchelle et al. (1997) | 6% | |
| Mg VIII | e | Hahn et al. (2010) | 15% |
| Fe XXII | t | Zhang & Sampson (1990) | – |
| Zn XXVI | t | Zhang & Sampson (1990) | – |
| C-sequence (2p) | |||
| C I | e | Brook et al. (1978) | 5% |
| N II | e | Yamada et al. (1989a) | 10% |
| O III | e | Aitken et al. (1971) | 7% |
| e | Donets & Ovsyannikov (1981) | – | |
| e | Falk (1980) | 10% | |
| Ne V | e | Bannister (1996a) | 9% |
| e | Duponchelle et al. (1997) | 5% | |
| Fe XXI | t | Zhang & Sampson (1990) | – |
| Zn XXV | t | Zhang & Sampson (1990) | – |
| N-sequence (2p) | |||
| N I | e | Brook et al. (1978) | 4% |
| O II | e | Aitken et al. (1971) | – |
| e | Yamada et al. (1989a) | 7% | |
| F III | e | Mueller et al. (1985) | 9% |
| Ne IV | e | Gregory et al. (1983) | 8% |
| Si VIII | e | Zeijlmans van Emmichoven et al. (1993) | 7% |
| Fe XX | t | Zhang & Sampson (1990) | – |
| Zn XXIV | t | Zhang & Sampson (1990) | – |
| O-sequence (2p) | |||
| O I | e | Brook et al. (1978) | 5% |
| e | Thompson et al. (1995) | 5% | |
| F II | e | Yamada et al. (1989b) | 10% |
| Ne III | e | Bannister (1996a) | 9% |
| Ar XI | e | Zhang et al. (2002) | 9% |
| Fe XIX | t | Zhang & Sampson (1990) | – |
| Zn XXIII | t | Zhang & Sampson (1990) | – |
| Ion | Type111 | Reference | Uncertainty |
| F-sequence (2p) | |||
| F I | e | Hayes et al. (1987) | 20% |
| Ne II | e | Achenbach et al. (1984) | 10% |
| e | Diserens et al. (1984) | 3% | |
| e | Donets & Ovsyannikov (1981) | – | |
| e | Man et al. (1987a) | 3% | |
| Al V | e | Aichele et al. (2001) | 8% |
| t | McGuire (1982) | – | |
| Si VI | e | Thompson & Gregory (1994) | 4% |
| Fe XVIII | e | Hahn et al. (2013) | 17% |
| t | Zhang & Sampson (1990) | – | |
| Zn XXII | t | Zhang & Sampson (1990) | – |
| Ne-sequence (2s) | |||
| Na II | e | Younger (1981c) | – |
| Mg III | e | Younger (1981c) | – |
| Al IV | e | Younger (1981c) | – |
| P VI | e | Younger (1981c) | – |
| Ar IX | e | Younger (1981c) | – |
| Fe XVII | e | Zhang & Sampson (1990) | – |
| Zn XXI | e | Zhang & Sampson (1990) | – |
| Ne-sequence (2p) | |||
| Ne I | e | Almeida et al. (1995) | 8% |
| e | Nagy et al. (1980) | 7% | |
| e | Stephan et al. (1980) | 8% | |
| e | Wetzel et al. (1987) | 15% | |
| Na II | e | Hirayama et al. (1986) | 13% |
| e | Hooper et al. (1966) | 10% | |
| e | Peart & Dolder (1968) | 6% | |
| Mg III | e | Peart et al. (1969) | 8% |
| Al IV | t | Younger (1981b) | – |
| Ar IX | e | Defrance et al. (1987) | 10% |
| e | Zhang et al. (2002) | 5% | |
| Fe XVII | e | Hahn et al. (2013) | 16% |
| t | Zhang & Sampson (1990) | – | |
| Zn XXI | t | Zhang & Sampson (1990) | – |
| Na-sequence (2s & 2p) | |||
| Mg II | t | Younger (1981c) | – |
| Al III | t | Younger (1981c) | – |
| P V | t | Younger (1981c) | – |
| Ar VIII | t | Younger (1981c) | – |
| Ni XVIII | t | Pindzola et al. (1991) | – |
| Na-sequence (3s) | |||
| Na I | e | McFarland & Kinney (1965) | 8% |
| e | Zapesochnyi & Aleksakhin (1969) | 15% | |
| Mg II | e | Becker et al. (2004) | 10% |
| e | Martin et al. (1968) | 11% | |
| e | Peart et al. (1991b) | 9% | |
| Al III | e | Thomason & Peart (1998) | 8% |
| Si IV | e | Crandall et al. (1982) | 12% |
| Ti XII | e | Gregory et al. (1990) | 7% |
| t | Griffin et al. (1987) | – | |
| Fe XVI | e | Gregory et al. (1987) | 14% |
| e | Linkemann et al. (1995) | 20% | |
| Ni XVIII | t | Pindzola et al. (1991) | – |
| Ion | Type111 | Reference | Uncertainty |
| Mg-sequence (3s) | |||
| Mg I | e | Boivin & Srivastava (1998) | 11% |
| e | Freund et al. (1990) | 10% | |
| e | McCallion et al. (1992a) | 12% | |
| Al II | e | Belic et al. (1987) | 9% |
| Cl VI | e | Howald et al. (1986) | 10% |
| Ar VII | e | Chung (1996) | 6% |
| e | Zhang et al. (2002) | 7% | |
| Sc X | t | Younger (1983) | – |
| Fe XV | t | Bernhardt et al. (2014) | 26% |
| Al-sequence (3p) | |||
| Al I | e | Freund et al. (1990) | 10% |
| Si II | e | Djuric et al. (1993b) | 9% |
| Cl V | e | Bannister & Guo (1993) | 9% |
| Ar VI | e | Gregory & Crandall (1982) | 11% |
| Sc IX | t | Younger (1983) | – |
| Fe XIV | e | Hahn et al. (2013) | 16% |
| Si-sequence (3p) | |||
| Si I | e | Freund et al. (1990) | 10% |
| P II | e | Yamada et al. (1989a) | 10% |
| S III | e | Yamada et al. (1988) | 10% |
| Ar V | t | Arnaud & Rothenflug (1985) | – |
| Sc VIII | t | Younger (1983) | – |
| Fe XIII | e | Hahn et al. (2012b) | 12% |
| P-sequence (3p) | |||
| P I | e | Freund et al. (1990) | 10% |
| Cl III | e | Mueller et al. (1985) | 10% |
| Sc VII | t | Younger (1983) | – |
| Fe XII | e | Hahn et al. (2011a) | 16% |
| Ni XIV | e | Cherkani-Hassani et al. (2001) | 14% |
| S-sequence (3p) | |||
| S I | e | Freund et al. (1990) | 10% |
| Cl II | e | Djuric et al. (1993b) | 7% |
| Ar III | e | Diserens et al. (1988) | 3% |
| e | Man et al. (1993) | 3% | |
| Sc VI | t | Younger (1983) | – |
| Fe XI | e | Hahn et al. (2012c) | 9% |
| Cl-sequence (3p) | |||
| Cl I | e | Hayes et al. (1987) | 14% |
| Ar II | e | Gao et al. (1997) | 10% |
| e | Man et al. (1987a) | 3% | |
| e | Mueller et al. (1985) | 10% | |
| e | Yamada et al. (1989b) | 10% | |
| K III | t | Younger (1982c) | – |
| Sc V | t | Younger (1982c) | – |
| Fe X | e | Hahn et al. (2012c) | 9% |
| Ni XII | e | Cherkani-Hassani et al. (2001) | 14% |
| Ion | Type111 | Reference | Uncertainty |
| Ar-sequence (3p) | |||
| Ar I | e | Ma et al. (1991) | 15% |
| e | McCallion et al. (1992b) | 6% | |
| e | Nagy et al. (1980) | 6% | |
| e | Straub et al. (1995) | 8% | |
| e | Wetzel et al. (1987) | 3% | |
| K II | e | Hirayama et al. (1986) | 15% |
| t | Kumar & Roy (1979) | – | |
| e | Peart & Dolder (1968) | 15% | |
| Sc IV | t | Younger (1982d) | – |
| Fe IX | e | Hahn et al. (2016) | 16% |
| K-sequence (3d & 4s) | |||
| K I | t | McCarthy & Stelbovics (1983) | – |
| Ca II | e | Peart & Dolder (1975) | 10% |
| e | Peart et al. (1989) | 8% | |
| Sc III | e | Pindzola et al. (1994) | 8% |
| Ti IV | e | Falk et al. (1983c) | 7% |
| Fe VIII | e | Hahn et al. (2015) | 12% |
| Ni X | t | Pindzola et al. (1991) | – |
| Ca-sequence (3d & 4s) | |||
| Ca I | t | Roy & Kai (1983) | – |
| t | McGuire (1977) | – | |
| t | McGuire (1997) | – | |
| Sc II | e | Jacobi et al. (2004) | 15% |
| Ti III | e | Diserens et al. (1988) | 3% |
| e | Mueller et al. (1985) | 9% | |
| Fe VII | e | Gregory et al. (1986) | 5% |
| e | Stenke et al. (1999) | 8% | |
| Ni IX | t | Pindzola et al. (1991) | – |
| e | Wang et al. (1988) | 6% | |
| Sc-sequence (3d & 4s) | |||
| Sc I | e | Tawara (2002) (CHIANTI) | – |
| Ti II | e | Diserens et al. (1988) | 3% |
| Fe VI | e | Gregory et al. (1986) | 5% |
| e | Stenke et al. (1999) | 8% | |
| Ni VIII | t | Pindzola et al. (1991) | – |
| e | Wang et al. (1988) | 6% | |
| Ti-sequence (3d & 4s) | |||
| Ti I | t | McGuire (1977) | – |
| Fe V | e | Stenke et al. (1999) | 8% |
| Ni VII | e | Wang et al. (1988) | 6% |
| V-sequence (3d & 4s) | |||
| V I | e | Tawara (2002) (CHIANTI) | – |
| Cr II | e | Man et al. (1987b) | 2.5% |
| Fe IV | e | Stenke et al. (1999) | – |
| Ni VI | e | Wang et al. (1988) | 6% |
| Cr-sequence (3d & 4s) | |||
| Cr I | t | Reid et al. (1992) | – |
| t | McGuire (1977) | – | |
| Fe III | t | FAC (CHIANTI) | – |
| Ni V | e | Bannister & Guo (1993) | 7% |
| t | Pindzola et al. (1991) | – |
| Ion | Type111 | Reference | Uncertainty |
| Mn-sequence (3d & 4s) | |||
| Mn I | e | Tawara (2002) (CHIANTI) | – |
| Fe II | t | Younger (1983) (3d) | – |
| e | Montague et al. (1984b) (4s) | – | |
| Fe-sequence (3d & 4s) | |||
| Fe I | e | Freund et al. (1990) | 7% |
| Co II | t | FAC (CHIANTI) | – |
| Ni III | t | Pindzola et al. (1991) | – |
| Cu IV | e | Gregory et al. (1986) | 4% |
| Co-sequence (3d & 4s) | |||
| Co I | e | Tawara (2002) (CHIANTI) | – |
| Ni II | e | Montague et al. (1984a) | 3% |
| Cu III | e | Gregory et al. (1986) | 4% |
| Ni-sequence (3d & 4s) | |||
| Ni I | t | Pindzola et al. (1991) (3d) | – |
| t | McGuire (1977) (4s) | – | |
| Cu-sequence (3d & 4s) | |||
| Cu I | t | FAC (3d) | – |
| e | Bolorizadeh et al. (1994) (4s) | 10% | |
| t | Bartlett & Stelbovics (2002) (4s) | – | |
| Zn II | t | FAC (3d) | – |
| e | Peart et al. (1991a) (4s) | 10% | |
| e | Rogers et al. (1982) (4s) | 10% | |
| Zn-sequence (3d & 4s) | |||
| Zn I | t | FAC (3d) | – |
| t | McGuire (1977) (4s) | – | |
| t | Omidvar & Rule (1977) (4s) | – |
Appendix B Calculation of DI ionization rate coefficients
As explained in Section 2, for the direct ionization cross-section calculation, the extended Younger’s equation (2) was used:
| (22) |
where
with E the kinetic energy of the colliding electron and I the ionisation potential of the relevant subshell.
If we generalize the formula for all the inner shells and the summation over all shells is taken into account for the total direct ionization cross-section, the parametric formula is
| (23) |
Eq. 22 can be written as follows being :
| (24) |
with
As a consequence, the direct ionization rate coefficients versus the temperature [T] are:
| (25) |
with and
| (26) |
with
| (27) | ||||
| (28) |
being the first exponential integral function.
| (30) | ||||
| (31) | ||||
| (32) | ||||
| (33) | ||||
| (34) |
For small y (y¡0.6):
| (35) |
where =0.577216 is the Euler-Mascheroni constant.
For intermediate y :
| (36) |
with,
For large y (y¿20):
| (37) |
| (38) |
For small y (y¡0.5):
| (39) |
For intermediate y :
| (40) |
with,
For large y (y¿20):
| (41) |
with,
Appendix C Calculation of EA ionization rate coefficients
The excitation-autoionization ion rate coefficients were calculated applying the integral to a Maxwellian velocity distribution of Mewe’s equation, mentioned in Section 2.2:
The EA cross-section contribution that affects the outer shell of each element, is the summation over energy level transitions with the excitation-autoionization potential being :
| (42) |
with,
Therefore, the EA ionization rate coefficients versus the temperature [T] are
| (43) |
with and
| (44) |
with:
| (45) | ||||
| (46) | ||||
| (47) | ||||
| (48) | ||||
| (49) |
Appendix D The DI coefficients
The table below shows an example of the DI coefficients calculated by Eq. 2 for Si-like Fe XI.
| iia | irb | izc | IDI (eV)d | A | B | C | D | Ee |
|---|---|---|---|---|---|---|---|---|
| 16 | 1 | 26 | 7585.000 | 28.28 | -11.62 | 4.80 | 0.00 | -24.12 |
| 16 | 2 | 26 | 1164.000 | 18.21 | -3.73 | 3.56 | -3.85 | -9.85 |
| 16 | 3 | 26 | 1048.687 | 59.57 | -26.85 | 13.230 | 14.61 | -51.29 |
| 16 | 4 | 26 | 324.400 | 21.91 | -11.03 | 2.25 | 4.09 | -18.89 |
| 16 | 5 | 26 | 290.300 | 80.28 | -72.24 | 6.22 | 33.59 | -92.87 |
| The DI coefficients |
-
a
ii: Isoelectronic sequence
-
b
ir: Shell number 1-7 (1s,2s,2p,3s,3p,3d,4s)
-
c
iz: Element
-
d
IDI: Ionization potential
-
e
A,B,C,D and E units: m2keV2
Appendix E The EA coefficients
The table below shows an example of the DI coefficients calculated by equation (12) for Si-like Fe XI.
| iia | izb | kc | IEA (eV)d | A | B | C | D | Ee |
|---|---|---|---|---|---|---|---|---|
| 16 | 26 | 1 | 757.000 | -0.465 | 0.812 | -0.037 | -0.062 | 0.608 |
| 16 | 26 | 2 | 802.500 | 2.809 | -4.408 | 4.904 | -1.017 | -0.056 |
| 16 | 26 | 3 | 902.200 | 0.260 | -0.062 | 0.006 | 0.006 | 0.000 |
| 16 | 26 | 4 | 916.900 | -0.136 | 0.223 | 0.248 | -0.087 | 0.378 |
| 16 | 26 | 5 | 936.300 | 0.372 | -0.409 | 0.434 | -0.068 | 0.000 |
| 16 | 26 | 6 | 977.500 | 0.217 | -0.143 | 0.322 | -0.062 | 0.143 |
| 16 | 26 | 7 | 662.900 | 1.302 | -0.484 | 0.794 | -0.174 | 0.006 |
| 16 | 26 | 8 | 709.000 | -0.831 | 7.738 | 5.871 | -2.344 | 9.653 |
| 16 | 26 | 9 | 809.300 | 0.186 | -0.068 | 0.409 | -0.099 | 0.093 |
| 16 | 26 | 10 | 823.800 | 0.955 | -0.384 | 0.818 | -0.149 | 0.000 |
| 16 | 26 | 11 | 843.400 | 1.048 | -0.651 | 2.883 | -0.670 | 1.445 |
| 16 | 26 | 12 | 884.700 | 0.942 | -0.725 | 1.910 | -0.378 | 0.521 |
| The EA coefficients |
-
a
ii: Isoelectronic sequence
-
b
iz: Element
-
c
k: Number of transitions
-
d
IEA: Ionization potential
-
e
A,B,C,D and E units: m2keV2