Radio Galaxies with the Cherenkov Telescope Array
Abstract
Misaligned AGN (MAGNs), i.e., radio-loud AGNs with the jet not pointing directly towards us, represent a new class of GeV emitters revealed by the Fermi-LAT space telescope. Although they comprise only a small fraction of the high-energy sources, MAGNs are extremely interesting objects offering a different perspective to study high-energy processes with respect to blazars. The aim of this work is to evaluate the impact of the new-generation Cherenkov Telescope Array (CTA) on the MAGN class and propose possible observational strategies to optimize their detection.
keywords:
Galaxies: active; Galaxies: nuclei; Galaxies: jets; Gamma rays: galaxies1 Introduction
Radio-Loud Active Galactic Nuclei (RL AGNs) constitute the majority of the extragalactic sources observed at Very High Energies (VHE, GeV; see, for example, the TeVCat online catalog222URL: http://tevcat.uchicago.edu/). RL AGNs are characterized by the presence of well-collimated jets of relativistic plasma ejected from the nuclear region [1]. The triggering and launching mechanism of these jets, and therefore the physical conditions and parameters under which an AGN becomes radio-loud, are one of the most debated and studied topics in this field [2].
Jets host a population of relativistic particles which emit non-thermal radiation across the whole electromagnetic spectrum. The Spectral Energy Distribution (SED) associated with this emission has a characteristic shape comprising two peaks: one at low energy (radio to optical/soft X-rays) and one at high energy (hard X-rays to TeV) [3] . The low-energy peak is confidently associated with synchrotron emission from a population of relativistic electrons in the jet, while the high-energy emission process is not well understood. The most popular model invokes Inverse Compton (IC) up-scattering of low-energy seed photons by the same relativistic electrons responsible for the synchrotron radiation. The seed photons can be provided by the electron synchrotron emission itself, in which case the process is referred to as Synchrotron Self-Compton (SSC) [4], or by an external photon field (such as the accretion disk, the Broad Line Region, the Narrow Line Region, the torus, or the CMB radiation), referred to as External Compton (EC) process [5, 6]. These models are collectively called leptonic models since all the observed emission is ascribed to relativistic electrons. In recent years, it has become clear that a leptonic modeling of the SED of RL AGNs is not capable of reproducing all the observed properties. Therefore, alternative models have been developed which consider, alongside the relativistic leptons, a population of relativistic protons. This component can give the main contribution to the observed emission, particularly at the highest energies, reproducing the flat VHE spectra that are observed in some sources, while the electron IC component provides the hard X-ray/soft -ray emission. The main emission processes involved are proton synchrotron emission, photo-pion production, and cascade emission from secondary particles produced by the interactions of protons with ambient photons or themselves. These models are called hadronic or lepto-hadronic models; see, e.g., [7], [8] for a review on leptonic and hadronic models.
If the jet of a radio-loud AGN is closely aligned with the observer’s line of sight (l.o.s), its radiation is strongly beamed and amplified via relativistic Doppler effects. In this case, the AGN is called a blazar, and the non-thermal jet emission typically dominates over other contributions to the observed SED. The blazar class includes Flat Spectrum Radio Quasars (FSRQs) and BL Lacertae (BL Lacs). FSRQs are powerful sources displaying strong broad optical emission lines, while BL Lacs are less luminous than FSRQs and lack emission lines (down to equivalent widths of a few Å) in their optical spectra.
In the framework of the orientation-based unified model [9, 10] radio galaxies (and Steep Spectrum Radio Quasars, SSRQs) are the radio-loud AGNs with the jet pointed away from the observer and are therefore referred to as Misaligned AGNs. Radio galaxies can be divided into two classes: FR I at low radio powers, which present decelerating jets and edge-darkened diffuse lobes, and FR II at high radio powers, with large-scale relativistic jets and edge-brightened lobes [11]. The transition between these two classes happens at a luminosity of W Hz-1 sr-1 at 178 MHz. FR I and FR II radio galaxies are considered the parent population of BL Lacs and FSRQs, respectively ([12, 13, 14, 15]). Recently, the new class of “FR 0” radio galaxies has been proposed (e.g., [16] and references therein). These sources share similar nuclear and host properties with FR Is, but lack extended radio emission. Though their behavior is still poorly understood, they appear to represent the majority of the population of local RL AGNs.
Because of the larger inclination angle between the jet and our l.o.s. with respect to blazars, the observed non-thermal emission from radio galaxies is not significantly Doppler-boosted, therefore these sources have a less jet-dominated SED. Hence, radio galaxies provide a view of AGN jets which is less biased by relativistic effects, allowing us to observe both the jets and the accretion process and potentially establish a connection between the two. This represents the first, fundamental step to start a proper investigation of the origin of radio-loudness in general [17, 18, 19]. Moreover, radio galaxies allow us to investigate the presence of a transverse jet structure, which has been proposed to explain the observed SED of FR Is. Structured (multi-zone) jets are indeed promising in describing the high-energy radiation of radio galaxies. SSC models, when applied to RGs, require (modest) beaming factors ()333, being the inclination angle and the Lorentz factor and the bulk jet velocities in unit of the speed of light. implying, for large inclination angles, small Lorentz factors () [20, 21, 22, 23, 24]. Slow jets are in conflicts with the idea that RGs are the parent population of blazars. Very high jet velocities ( or more) are indeed found in AGN with jet pointed directly to the observer [25].
If the condition of a homogeneously emitting region as assumed in a SSC one-zone model is relaxed, an efficient (radiative) feedback between different regions can explain the observed IC peak of radio galaxies (without violating the unified models [24]). This can be explained by a decelerating flow [26] and a spine-layer jet [26, 27, 28, 29]. In one case, the presence of regions at different velocities along the relativistic flow is assumed; in the other case, the flow is supposed to be fast in the inner part (the region observed in blazars) and slow in the external envelope. Interestingly enough, a limb-brightened structure of the jet has been discovered in Mrk 501 [30], in M 87 [31, 32] and in NGC 1275 [29], thus supporting the latter scenario.
The weaker Doppler boosting of MAGN emission is particularly evident in the -ray band, where blazars represent the great majority of the observed AGNs. For example, in the latest Fermi-LAT AGN catalog, the 3LAC [33], MAGNs with a solid identification constitute only 1-2% of all sources. The second Fermi-LAT catalog of hard spectrum sources (2FHL [34]), which covers the energy range between 50 and 2000 GeV, includes 271 sources associated with AGNs, of which 6 are radio galaxies (2% of the entire sample). All the 2FHL radio galaxies have been detected by Cherenkov Telescopes with the only exception of 3C 264 that, however, has no detection above 170 GeV in the Fermi-LAT band. The TeV MAGNs are well known local FR I radio galaxies (see the TeVCat online catalog), i.e. NGC 1275 [35], M 87 [36], and Centaurus A [37], plus the transitional FR I-BL Lac source IC 310 [38]. Recently, the detection of the FR I radio galaxy PKS 062535 was announced by the H.E.S.S. collaboration [39].
Although TeV observations of MAGNs have played an important role in investigating the open questions in high-energy studies of jets, the limited number of detected sources, along with the low signal-to-noise spectra produced by the current Imaging Atmospheric Cherenkov Telescopes (IACT), i.e. MAGIC, H.E.S.S. and VERITAS, do not allow us to draw general conclusions.
The new-generation facility for VHE astronomy, the Cherenkov Telescope Array (CTA) [40], is expected to achieve order-of-magnitude improvements in sensitivity and energy range with respect to previous facilities which operate in the same energy domain. These capabilities will be achieved through the deployment of a large number of Cherenkov telescopes of different sizes at two sites (Northern and Southern hemisphere) for full sky coverage. In the final configuration, the Northern array will include 4 Large Size Telescopes (LST, 23m diameter) and 15 Medium Size Telescopes (MST, 12m diameter). The Southern array will include 4 LSTs, 25 MSTs, and 70 Small Size Telescopes (SST, 4m diameter). The three classes are designed to cover the low ( GeV), intermediate ( TeV), and high-energy ranges (up to 300 TeV), respectively. Because of the different array configurations, the Southern array will have a better sensitivity, especially at energies 1 TeV.
Thanks to these remarkable improvements, the CTA is also expected to increase our ability in revealing MAGNs in the TeV sky. Our aim is therefore to evaluate its impact on VHE studies of non-blazar RL AGNs starting from the exploration of the MAGN sample revealed in the GeV band by Fermi.
In Section 2 we describe the sample of radio galaxies observed in the GeV band, which is the starting point for our study. In Section 3 we describe the performed simulations and the results. In Section 4 we present more general simulations that allow us to estimate the chances of a CTA detection for any Fermi-LAT AGN, given its spectral parameters in the 1-100 GeV band. In Section 5 we draw the conclusions and discuss the optimal observing strategy to detect more MAGNs, in light of our results.
2 The Fermi-LAT radio galaxy sample
The third Fermi-LAT AGN catalog (3LAC) [33], based on 4 years of observations, provides the most up-to-date list of identified AGNs emitting in the GeV band. In our sample, we include all the radio galaxies with a solid counterpart reported in the 3LAC. We also add the radio galaxy 3C 120, firmly established as a -ray source by [41, 42] and the FR 0 radio galaxy Tol 1326379, which has recently been associated with the Fermi source 3FGL J1330.03818 [43]. We decided to consider only the sources with redshift to avoid any significant absorption by the Extragalactic Background Light (EBL). This excludes all the SSRQs in the 3LAC catalog from our MAGN sample, leaving 17 radio galaxies.
Table 1 reports the -ray properties of the 17 Fermi-LAT radio galaxies. They are weak sources with 1–100 GeV fluxes of the order of photons cm-2 s-1, and have power-law spectral indices () in the range 1.8–2.8. In only two cases, NGC 6251 and NGC 1275, the spectra are curved and better reproduced by a logparabola model, rather than a power-law [33, 44]. In the logparabola model444 the deviation from the power law is modeled by the parameter, also listed in Table 1.
In Table 2, TeV spectral slopes and fluxes ( GeV) of the five sources detected also by Cherenkov Telescopes up to 210 TeV are listed together with their 2FHL properties. In spite of the partial overlap of the energy bands, the Fermi-LAT and IACT results are consistent within the large uncertainties.
| 3FGL Name | Object | Class | z | Modela | F | |
| phot cm-2 s-1 | ||||||
| 3FGL J0308.6+0408 | 3C 78 | FRI | 0.029 | PL | 2.10.1 | (5.91.0) |
| 3FGL J0316.6+4119 | IC 310 | FRI | 0.018 | PL | 1.90.1 | (6.61.5) |
| 3FGL J0319.8+4130 | NGC 1275 | FRI | 0.018 | LogPar | 1.980.01 | (2.120.04) |
| (6.50.7) | ||||||
| 3FGL J0322.53721 | Fornax Ab | FRI | 0.0058 | PL | 2.20.1 | (4.70.8) |
| 3FGL J0334.2+3915 | B2 0331+39 | FRI | 0.0206 | PL | 2.10.2 | (3.70.9) |
| 3FGL J0418.5+3813c | 3C 111 | FRII | 0.049 | PL | 2.790.08 | (7.31.3) |
| 3C 120c | FRI | 0.033 | PL | 2.70.1 | (5.41.1) | |
| 3FGL J0519.24542 | Pictor A | FRII | 0.035 | PL | 2.50.2 | (3.20.7) |
| 3FGL J0627.03529 | PKS 062535 | FRI | 0.055 | PL | 1.870.06 | (1.40.1) |
| 3FGL J0758.7+3747 | 3C 189 | FRI | 0.0428 | PL | 2.20.2 | (2.50.7) |
| 3FGL J1145.1+1935 | 3C 264 | FRI | 0.0217 | PL | 2.00.2 | (2.70.7) |
| 3FGL J1230.9+1224 | M 87 | FRI | 0.0042 | PL | 2.040.07 | (1.30.1) |
| 3FGL J1325.44301 | Cen A core | FRI | 0.0018 | PL | 2.700.02 | (3.40.2) |
| 3FGL J1330.03818 | Tol 1326379 | FR0 | 0.0284 | PL | 2.8 | (3.10.8) |
| 3FGL J1346.66027 | Cen B | FRI | 0.013 | PL | 2.320.01 | (2.00.2) |
| 3FGL J1442.6+5156 | 3C 303 | FRII | 0.141 | PL | 1.90.2 | (1.90.5) |
| 3FGL J1630.6+8232 | NGC 6251 | FRI | 0.025 | LogPar | 2.040.08 | (1.30.1) |
| 0.17 | ||||||
| a – PL - ; LogPar - . | ||||||
| b – -ray emission associated to radio lobes [45] . | ||||||
| c – Spectral parameters from [42] . | ||||||
| Objecta | F | F | TeV | ||
|---|---|---|---|---|---|
| GeV | GeVc | ref | |||
| IC 310d | 1.3 | 2209 | 1.81-1.85 | 6-43 | [46] |
| NGC 1275 | 3.0 | 5113 | 4.1 | 13 | [35] |
| PKS 062535 | 1.9 | 2911 | 2.8 | 20e | [39] |
| M 87d | 2.3 | 2210 | 2.2-2.6 | 30-60 | [47] |
| Cen A | 2.6 | 18 | 2.73 | 7.6e | [37] |
a – The 2FHL catalog reports the detection of 3C 264. It was not included in Table because its Fermi-LAT spectrum does not extend above 171 GeV [34].
b – In unit of photon cm-2 s-1.
c – Fluxes provided by different Cherenkov telescopes can cover different energy bands. was extrapolated down to 100 GeV, when necessary.
d – Variable source.
e – Flux uncertainty of the order of .
Finally, we note that our Fermi-LAT sample is obviously biased towards sources with a high-energy (approximately in the MeV-GeV band) SED peak. It is possible that we are missing MAGN peaking at very high energies. They could be below the Fermi-LAT sensitivity threshold and emerge in the CTA band. IC 310 is an example, although less extreme. It is barely detected with a very low flux by Fermi-LAT but firmly detected with a flat spectrum at VHE [48, 46] with no sign of a falling trend up to 10 TeV.
3 CTA simulations of Fermi-LAT radio galaxies
The connection between the Fermi-LAT and IACT data is complex. First of all, data in these two bands are usually not contemporaneous. This is relevant because MAGNs can vary both in the LAT band [49] and in the TeV band [50, 51, 47, 52, 46] and the variability is not necessarily correlated. Moreover, while an extrapolation of the Fermi-LAT spectrum fits well the non-simultaneous MAGIC TeV data points of M 87 in a low state [53], a curvature in the overall spectrum of NGC 1275 is clearly established by two simultaneous MAGIC - Fermi-LAT campaigns [49]. In addition, the MeV-GeV and the TeV emissions might be produced by distinct components as in the case of Centaurus A, where a second spectral component seems to emerge between the Fermi-LAT and H.E.S.S. spectra [54, 55]. This spectral component could be the signature of efficient pulsar-like electron acceleration mechanisms occurring in the black-hole magnetosphere [56] or could mark the presence of an hadronic process [57]; alternatively, it could be related to a population of millisecond pulsars. Another, even more exciting, possibility is that such a component is produced by heavy dark matter (DM) particles clustered around the black hole [58]. The discovery of the VHE hardening of the Centaurus A spectrum opens new interesting scenarios that CTA will be able to explore.
Finally we note that a GeV contribution from the radio lobes has been revealed in two nearby sources: CenA [59] and Fornax A [45].
The poor LAT spatial resolution ( at 10 GeV and larger at lower energies) does not allow us to disentangle different emission regions in other MAGN. However GeV flux variability observed in 3C 120 [42, 60], 3C 111 [61], NGC 1275 [62, 63], M 87 [47] and IC 310 [46] suggest that most of the high and very high energy photons are dissipated in compact region.
Keeping in mind all the caveats reported above, we decided to simulate the GeV-TeV spectra of radio galaxies assuming the compact jet core as the main source of GeV photons. Studies of extended emitting regions require further CTA simulations that are beyond the scope of this first explorative work on the CTA performances.
We considered different spectral shapes.
At first, a simple extrapolation of the Fermi-LAT power-law (PL) was assumed, then an
exponential cutoff555 was included.
We considered three possible cutoffs at decreasing energies =1 TeV, =500 GeV, and =100 GeV to
take into account different spectral steepenings. As a spectral curvature is already present in the Fermi-LAT spectrum of NGC 6251,
we extrapolated the logparabola model of the 3FGL catalog (rather than a power-law) and, in addition, we tested a power-law with a cutoff at 100 GeV as another possible parameterization of the
high-energy steepness. Actually, it is usually difficult to distinguish between a logparabola model and a cutoff power-law with the current data, as also shown by the Fermi-MAGIC study of NGC 1275 [49].
Obviously, our approach reflects the lack of information on the SED of MAGNs in the TeV domain.
It is mainly driven by the Fermi-LAT and IACT observations of M 87 and NGC 1275. It is also evident that we are adopting the less favorable scenarios, not considering any flattening of the very high-energy spectrum, as observed in Centaurus A.
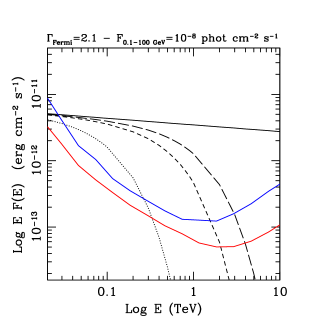
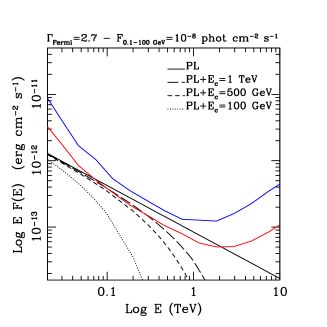
In Fig. 1 the adopted models are shown along with the
current differential sensitivity curves for 50 hours of observation for the
Northern (blue line) and the Southern CTA array (red line).
As an example, we plot the simulated models for two different power-law spectral slopes, i.e 2.1 (left panel) and
2.7 (right panel) and same
input flux ph cm-2 s-1.
It is clear from Fig. 1 that, apart from the cutoff energy position (), the spectral index is a fundamental parameter: flat Fermi-LAT sources are more suitable CTA targets. This will be further confirmed by the specific simulations of the MAGN sample discussed later in detail.
Finally, we note that, as expected, the best performance is provided by the Southern Array which consists of a larger number of telescopes.
The spectra of the radio galaxies in Table 1 were simulated in the energy range 0.02–100 TeV using the software ctools v1.0666http://cta.irap.omp.eu/ctools [64], developed for the scientific analysis of CTA data. Also Fornax A, that is part of the sample, was considered, although the ray emission has been recently associated with the radio lobes [45]. As our simulations are based on point-like sources, the results should be taken with caution. We did not consider the sources with TeV observations, with the exception of PKS 062535 for which only a recent claim of detection has been reported [39].
For each source, an event list corresponding to a particular model was produced considering a 5∘ circular region of interest (ROI) centered on the point-like target. The most recent Instrument Response Functions (IRF, version from 20150505)777https://www.cta-observatory.org/science/cta-performance/ provided by the CTA, supplying information on effective area, point spread function, energy dispersion and instrumental background of the CTA configurations in the two hemispheres were assumed for an observation time of 50 hours.
A standard unbinned likelihood analysis was then performed to test the significance of the source. We considered the Test Statistic that is defined as TS = 2[logLs-logL0] where Ls is the maximum likelihood value for a model with our source at a specified location and L0 is the maximum likelihood value for a model without the source [65]. Only the normalization and the spectral index were allowed to vary. With the square root of the TS corresponding approximately to the detection significance, we consider thresholds of TS100 (corresponding to approximately 10) and TS25 () to assess the detectability of MAGNs by CTA.
4 Results
The results of the simulations are summarized in Table 3. We expect that 7 out of 12 MAGNs (8 out 13 if Fornax A is also considered) will be detected at Very High Energies if the simulated CTA spectrum is a direct extrapolation of the Fermi-LAT power-law. The number of likely CTA candidates obviously decreases with the steepening of the spectrum in the TeV band. However, half of the sources are still above the CTA sensitivity threshold (and three at a significance level larger than ) if the spectral cutoff occurs at energies 500 GeV.
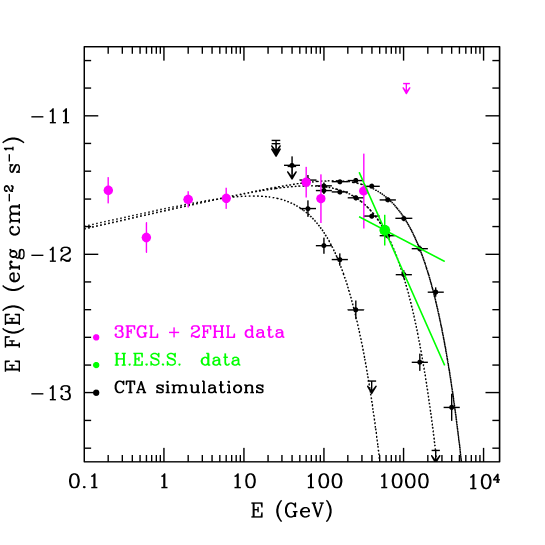
PKS 062535 is the only MAGN with a TS value larger than 100 for each tested model, and indeed a TeV detection has been recently reported by the H.E.S.S. collaboration [39]. In Figure 2, the CTA simulated spectra of PKS 062535 are shown together with the Fermi-LAT and H.E.S.S. data. The H.E.S.S. data (falling between two CTA models) suggest a high-energy cutoff between 0.5 and 1 TeV. In order to quantify the CTA ability to discriminate among different models, the simulation of PKS 062535 with GeV was fitted with both a power law and a cutoff power law. All the parameters (spectral slope, normalization, and ) were freely adjusted by the fit. A likelihood ratio test TScurve=2[log L(Power Lawcutoff) - log L(Power Law)] was then calculated. As TScurve is distributed as with 1 degree of freedom [66], we can assume that a curved spectrum is better than a power law when TScurve is larger than 16 (corresponding to significance for the curvature). The TScurve value of 400 obtained for PKS 062535 shows that a spectral bending is statistically preferred to a power law and attests that the CTA Southern array will not only be able to observe this source but also to discriminate among different spectral shapes. Finally, we note that PKS 062535 could be detected in only 5 hours with a TS 600 for GeV.
Faint ( phot cm-2 s-1) and steep () MAGNs have TS values below the threshold of 25 (see Table 3), independently of the adopted input model (see also Section 2). We note, however, that radio galaxies are variable sources. For example, 3C 120 underwent several flares, reaching in some cases fluxes of ph cm-2 s-1 [60], and 3C 111 was detected in a very high state 888https://www.bu.edu/blazars/VLBAGLAST/3c111.html in more than one observation, exceeding the flux of ph cm-2 s-1. If the jet perturbations responsible for the Fermi-LAT flares also cause bursts at TeV energies, 3C 120 and 3C 111 could be detected by the CTA (assuming power-law spectra) during flaring episodes.
Finally, we observe that a direct extrapolation of the logparabola model for NGC 6251 gives a non-detection with the CTA. However, a less abrupt decrease of the VHE emission, as described by a power-law with a cutoff at 100 GeV, provides a marginal detection of the source (TS 25).
In summary, unless MAGN emission falls down rapidly at the extreme end of the LAT band, the new generation of Cherenkov telescopes can provide high signal-to-noise spectra (see Figure 2) for several misaligned AGN permitting the extension of their Spectral Energy Distribution above 1 TeV. This will allow a deeper investigation of the still debate nature of the second emission peak and, in particular, to confirm or reject the presence of an additional high-energy component (which presently has been observed only in Cen A).
| Source | TSPL | TS | TS | TS | |
|---|---|---|---|---|---|
| 3C 78 | 47 | 3113 | 256 | 96 | … |
| Fornax Ac | 20 | 1671 | 100 | 25 | … |
| B2 0331+39 | 24 | 1049 | 65 | … | … |
| 3C 111 | 1.6 | … | … | … | … |
| 3C 120 | 1.9 | … | … | … | … |
| Pictor A | 3.3 | … | … | … | … |
| PKS 062535 | 300 | 154480 | 16987 | 7294 | 287 |
| 3C 189 | 13 | 321 | … | … | … |
| 3C 264 | 33 | 2129 | 128 | 44 | … |
| Tol 1326379 | 0.7 | … | … | … | … |
| Cen B | 48 | 4066 | 520 | 212 | … |
| 3C 303 | 32 | 3010 | 134 | 55 | … |
| NGC 6251d | 55.3 | 25 |
a Resulting TS from simulations assuming a simple extrapolation
of the Fermi-LAT power-law, and an exponential cutoff at 1 TeV, 0.5 TeV and 0.1 TeV, respectively. (…) indicates TS.
b Normalization in units of photons cm-2
s-1 MeV-1 at 300 GeV.
c Fornax A -ray emission is probably produced in the extended radio lobes. See text for details.
d Only a power-law with cutoff at 100 GeV was simulated for NGC 6251, as a spectral bending is already present in the Fermi-LAT band.
5 Extension of the MAGN results
In order to generalize the results obtained for the Fermi-LAT radio galaxies, we simulated a grid of possible CTA observations with the Northern and Southern arrays, separately with the aim of producing a diagnostic plot to verify the detectability of any AGN in the TeV band, provided that its spectral slope and flux in the Fermi-LAT band are known. The simulation of the event files and then the likelihood analysis are the same as described in the previous section. We explored -ray targets with fluxes (1,2,4,6, 8) ph cm-2 s-1 between 1 and 100 GeV (the flux ranges covered by the AGN in the 3LAC catalog) and power-law spectral slope values ranging from 1.8 to 4.0 with an incremental step of . We did not consider because, as indicated by the MAGN simulations, hard sources, even characterized by a LAT flux as low as ph cm-2 s-1, can easily reach a TS larger than 100. Both spectral slopes and normalizations were allowed to vary during the likelihood analysis.
Figure 3 summarizes the results: the input parameters, i.e. the 1–100 GeV flux and the power-law spectral slope, are reported on the x-axis and y-axis, respectively. The red (Southern hemisphere) and the blue (Northern hemisphere) curves connect the points of the grid for which a TS is obtained for 50 hours of observation. The targets with a significance larger than occupy the left part of the plot, those below the CTA sensitivity the right one. As a check of the reliability of our simulations, we also plot the previous studied MAGNs (red and blue circles) and the radio galaxies already detected by the Cherenkov telescopes (green points). They fall in the ”correct” regions of the plot (compare with Table 3). Cen A falls exactly in the strip delimiting the detection from the non-detection regions, although an H.E.S.S spectrum is already available for this source [37]. This is clearly related to the hardening of the spectrum [54] that our conservative simulation does not take into account.
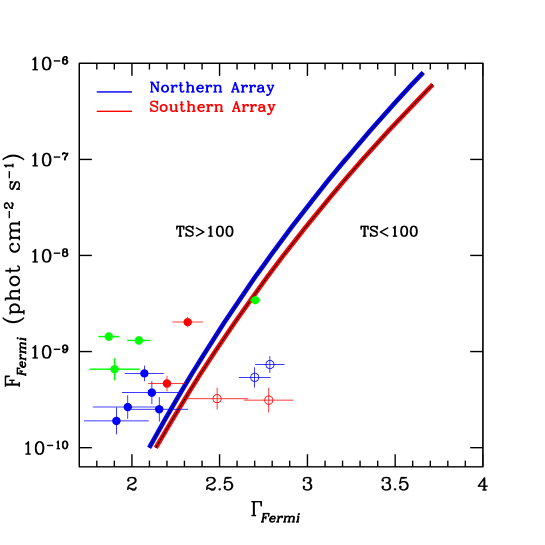
We predict that hard sources with can be easily revealed down to 1–100 GeV fluxes of the order of 10-10 phot cm-2 s-1 (as already anticipated in Section 2, see also Figure 2), while AGNs with moderately steep slopes ( 2.4-2.8) require 1–100 GeV fluxes larger than 10-9 phot cm-2 s-1 to overcome the sensitivity threshold of the Cherenkov arrays. Sources with very steep spectra () need 1–100 GeV fluxes as high as 10-8– phot cm-2 s-1 to emerge in the TeV sky.
6 Conclusions
The aim of this work is to evaluate the impact of the next-generation Cherenkov Telescope Array on TeV studies of Misaligned Active Galactic Nuclei. Up to now, this class includes only 17 radio galaxies detected at GeV energies by Fermi-LAT (out of more than 3000 objects detected in total) and 5 sources detected in the TeV band by Cherenkov telescopes (out of about 60 radio-loud AGNs in the TeVCat online catalog).
In this study, we investigated the CTA detection prospects for MAGNs by simulating CTA observations for a sample of candidate sources observed by Fermi-LAT . The main results of our work can be summarized as follows.
-
1.
We predict 8 new MAGNs at the significance level, under the assumption of a straight extrapolation of the Fermi-LAT power-law in the CTA energy range.
-
2.
Assuming a power-law with an exponential cutoff as a more realistic case, we still predict 5 (6) new detections at a significance higher than (), for a high-energy cutoff of 500 GeV.
-
3.
Additionally, our simulated data show that CTA will be able to provide higher quality spectra with respect to current Cherenkov facilities. We show this for the case of the newly TeV detected source PKS 062535.
Moreover, we generalize our conclusions by introducing a plot which
allows estimating whether a Fermi-LAT AGN will be detectable with the
CTA, given its flux and spectral slope in the 1–100 GeV energy range and assuming a simple extrapolation of the LAT power law spectrum into the TeV band.
We note that our estimates leave room for additional detections, since radio galaxies are variable sources, both in the Fermi-LAT band and at Very High Energies. Additionally, a harder-when-brighter spectral behavior has been observed in several Fermi-LAT AGNs, including radio galaxies [60]. This can further enhance even more the possibility of detecting a larger number of sources during flaring states, thanks to the harder -ray spectrum.
It should be also taken into account that our sample is, by definition, biased towards sources with a high-energy SED peak in the Fermi-LAT band. This leaves out high-energy-peaked sources such as (or more extreme than) IC 310, which are faint in the Fermi-LAT band but should be detectable in the VHE regime.
Finally, we point out that radio galaxies could have a more complex SED than expected.
For example, there is evidence for a second spectral component in Cen A
that hardens the spectrum above 2 GeV (the slope changes from 2.7 a 2.1) [54].
If this were a common feature in radio galaxies, MAGNs could be more easily revealed by CTA, opening at the same time new extremely appealing scenarios.
Our results indicate that long exposures are necessary, however, to study MAGNs that are in general steep and faint sources.
An extragalactic survey does not appear suitable for the exploration of this class of objects.
The CTA Key Science Projects, for example, include an extragalactic survey of 1/4th
of the sky in about 1000 hours [67]. The area covered is of the order of
deg2. Given that the largest field-of-view
for the CTA will be ∘ (for the SSTs), this implies an
effective observing time per pointing of the order of a few hours.
An efficient strategy for radio galaxies seems to require long targeted campaigns with
effective observing times of the order of 50 hours.
This could be
achieved more easily, for example, by operating the CTA in subarrays. Because of the
relatively steep spectra of the sources, most of the emission will
fall in the energy band covered by the LSTs and MSTs. Therefore, it could be possible to observe this small sample of sources with these
telescopes as a subarray, while the SSTs gain exposure on an extreme
source of -rays at the highest energies.
In conclusion, we predict that the CTA will have a significant impact
in our understanding of MAGNs at TeV energies, with the likely
detection of additional sources. This would be an additional step
towards an understanding of this class of AGNs at TeV energies that relies
less on the properties of a single source, and more on the common
behavior. Moreover,
obtaining better quality data on already detected sources would be
crucial in order to distinguish between different emission models to
explain their VHE emission.
Acknowledgements
This paper has gone through internal review by the CTA Consortium. We would like to thank the two reviewers of the CTA Speaker’s and Publication Office (SAPO) for their useful comments on the manuscript, and the anonymous referee for a helpful and constructive report. We thank Valentina Fioretti for precious help in the installation of the software package ctools. This research made use of ctools, a community-developed analysis package for Imaging Air Cherenkov Telescope data. ctools is based on GammaLib, a community-developed toolbox for the high-level analysis of astronomical gamma-ray data.
References
References
- [1] G. Miley, ARAA 18 (1980) 165.
- [2] R. Blandford, W. East, K. Nalewajko, Y. Yuan, J. Zrake, arXiv:1511.07515.
- [3] G. Fossati, L. Maraschi, A. Celotti, A. Comastri, G. Ghisellini, MNRAS 299 (1998) 433.
- [4] L. Maraschi, G. Ghisellini, A. Celotti, ApJL 397 (1992) L5.
- [5] M. Sikora, M. C. Begelman, M. J. Rees, ApJ 421 (1994) 153.
- [6] F. Tavecchio, L. Maraschi, R. M. Sambruna, C. M. Urry, ApJL 544 (2000) L23.
- [7] M. Böttcher, Fermi Meets Jansky - AGN at Radio and Gamma-Rays”, Eds.: Savolainen, T., Ros, E., Porcas, R. W., and Zensus, J. A, arXiv:1006.5048.
- [8] M. Böttcher, A. Reimer, K. Sweeney, A. Prakash, ApJ 768 (2013) 54.
- [9] P. D. Barthel, ApJ 336 (1989) 606.
- [10] C. M. Urry, P. Padovani, PASP 107 (1995) 803.
- [11] B. L. Fanaroff, J. M. Riley, MNRAS 167 (1974) 31.
- [12] P. Padovani, C. M. Urry, ApJ 356 (1990) 75.
- [13] P. Padovani, C. M. Urry, ApJ 368 (1991) 373.
- [14] C. M. Urry, P. Padovani, M. Stickel, ApJ 382 (1991) 501.
- [15] P. Padovani, C. M. Urry, ApJ 387 (1992) 449.
- [16] R. D. Baldi, A. Capetti, G. Giovannini, AA 576 (2015) A38.
- [17] A. P. Marscher, S. G. Jorstad, J.-L. Gómez, M. F. Aller, H. Teräsranta, M. L. Lister, A. M. Stirling, Nature 417 (2002) 625.
- [18] R. Chatterjee, A. P. Marscher, S. G. Jorstad, A. R. Olmstead, I. M. McHardy, M. F. Aller, H. D. Aller, A. Lähteenmäki, M. Tornikoski, T. Hovatta, K. Marshall, H. R. Miller, W. T. Ryle, B. Chicka, A. J. Benker, M. C. Bottorff, D. Brokofsky, J. S. Campbell, T. S. Chonis, C. M. Gaskell, E. R. Gaynullina, K. N. Grankin, C. H. Hedrick, M. A. Ibrahimov, E. S. Klimek, A. K. Kruse, S. Masatoshi, T. R. Miller, H.-J. Pan, E. A. Petersen, B. W. Peterson, Z. Shen, D. V. Strel’nikov, J. Tao, A. E. Watkins, K. Wheeler, ApJ 704 (2009) 1689.
- [19] R. Chatterjee, A. P. Marscher, S. G. Jorstad, A. Markowitz, E. Rivers, R. E. Rothschild, I. M. McHardy, M. F. Aller, H. D. Aller, A. Lähteenmäki, M. Tornikoski, B. Harrison, I. Agudo, J. L. Gómez, B. W. Taylor, M. Gurwell, ApJ 734 (2011) 43.
- [20] M. Chiaberge, A. Celotti, A. Capetti, G. Ghisellini, AA 358 (2000) 104.
- [21] A. A. Abdo, et al., ApJ 699 (2009) 31.
- [22] A. A. Abdo, et al., ApJ 707 (2009) 55.
- [23] A. A. Abdo, et al., ApJ 719 (2010) 1433.
- [24] G. Migliori, P. Grandi, E. Torresi, C. Dermer, J. Finke, A. Celotti, R. Mukherjee, M. Errando, F. Gargano, F. Giordano, M. Giroletti, AA 533 (2011) A72.
- [25] G. Ghisellini, F. Tavecchio, MNRAS 448 (2015) 1060.
- [26] M. Georganopoulos, D. Kazanas, ApJL 594 (2003) L27.
- [27] G. Ghisellini, F. Tavecchio, M. Chiaberge, A&A 432 (2005) 401.
- [28] F. Tavecchio, G. Ghisellini, MNRAS 385 (2008) L98.
- [29] F. Tavecchio, G. Ghisellini, MNRAS 443 (2014) 1224.
- [30] M. Giroletti, G. Giovannini, L. Feretti, W. D. Cotton, P. G. Edwards, L. Lara, A. P. Marscher, J. R. Mattox, B. G. Piner, T. Venturi, ApJ 600 (2004) 127.
- [31] Y. Y. Kovalev, M. L. Lister, D. C. Homan, K. I. Kellermann, ApJL 668 (2007) L27.
- [32] H. Nagai, T. Haga, G. Giovannini, A. Doi, M. Orienti, F. D’Ammando, M. Kino, M. Nakamura, K. Asada, K. Hada, M. Giroletti, ApJ 785 (2014) 53.
- [33] M. Ackermann, et al., ApJ 810 (2015) 14.
- [34] M. Ackermann, et al., ApJS 222 (2016) 5.
- [35] J. Aleksić, et al., A&A 539 (2012) L2.
- [36] F. Aharonian, et al., AA 403 (2003) L1.
- [37] F. Aharonian, et al., ApJ 695 (2009) L40.
- [38] J. Aleksić, et al., ApJL 723 (2010) L207.
- [39] M. Dyrda, A. Wierzcholska, O. Hervet, R. Moderski, M. Janiak, M. Ostrowski, Ł. Stawarz, for the H. E. S. S. Collaboration, Proceedings of the 34th International Cosmic Ray Conference (ICRC2015), The Hague, The Netherlands.arXiv:1509.06851.
- [40] B. S. Acharya, M. Actis, T. Aghajani, G. Agnetta, J. Aguilar, F. Aharonian, M. Ajello, A. Akhperjanian, M. Alcubierre, J. Aleksić, et al., Astroparticle Physics 43 (2013) 3.
- [41] A. A. Abdo, et al., ApJ 720 (2010) 912.
- [42] C. Casadio, J. L. Gómez, P. Grandi, S. G. Jorstad, A. P. Marscher, M. L. Lister, Y. Y. Kovalev, T. Savolainen, A. B. Pushkarev, ApJ 808 (2015) 162.
- [43] P. Grandi, A. Capetti, R. D. Baldi, MNRAS 457 (2016) 2.
- [44] F. Acero, et al., ApJS 218 (2015) 23.
- [45] M. Ackermann, et al., ApJ 826 (2016) 1.
- [46] J. Aleksić, et al., AA 563 (2014) A91.
- [47] E. Aliu, et al., ApJ 746 (2012) 141.
- [48] A. Neronov, D. Semikoz, I. Vovk, AA 519 (2010) L6.
- [49] J. Aleksić, et al., AA 564 (2014) A5.
- [50] F. Aharonian, et al, Science 314 (2006) 1424.
- [51] V. A. Acciari, et al., ApJ 679 (2008) 397.
- [52] A. Abramowski, F. Acero, F. Aharonian, A. G. Akhperjanian, G. Anton, A. Balzer, A. Barnacka, U. Barres de Almeida, Y. Becherini, J. Becker, et al., ApJ 746 (2012) 151.
- [53] J. Aleksić, et al., AA 544 (2012) A96.
- [54] N. Sahakyan, R. Yang, F. A. Aharonian, F. M. Rieger, ApJ 770 (2013) L6.
- [55] N. Fraija, MNRAS 441 (2014) 1209.
- [56] F. M. Rieger, F. A. Aharonian, AA 506 (2009) L41.
- [57] M. Petropoulou, E. Lefa, S. Dimitrakoudis, A. Mastichiadis, AA 562 (2014) A12.
- [58] A. M. Brown, C. Boehm, J. Graham, T. Lacroix, P. M. Chadwick, J. Silk, ArXiv e-printsarXiv:1603.05469.
- [59] A. A. Abdo, et al., Science 328 (2010) 725.
- [60] M. Janiak, M. Sikora, R. Moderski, MNRAS 458 (2016) 2360.
- [61] P. Grandi, E. Torresi, C. Stanghellini, ApJL 751 (2012) L3.
- [62] J. Kataoka, Ł. Stawarz, C. C. Cheung, G. Tosti, E. Cavazzuti, A. Celotti, S. Nishino, Y. Fukazawa, D. J. Thompson, W. F. McConville, ApJ 715 (2010) 554.
- [63] R. Mukherjee, VERITAS Collaboration, The Astronomer’s Telegram 9690.
- [64] J. Knödlseder, M. Mayer, C. Deil, J.-B. Cayrou, E. Owen, N. Kelley-Hoskins, C.-C. Lu, R. Buehler, F. Forest, T. Louge, H. Siejkowski, K. Kosack, L. Gerard, A. Schulz, P. Martin, D. Sanchez, S. Ohm, T. Hassan, S. Brau-Nogué, AA 593 (2016) A1.
- [65] J. R. Mattox, D. L. Bertsch, J. Chiang, B. L. Dingus, S. W. Digel, J. A. Esposito, J. M. Fierro, R. C. Hartman, S. D. Hunter, G. Kanbach, D. A. Kniffen, Y. C. Lin, D. J. Macomb, H. A. Mayer-Hasselwander, P. F. Michelson, C. von Montigny, R. Mukherjee, P. L. Nolan, P. V. Ramanamurthy, E. Schneid, P. Sreekumar, D. J. Thompson, T. D. Willis, ApJ 461 (1996) 396.
- [66] P. L. Nolan, et al., ApJS 199 (2012) 31.
- [67] G. Dubus, J. L. Contreras, S. Funk, Y. Gallant, T. Hassan, J. Hinton, Y. Inoue, J. Knödlseder, P. Martin, N. Mirabal, M. de Naurois, M. Renaud, CTA Consortium, Astroparticle Physics 43 (2013) 317.