LONG-TERM STUDY OF THE DOUBLE PULSAR J0737-3039 WITH XMM-NEWTON: SPECTRAL ANALYSIS
Abstract
We present a long-term spectral monitoring of the unique Double Pulsar binary PSR J0737-3039 corresponding to two ”Large Programs” performed by XMM-Newton in 2006 and 2011. Spectral variability of pulsar emission in soft X-rays is not evident over 5 years, despite the significant relativistic spin precession in the considered time span (). We provide, for the first time, evidence of hard X-ray emission from the system in the keV energy band. The standard spectral analysis was coupled to the energy dependent spatial analysis to confirm this excess, most likely ascribed to iron line emission. The Fe K emission line at keV was previously unheard-of in non-accreting binary systems and could testify to the presence of a relic disk that survived the supernova explosions that terminated the lives of the Double Pulsar’s stellar progenitors. The existence of a relic disk in this system reinforces speculation about the presence of similar structures around other peculiar classes of isolated neutron stars.
1 Introduction
Fourteen years after its discovery, the Double Pulsar PSR J0737-3039 is still studied extensively. This system is composed of two neutron stars: an old, fast, mildly recycled 22.7 ms pulsar (hereafter referred to as Pulsar A; Burgay et al. 2003) and a younger and much slower pulsar with a period of 2.77 s (hereafter Pulsar B; Lyne et al. 2004). The compact objects orbit each other in a very tight orbit in only 2.4 hr, with mean orbital velocities of about 1 million km/h (see e.g. Kramer & Stairs, 2008, for a review).
PSR J0737-3039 represents the most compact relativistic system and the only binary system in which both neutron stars have been detected as radio pulsars. The Keplerian and post-Keplerian parameters offer a unique test for theories of strong field gravity (Kramer & Stairs, 2008; Kramer et al., 2006; Lyne et al., 2004), and constrain the masses of both neutron stars with high accuracy. The physical riches of the Double Pulsar have been highlighted from the radio observations (Kramer & Wex, 2009; Kramer & Stairs, 2008): whereas the pulse profile of Pulsar A has been stable, the pulsed emission of Pulsar B showed strong orbital flux and profile variations, before disappearing entirely in 2008 (Perera et al., 2010). Moreover, as a direct consequence of the inclination of a system observed nearly edge-on (i), radio eclipses were detected when Pulsar A passed behind Pulsar B (Breton et al., 2008; Kaspi et al., 2004; McLaughlin et al., 2004). The study of the light curves testified to a new type of interaction between Pulsar A’s relativistic particle wind and Pulsar B’s magnetosphere in the previously unexplored close environment between the two neutron stars. This aroused the interest to carry out high-energy observations in the X-ray band to investigate further the intra-binary environment.
Early observations performed by the Chandra and XMM-Newton satellites (Pellizzoni et al., 2008; Possenti et al., 2008; Chatterjee et al., 2007; Campana et al., 2004; McLaughlin et al., 2004; Pellizzoni et al., 2004) pointed out the difficulty to constrain the origin of the multifold nature of the Double Pulsar’s X-ray emission. The non-thermal pulsed emission from Pulsar A, although very soft (power-law slope ), is clearly predominant in the X-ray flux (Pellizzoni et al., 2008; Possenti et al., 2008; Chatterjee et al., 2007).
In the frame of a first XMM-Newton ”Large program” of 235 ks exposure in 2006, pulsed X-ray emission from Pulsar B was also detected in part of the orbit. Due to its own low rotational energy loss, X-ray emission from Pulsar B can be only powered externally through the spin-down energy of Pulsar A (Pellizzoni et al., 2008). This emission, consistent with thermal radiation of temperature kT eV and bolometric luminosity of erg s-1, was ascribed to the heating of Pulsar B’s surface by Pulsar A’s wind. A hotter ( eV) and fainter ( erg s-1) thermal component, possibly originating from backfalling material heating the polar caps of either Pulsar A or Pulsar B, was also suggested from the spectral analysis by Pellizzoni et al. (2008).
In 2011, a second deep XMM-Newton observation of 370 ks was carried out. Comprehensive timing analysis over such a large time span has confirmed X-ray pulsed emission from Pulsar B even after its radio disappearance (Iacolina et al., 2016). The unusual phenomenology of Pulsar B’s X-ray emission includes orbital pulsed flux and profile variations as well as a loss of pulsar phase coherence on time scales of years, suggesting orbital-dependent penetration of Pulsar A’s wind plasma onto Pulsar B’s closed field lines. Furthermore, timing analysis of the full XMM-Newton dataset provided first evidence of orbital flux variability (), possibly involving a bow-shock between pulsar structures (Iacolina et al., 2016). An additional, possibly hard, spectral component associated with this intra-binary environment is then expected.
In this paper, we present a comprehensive spectral analysis of the full XMM-Newton dataset from both large programs, which allows us for the first time to constrain high-energy components above 4 keV. Because of the weakness of the source and the consequent need to scrutinize the low-count statistics, an in-depth revision of the background subtraction procedure is provided. The standard spectral analysis was coupled with an independent source detection method based on likelihood spatial analysis. The complementarity of both approaches allows us to speculate for the first time on the possible presence of an iron line in the Double Pulsar.
2 Data reduction and background mitigation
| Obs date | Instrument | Total Exp Time | Observing TimeaaAfter dead-time correction and screening for soft proton flares. | ||||
|---|---|---|---|---|---|---|---|
| (ks) | (ks) | ||||||
| orb1bb“orb*” refers to the XMM-Newton orbits during the observations of PSR J0737–3039 (catalog ): orbits 1260 and 1261 in 2006, and orbits 2174, 2175 and 2176 in 2011. | orb2 | orb3 | orb1 | orb2 | orb3 | ||
| 2006 | pn | 120 | 115 | 82 | 76 | ||
| MOS 1 | 120 | 114 | 112 | 103 | |||
| MOS 2 | 120 | 114 | 112 | 104 | |||
| 2011 | pn | 129 | 106 | 128 | 88 | 68 | 84 |
| MOS 1 | 108 | 103 | 128 | 104 | 84 | 112 | |
| MOS 2 | 129 | 103 | 128 | 122 | 84 | 112 | |
Both XMM-Newton Large Programs were carried out with similar instrumental configurations suitable for simultaneous spectral and high-resolution timing analysis of the Double Pulsar. For these purposes, the EPIC-pn (Strüder et al., 2001) was used in “Small Window” mode whose time resolution of 5.67 ms compares with Pulsar A’s period of 22.7 ms. The EPIC-MOS cameras (Turner et al., 2001) were also operated in “Small Window” mode with a time resolution of 0.3 s only suitable for Pulsar B timing analysis. Medium and thin optical filters were applied to the EPIC instruments in 2006 and 2011, respectively. The thin filter nearly doubles the instrument effective area in the soft band ( keV) at the expense of higher background contamination: early X-ray observations of the Double Pulsar showed a very soft source spectrum motivating the use of the thin filter for subsequent observations in order to improve the overall counting statistics.
The XMM-Newton data were processed using the Science Analysis Software (SAS) version 12. The calibrated and concatenated EPIC event lists were obtained by running the meta-tasks epproc and emproc, standard pipeline tasks for EPIC-MOS and EPIC-pn observations respectively. We performed a barycentric correction on the event files thanks to the task barycen using the JPL DE405 ephemeris to convert the time of arrival of photons from the satellite position to the solar-system barycenter.
Because of the faintness of the Double Pulsar in X-rays, careful attention was provided in the assessment and mitigation of background contamination and in the selection of source photons. Strong flares most likely associated with cosmic soft proton events, significantly affected different observations. In order to discard these episodes, we produced the light curves between 10 and 12 keV to determine the flaring times. We followed a background rejection procedure according to the general prescriptions by De Luca & Molendi (2004) and further investigating and testing differing filtering options in analogy with the espfilt SAS task, and reviewing the procedure adopted by Iacolina et al. (2016) and Pellizzoni et al. (2008) for the same data. Two different photon pattern selections were considered for the distribution of incident photons over the pixels of the EPIC-pn (carrying out the analysis for both options): single and double events (pattern ) or single events only (pattern = 0), slightly reducing the effective area. As for the EPIC-MOS, single, double, triple and quadruple events were selected (pattern ).
| Detector | ModelaaModels: 1) tbabs*(po+bb), 2) tbabs*(bb+bb), 3) tbabs*(po+bb+bb). | Normpo | Normbb1 | Normbb2 | dof | |||||
|---|---|---|---|---|---|---|---|---|---|---|
| ( cm-2) | (eV) | (eV) | ||||||||
| pn | 1 | 239/206 | 1.16 | |||||||
| 2 | - | 254/206 | 1.23 | |||||||
| 3 | - | 237/204 | 1.16 | |||||||
| pn+MOS | 1 | 355/318 | 1.12 | |||||||
| 2 | - | 367/318 | 1.15 | |||||||
| 3 | 1.0 | 346/316 | 1.10 |
 |
In parallel, we cross-checked our analysis by adopting another method, which consists in analyzing the average quiescent counts rates free from flaring particle background. We extracted a 10 s binned light curve in the keV energy range from the whole field of view of each camera, omitting the source region, and selecting events below a threshold of of the quiescent rate for the EPIC-pn for pattern = 0 selection, and for pattern . As for the EPIC-MOS, the threshold was defined at from the quiescent count rate. The resulting effective observing time after this operation is reported in Table 1 together with the original total exposure time for each EPIC instrument (no significant dead-time differences are related to the two photon pattern options considered for the EPIC-pn). Alternative photon pattern selections and threshold levels provide consistent results, although the choice of pattern for the EPIC-pn is best suited for hard X-ray spectral analysis providing a higher effective area at the expenses of a background increase only in the softer energy channels ( keV).
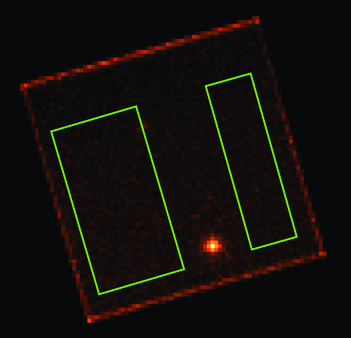
Once the EPIC event lists were cleaned from strong background contamination, we extracted the source and background spectra. The associated source’s radius of extraction was set at for the EPIC-pn, and for the EPIC-MOS providing maximum source detection significance (pulsed emission from Pulsar A) and carefully checking that residual flare contamination was not present within the selected region. The background spectra were extracted from different rectangular regions for consistency checks (see Fig. 1). The task backscale was used to calculate the area of source and background regions. Standard energy response matrices (RMFs; rmfgen) and effective area files (ARFs; arfgen) were created for each spectrum via the standard SAS tools. The background filtering and source extraction procedures provided an overall harvest of source X-ray photons considering the EPIC-pn, MOS1 and MOS2 data from both large programs.
3 Spectral analysis
Up to five significant spectral components could be in principle expected from the Double Pulsar in X-rays accordingly to theoretical models: surface thermal emission and non-thermal magnetospheric emission from both neutron stars, and orbital-phase dependent bow-shock emission due to the interaction between Pulsar A’s wind and Pulsar B’s magnetosphere. This latter non-thermal component, if present, was proved to be much weaker than expected: no clear evidence of shock emission was reported in the spectral analysis of 2006 data. While the spectrum related to that data set was correctly fitted by a two-component model (a power law plus a black body or two black bodies), the phase resolved analysis indicated that the spectrum appeared clearly dominated by pulsed non-thermal emission from Pulsar A and the off-pulse required two-components thermal emission models (Pellizzoni et al., 2008). Furthermore, only very weak orbital flux modulation () was detected as a possible signature of a bow-shock in the overall timing analysis of both large programs (Iacolina et al., 2016). Thus, a two (pl+bb) or three-component (pl+bb+bb) pulsar emission model could satisfactorily account for most of the X-ray flux from the Double Pulsar.
We used the XSPEC version 12.8 (Arnaud, 1996). All uncertainties are given at the confidence level (). The EPIC-pn, MOS1 and MOS2 data were rebinned to have at least 25 counts per energy channel. The bulk of the X-ray emission from PSR J0737-3039 is at low energy, below 1 keV. However, in order to better constrain the models, the spectral analysis was performed in the keV energy range. The probed models were all modified at low energies to account for interstellar photoelectric absorption through XSPEC Tbabs model (Wilms et al., 2000). Tbabs calculates the cross section for X-ray absorption by the ISM as the sum of the cross sections for X-ray absorption due to the ISM in its gas, grain and molecular phases.
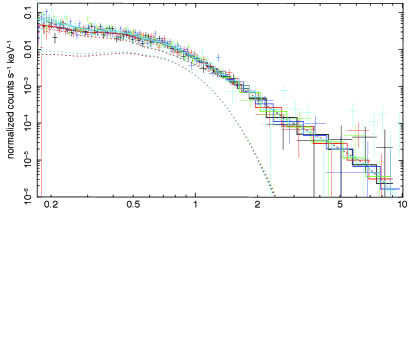
We first verified that the spectral analysis of the observations performed in 2011 provides results comparable with those related to 2006 data alone (i.e. no significant spectral variability is evident over years). For the sake of completeness, we tested both two-component and three-component fits as suggested by the phase-resolved studies on the 2006 data (Pellizzoni et al., 2008). The models were applied on the EPIC-pn data, then EPIC-pn plus MOS1 and MOS2 data. The parameters associated to the different models are reported in Table 2. The results obtained separately for the two large programs are perfectly in agreement (see Pellizzoni et al. 2008). The observed flux related to the 2011 data in the keV energy range is erg/cm2/s (using the power law plus black body model). By comparison, the observed flux was estimated at erg/cm2/s during the observations in 2006. We therefore analyzed both data sets together. A summary of models parameters is reported in Table 3.
| Detector | ModelaaModels: 1) tbabs*(po+bb), 2) tbabs*(bb+bb), 3) tbabs*(po+bb+bb). | Normpo | Normbb1 | Normbb2 | dof | |||||
|---|---|---|---|---|---|---|---|---|---|---|
| ( cm-2) | (eV) | (eV) | ||||||||
| pn | 1 | 347/333 | 1.04 | |||||||
| 2 | - | 360/333 | 1.08 | |||||||
| 3 | 1.7 | 343/331 | 1.04 | |||||||
| pn+MOS | 1 | 533/520 | 1.02 | |||||||
| 2 | - | 551/520 | 1.06 | |||||||
| 3 | 1.6 | 524/518 | 1.01 |
Since the hypothetical presence of significant bow shock emission should be associated with a hard photon index (Sturner et al., 1997), we tried to fix the photon index of the power law to a lower value, such as . The resulting fit leads to a . These results are also consistent with Pellizzoni et al. (2008).
The reported weak orbital flux variability of from timing analysis (Iacolina et al., 2016) could be in principle constrained by orbital phase resolved analysis, in spite of the relatively low count statististics involved. In fact, splitting the orbital phase interval in different sections, we did not find any significant variation of the above spectral components. In particular, we cannot claim any significant spectral changes in correspondence to peculiar orbital phases (around neutron star conjunctions and quadratures, and periastron/apoastron passages) where putative X-ray emission could in principle be enhanced due, for example, to an hypothetical anisotropic bow-shock emission (Lyutikov, 2004; Granot & Mészáros, 2004).
Though perfectly adequate for the soft X-ray band, none of these two or three-component models properly fits the data above 4 keV. By applying a two or three-component model from Table 3, an excess is clearly observed at keV (see Fig. 2), while error bars become very important above 8 keV where the background dominates.
 |
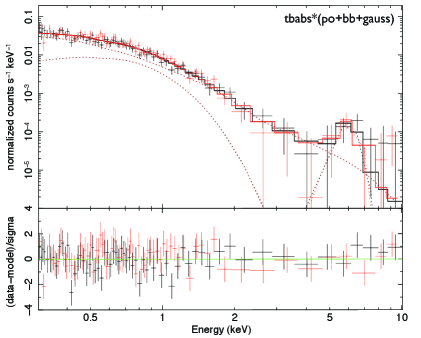
The EPIC-pn data obtained during the two Large Programs were studied separately in order to assess the spectral parameters of this newly-recognized hard component, including possible variability. The spectrum obtained in 2006 indicates an excess at keV in the two XMM-Newton orbits. A narrow Gaussian line fits adequately this excess (see Fig. 3). Its centroid energy is found at keV with the associated line width constrained to keV. The line flux photons cm-2 s-1 keV-1 represents of the total absorption-corrected luminosity L0.3-11keV = erg/s (assuming a distance of 1.1 kpc; Verbiest et al. 2012). No other simple model, such as a power law or a black body, is able to fit the high-energy excess. Since only a few source photons are detected at high energy ( in the keV range), it is not possible to assess the improvement of the fit for the whole energy range including the Gaussian line. A spectral fit comparison with or without the line was performed on the restricted energy range keV. A power law plus a blackbody component were applied to the data, with the parameters fixed to the best values found in the whole energy range. The associated is 11.4 for 7 dof (), indicating that an additional spectral contribution at high-energy is required. Indeed, the addition of a Gaussian line at keV significantly improves the fit, reaching for 4 dof (). Comparable results are obtained assuming other models in Table 3.
The use of the C-statistic (Cash, 1979) instead of the is in principle more appropriate for the fitting procedure with only a few photons per energy bin in the spectra, although its exploitation in the frame of XSPEC is not straightforward. Since the background dominates at energy keV, we restricted the analysis in the energy range keV when considering pattern = 0, and keV in the case of pattern = . The previously discussed model was applied to the data, -i.e. a power law plus a blackbody component. Adopting the C-statistic and pattern selection , the Gaussian line centroid is found at keV, with line width keV and normalization photons cm-2 s-1 keV-1, in agreement with results obtained through the use of statistic. As for the case of the statistic, in order to quantify the improvement of the fit provided by the introduction of a Gaussian component, we compared the values of the C-statistic using continuum models in the restricted keV band, with or without the inclusion of the line. By applying only the continuum to the data, a C-statistic value of 195 for 182 dof indicates a bad fit. The addition of the Gaussian at 6.2 keV definitely improves the C-statistic providing 179.4 for 179 dof. Comparable results are obtained adopting the strictest criterion photon pattern=0. Since our procedure can be assimilated to an F-test which is not strictly adequate to assess the statistical significance of the line (Protassov et al., 2002), we also provided spectral simulations of fake data based on power law plus black-body models described above. These simulations show that (1) background counts dominate at keV, (2) continuum emission counts drops above 5 keV. Chance probability of a fluctuation of source continuum emission mimicing a line at keV appears negligible. Even after 400 trials, fake continuum data never required the inclusion of a line feature in the fit, confirming line detection above 3-sigma level.
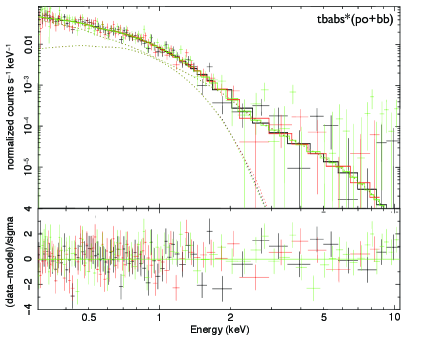
In the case of the second long observation performed in 2011, the high-energy component appears to be different from that detected in 2006, with weaker evidence of a high-energy spectral line (see Fig. 4). However, it is worth noting that the quality of the data is not as good as during the observation performed in 2006, with a stronger background emission partly due to the use of the EPIC “thin” filter. We simulated fake data including a continuum (power-law plus black-body) model and a line feature with the same parameters derived from 2006 data, assuming the background model obtained from 2011 data. An emission line with the same energy and flux as in the 2006 observation would appear at the limit of detectability in 2011 data.
Unfortunately, orbital phase-resolved analysis did not provide any significant constraints at E keV because of the low counts statistics, as well as pulsar phase-resolved analysis was not suitable in hard X-rays.
 |
 |
4 High-energy spatial analysis
In order to exclude that the reported hard X-ray features are associated with background emission, the standard spectral analysis was coupled to an independent source detection method based on likelihood spatial analysis. The most sensitive procedure to estimate the strength of sources in X-ray data in common with other photon-counting data entails constructing composite models of the spatial distribution of events combining source and background components (Pollock, 1987). The background near the Double Pulsar is made up of cosmic and instrumental contributions and is assumed to be flat.
A point spread function spatial model was applied to EPIC images between 4 and 8 keV, where the discrepancy between the low-energy spectral models and the hard X-ray component is the most relevant. The Table 4 reports the results separately and combined for each of the 5 long observations comprising the two Large Programs in 2006 and 2011. The exposure time reported, T(s), includes the dead-time correction of the Small Window mode. The likelihood detection statistic, lnL, shows that the Double Pulsar is a weak source at high energies that is difficult to detect in a whole spacecraft revolution of nearly two days, but which is consistent in strength with the count rate accumulated in half a million seconds of elapsed time.
The combined log-likelihood detection statistic of 15.1 is a secure detection that amounts to photons above 4 keV from the X-ray source. Unlike spectral analysis, unpredictable background contamination cannot significantly affect likelihood analysis results, since background counts are not distributed in the image accordingly to the source point spread function. Moreover, the spatial analysis testifies that there is no detection of source photons above 8 keV. Therefore our analysis proves that hard X-ray photons originate from the Double Pulsar in the keV energy range.
| Obs. ID | MJD start | MJD stop | T(s) | Count Rate (/s) | lnL |
|---|---|---|---|---|---|
| 0405100201 | 54034.037 | 54035.423 | 82710 | 3.0 | |
| 0405100101 | 54036.037 | 54037.362 | 79067 | 3.2 | |
| 0670810201 | 55856.863 | 55858.360 | 89353 | 3.1 | |
| 0670810301 | 55858.828 | 55860.056 | 73249 | 5.1 | |
| 0670810101 | 55860.854 | 55862.339 | 88675 | 3.8 | |
| Combined | 413055 | 0.000380.0002 | 15.1 |
Note. — XMM Epic-PN in the keV energy range. ”Combined” corresponds to the combination of the data.
5 Discussion
The X-ray emission from pulsars is typically attributed to a magnetospheric and/or a thermal origin. Because of the small separation between the two neutron stars, a strong interaction is expected between the wind of Pulsar A and the magnetosphere of Pulsar B, inducing possibly more complex mechanisms of the X-ray emission. In the following, we discuss the origin of the soft X-ray emission (up to 4 keV) and hard X-ray emission, including the detection of the spectral feature at keV.
5.1 Soft X-ray emission
The spectral analysis of the observations performed in 2011, as well as combining 2006+2011 data, provides results comparable with those related to 2006 data alone. Different two-component (black body plus power law or double black body) or three-component spectral models (double black-body plus power law) can fit the whole dataset. However, scenarios involving only thermal emission components are disfavoured, since the flux is most likely dominated by non-thermal Pulsar A’s magnetosphere emission. A double black-body model implies that the X-ray flux of Pulsar B would be about half of Pulsar A’s flux (looking at black-body normalizations) and this is inconsistent with X-ray fluxes derived from timing analysis by Iacolina et al. (2016) for which X-ray emission from Pulsar A is over three times higher with respect to Pulsar B. Furthermore, pulsar phase-resolved analysis demonstrated that a non-thermal component clearly correlate with Pulsar A’s light curve peaks (Pellizzoni et al., 2008).
No significant spectral variability in soft X-rays is evident over 5 years. In particular, despite a significant relativistic spin precession occurred in the considered time span (), no significant long-term variation of the soft Pulsar A’s spectral component is observed. This further supports the hypothesis of a small misalignment between the spin axis and the orbital momentum axis as suggested by timing analysis of the same data (Iacolina et al., 2016).
The non-thermal X-ray emission of PSR J0737-3039 is likely attributed to relativistic charged particles accelerated in the magnetosphere of Pulsar A, via synchrotron emission in the outer gap model (Cheng & Zhang, 1999) and/or via inverse Compton scattering of the thermal X-ray photons in the polar cap model (Zhang & Harding, 2000, and references therein).
No signature of a bow shock component (power law with as suggested by canonical shock models; see Sturner et al. 1997 and references therein) between the wind from Pulsar A and Pulsar B’s magnetosphere is present in our soft spectral data, nor evidence of spectral variability as a function of the orbital phase. A weak orbital flux variability (7%) was detected in the timing analysis (Iacolina et al., 2016) and it was possibly attributed to bow-shock emission. In the spectral analysis, the corresponding bow-shock flux could be concealed by the strong Pulsar A’s luminosity.
As for the thermal emission, it is expected to originate from hot spots around the magnetic poles (polar caps) of Pulsar A and/or Pulsar B, heated up to X-ray temperatures by relativistic particles streaming down onto the surface from the magnetosphere of the pulsar(s). Indeed, considering the characteristic ages of Pulsar A ( Myr) and Pulsar B ( Myr), and the cooling evolution of such objects (Tsuruta 1998), these pulsars are too old to have an intrinsic thermal radiation from their entire surface or from the atmosphere (Zavlin, 2009).
The radio pulsar models (Cheng & Ruderman, 1980; Arons et al., 1981; Beskin et al., 1993) predict polar cap radii s]-1/2 km for a neutron star of radius km. Hence, theoretically, the polar cap radii associated with Pulsar A and Pulsar B are km and m, respectively. These values are in agreement with black-body emission radii derived from our spectral results.
Either assuming the presence of one or two black-body components in our spectral scenario, the expected luminosity of each component is 1030 erg/s, a value higher than Pulsar B’s spin-down luminosity. This means that the black-body component luminosity would be . Thus, we can confirm that Pulsar B’s emission can only be powered by an external source (i.e. Pulsar A’s spin-down energy).
5.2 Hard X-ray emission
For any applicable spectral scenario in the keV range, the data above 4 keV are not correctly described by the two or three-component models (see Figure 2). The complementarity of the independent spatial and spectral approaches allows us to claim for the first time hard X-ray emission from the Double Pulsar.
This hard emission is well fitted by a Gaussian line at keV in the 2006 data. No other simple model, such as a power law or a black body, is able to fit the high-energy excess. Emission at these energies indicates the likely presence of iron line emission. The firm detection of hard X-ray emission in the keV range coupled with no source detection keV through spatial analysis, strengthen the reliability of our spectral feature detection. The presence of such a feature has major importance since it represents the first evidence of an X-ray spectral line around a supposedly “non-accreting system”.
As for the second long-observation performed in 2011, we cannot claim evidence of a high-energy spectral line, because of a poorer signal-to-noise ratio in hard X-rays mostly due to the use of the thin EPIC-pn filter. In any case, the detection of high-energy photons from the Double Pulsar is also confirmed in these data through spatial analysis, though spectral parameters cannot be precisely constrained in the 2011 data alone. As described in Section 3, line variability is compatible with our data, though not required.
Associated with emission at keV, the Fe K line is widely considered as a particular property of accretion-powered sources in which accreting matter forms a disk. It has been detected in the X-ray spectra of many supermassive black holes and stellar-mass-black-hole and neutron-star X-ray binaries (Cackett et al., 2010; Miller, 2007), and in magnetic cataclysmic variables (Ezuka & Ishida, 1999). The emission line is thought to originate in the innermost parts of the accretion disk, where strong relativistic effects broaden and distort its shape. The production of such a line is fairly simple requiring a source of thermal or non-thermal hard X-rays to illuminate the disk. In this context our detection of the Fe K line in the Double Pulsar may indicate that at least one of the system components is surrounded by a gaseous disk. However, what could be the origin of such a disk?
The Double Pulsar, as the other few confirmed double neutron star binaries, is the descendant of a high-mass binary system that has survived two supernova explosions (Stairs, 2004). The two stars under-filled their Roche lobes and lose matter at a relatively low rate through winds of relativistic particles. The conventional scenario of accretion disk formation based on intensive mass-exchange between the system components in this case is not applicable. However, a relic disk of matter captured from ejecta of the second supernova explosion could be present. The disk could be formed in two ways. The first is a so-called fall-back accretion scenario in which the inner parts of the ejecta return towards the newly-formed neutron star forming a disk around its magnetosphere (Colgate, 1971; Zeldovich et al., 1972; Michel, 1988; Chevalier, 1989). The mass of the remnant disk in this case is about M☉. The second scenario suggests the disk to form around the magnetosphere of the old neutron star born during the first supernova explosion as it moves through the supernova ejecta of its exploded companion. As recently pointed out (Bisnovatyi-Kogan & Ikhsanov, 2015), the mass of the remnant disk within this scenario can reach M☉. Thus, current views of the process of supernova explosions do not exclude that one or even both neutron stars could be surrounded by relic disks.
Observations give no direct evidence that the neutron stars in the Double Pulsar are accreting material from a disk (no radio pulsar timing noise reported by Kramer et al. 2006 and Kramer & Stairs 2008). It is plausible that the relic disk is currently in a dead state (Sunyaev & Shakura, 1977) in which mass-transfer towards the star is suppressed by the centrifugal barrier at the boundary of the stellar magnetosphere. The interaction between the disk and the magnetic field of the radio pulsar in this case results in generation of electrical currents, which connect the inner parts of the disk with polar cap regions at the surface of the neutron star (Michel & Dessler, 1981, 1983, 1985). As the currents dissipate in small areas of the polar caps the temperature increases dramatically, enhancing the hot spots visible in X-rays. In contrast, the temperature of the disk increases little since current dissipation occurs over a much larger area. The disk in this case could contribute to the pulsar emission at lower frequencies by a significant fraction of the pulsar spin-down power.
Our spectral analysis of the XMM-Newton data demonstrates that the thermal X-ray emission is indeed incompatible with a disk origin, since the disk radius would be too small (even assuming a disk black-body model diskbb). The surface area associated with the black bodies at 0.1 and 0.3 keV is of the order of 600 and 100 m2, respectively, indicating most likely thermal emission from the polar cap(s). The putative disk is most likely colder and thus invisible in X-rays. It manifests itself only through the iron line that requires external heating. This could be by illumination by a hard continuum X-rays from Pulsar A, although this might be too weak or anisotropic to be observed. Alternatively, unlike accretion-powered pulsars, the disk could be illuminated by high-energy particles from Pulsar A’s wind. In this case, about of spin-down energy of Pulsar A could power the K line. Interestingly enough, this is the same amount of energy powering Pulsar B’s X-ray emission.
Iron line emission could also be in principle associated with an accumulation of matter trapped in the shock layer foreseen between Pulsar A’s wind and the magnetosphere of Pulsar B. A hypothetical spectral line from the surface or atmosphere of the neutron star is not favored, since the gravitational redshift would induce a line at keV accordingly to the lower limit on the neutron stars mass-radius ratio (Zhao & Song, 2012).
An idea about a relic disk to surrounding a radio pulsar has been invoked by a discovery of two planet-mass companions around the millisecond pulsar PSR 1257+12 (Wolszczan & Frail, 1992). Further studies eventually confirmed that the components are likely to originate from a durable remnant disk, which in a previous epoch could be in an accretion or dead state. The presence of remnant disks around isolated neutron stars has later been suspected in studies of Anomalous X-ray Pulsars (AXPs) and Soft Gamma-ray Repeaters (SGRs) (Michel, 1985; Chatterjee et al., 2000). Iron line emission at 6.4 keV was detected during a gamma-ray burst in SGR 1900+14 (Strohmayer & Ibrahim, 2000). The presence of a relic disk was also been invoked to explain the IR/optical radiation discovered from two AXPs (Kaplan et al., 2009; Wang et al., 2006). Only upper limits to the optical flux were derived for the Double Pulsar (Ferraro et al., 2012), which was instead detected in the FUV (Durant et al., 2014). Although the thermal or non-thermal nature of this emission is still unclear, it is not related to magnetospheric or surface X-ray pulsar emission since it does not match with extrapolated X-ray spectra. It is in principle compatible with a relic disk of luminosity L erg/s.
The possible weakening or even disappearance of the spectral feature at keV in the data obtained in 2011 could be related to actual variability of the Fe line because of changes in the geometry or precession of the disk, which is not illuminated in the same way over time. The parameters of interaction between the wind of Pulsar A and the magnetosphere of Pulsar B are expected to be different between 2006 and 2011, as manifested by radio disappearance of Pulsar B in 2008. As the orbit is seen edge-on, changes on the disk could in principle also affect radio pulsar timing (e.g. observed dispersion measure, pulse shapes and eclipses) when it crosses the line-of-sight to the pulsars. A multi-messenger approach is then required to probe the putative relic disk and its time-dependent geometry.
6 Conclusions
Two Large Programs of observations of the relativistic Double Pulsar were performed by XMM-Newton in 2006 and 2011. The total observing time of about 600 ks offers the opportunity to investigate the low luminosity source with a high number of source photon events.
No significant spectral variations in soft X-rays can be claimed in the 5 years between 2006 and 2011, substantially confirming the previously reported results based on the analysis of the 2006 data alone. Two-component (black body plus power law) or three-component spectral models (double black-body plus power law) can in principle fit the whole dataset, although the latter models seem better suited according to phase-resolved spectral analysis (Pellizzoni et al., 2008). However, for any applicable spectral scenario in the keV range, the data above 4 keV are not correctly described by the models.
We investigated for the first time the high-energy part of the spectrum of the Double Pulsar. An intriguing emission feature, possibly variable, is detected at about keV. Spatial analysis confirms the emission of hard energy photons between 4 and 8 keV ascribed to the source. This feature is most likely attributed to iron line emission, testifying the presence of a relic disk that survived the supernova explosions that terminated the lives of the Double Pulsar’s stellar progenitors.
References
- Arnaud (1996) Arnaud, K. A. 1996, in ASP Conf. Ser., Astronomical Data Analysis Software and Systems V, ed. G. H. Jacoby & J. Barnes, 101, 17
- Arons et al. (1981) Arons, J. 1981, ApJ, 248, 1099
- Beskin et al. (1993) Beskin, V. S., Gurevich, A. V., & Istomin, Y. N. 1993, Physics of Pulsar Magnetosphere (Cambridge: Cambridge Univ. Press)
- Bisnovatyi-Kogan & Ikhsanov (2015) Bisnovatyi-Kogan, G. S. & Ikhsanov, N. R. 2015, Astronomy Reports, 59, 503
- Breton et al. (2008) Breton, R. P., Kaspi, V. M., Kramer, M. et al. 2008, Science, 321, 5885, 104
- Burgay et al. (2003) Burgay, M., D’Amico, N., Possenti, A., et al. 2003, Nature, 426, 531
- Cackett et al. (2010) Cackett, E. M., Miller, J. M., Ballantyne, D. R. 2010, ApJ, 720, 205
- Campana et al. (2004) Campana, S., Possenti, A., & Burgay, M. 2004, ApJ, 613, L53
- Cash (1979) Cash, W. 1979, ApJ, 228, 939
- Chatterjee et al. (2007) Chatterjee, S., Gaensler, B. M., Melatos, A., et al. 2007, ApJ, 670, 1301
- Chatterjee et al. (2000) Chatterjee, P., Hernquist, L., Narayan, R. 2000, ApJ, 534, 373
- Cheng & Ruderman (1980) Cheng, A. F. & Ruderman, M. A. 1980, ApJ, 235, 576
- Cheng & Zhang (1999) Cheng, K. S. & Zhang, L. 1999, ApJ, 515, 337
- Chevalier (1989) Chevalier, R. A. 1989, ApJ, 346, 847
- Colgate (1971) Colgate, S. A. 1971, ApJ, 163, 221
- De Luca & Molendi (2004) De Luca, A. & Molendi, S. 2004, A&A, 419, 837
- Durant et al. (2014) Durant, M., Kargaltsev, O. & Pavlov, G. G., 2014, ApJ, 783, 22
- Ezuka & Ishida (1999) Ezuka, M. 1999, ApJS, 120, 277
- Ferraro et al. (2012) Ferraro, F. R., Mignani, R. P., Pallanca, C. et al. 2012, ApJ, 749, 84
- Granot & Mészáros (2004) Granot, J. & Mészáros, P. 2004, ApJ, 609, L17
- Iacolina et al. (2016) Iacolina M. N., Pellizzoni, A., Egron, E. et al. 2016, ApJ, 824, 87
- Kaplan et al. (2009) Kaplan, D. L., Chakrabarty, D., Wang, Z. & Wachter, S. 2009, ApJ, 700, 149
- Kaspi et al. (2004) Kaspi, V. M., Ransom, S. M., Backer, D. C., et al. 2004, ApJ, 613, L137
- Kramer et al. (2006) Kramer, M., Stairs, I. H., Manchester, R. N., et al. 2006, Science, 314, 97
- Kramer & Stairs (2008) Kramer, M. & Stairs, I. H. 2008, ARA&A, 46, 541
- Kramer & Wex (2009) Kramer, M. & Wex, N. 2009, Classical and Quantum Gravity, 26, 7
- Lyne et al. (2004) Lyne, A. G., Burgay, M., Kramer, et al. 2004, Science, 303, 1153
- Lyutikov (2004) Lyutikov, M. 2004, MNRAS, 353, 1095
- McLaughlin et al. (2004) McLaughlin, M. A., Lyne, A. G., Lorimer, D. R., et al. 2004, ApJ, 616, L131
- Michel & Dessler (1981) Michel F. C., & Dessler, A. J. 1981, ApJ, 251, 654
- Michel & Dessler (1983) Michel F. C., & Dessler, A. J.1983, Nature, 303, 48
- Michel & Dessler (1985) Michel F. C., & Dessler, A. J. 1985, Sience, 228, 1015
- Michel (1985) Michel F. C. 1985, ApJ, 290, 721
- Michel (1988) Michel F. C. 1988, Nature, 333, 644
- Miller (2007) Miller, J. M. 2007, ARA&A, 45, 441
- Pellizzoni et al. (2004) Pellizzoni, A., De Luca, A., Mereghetti, S., et al. 2004, ApJ, 612, L49
- Pellizzoni et al. (2008) Pellizzoni, A., Tiengo, A., De Luca, A., et al. 2008, ApJ, 679, 664
- Perera et al. (2010) Perera, B. B. P., McLaughlin, M. A., Kramer, et al. 2010, ApJ, 721, 1193
- Pollock (1987) Pollock, A. M. T. 1987, ApJ, 320, 283
- Possenti et al. (2008) Possenti, A., Rea, N., McLaughlin, M. A., et al. 2008, ApJ, 680, 654
- Protassov et al. (2002) Protassov, R., van Dyk, D. A., Connors, A. et al. 2002, ApJ, 571, 545
- Stairs (2004) Stairs, I. H. 2004, Science, 304, 547
- Strohmayer & Ibrahim (2000) Strohmayer, T. E. & Ibrahim A. I. 2000, ApJ, 537,111
- Strüder et al. (2001) Strüder, L., Briel, U., Dennerl, K., et al. 2001, A&A, 365, L18
- Sturner et al. (1997) Sturner, S. J., Skibo, J. G., Dermer, C. D., Mattox, J. R. 1997, ApJ, 490, 619
- Sunyaev & Shakura (1977) Sunyaev, R. A. & Shakura, N. I. 1977, Soviet Astronomy Letters 3, 138
- Verbiest et al. (2012) Verbiest, J. P. W., Weisberg, J. M., Chael, A. A., et al. 2012, ApJ, 755, 39
- Tsuruta (1998) Tsuruta, S. 1998, Phys. Rep., 292, 1
- Turner et al. (2001) Turner, M. J. L., Abbey, A., Arnaud, M., et al. 2001, A&A, 365, L27
- Wang et al. (2006) Wang, Z., Chakrabarty, D. & Kaplan, D. L., 2006, Nature, 440, 772
- Wilms et al. (2000) Wilms, J., Allen, A., & McCray, R. 2000, ApJ, 542, 914
- Wolszczan & Frail (1992) Wolszczan, A. & Frail, D. A. 1992, Nature, 355, 145
- Zavlin (2009) Zavlin, V. E. 2009, Theory of Radiative Transfer in Neutron Star Atmospheres and Its Applications, Astrophysics and Space Science Library, ed. Becker W., 357, 181
- Zeldovich et al. (1972) Zeldovich, Y. B., Ivanova, L. N. & Nadezhin, D. K. 1972, Soviet Astronomy 16, 209
- Zhang & Harding (2000) Zhang, B. & Harding, A. K. 2000, ApJ, 532, 1150
- Zhao & Song (2012) Zhao, H. H. & Song, L. M. 2012, Proceedings IAU Symposium n.290, 8, pp 369-37