Searching for the expelled hydrogen envelope in Type I supernovae
via late-time H emission
Abstract
We report the first results from our long-term observational survey aimed at discovering late-time interaction between the ejecta of hydrogen-poor Type I supernovae and the hydrogen-rich envelope expelled from the progenitor star several decades/centuries before explosion. The expelled envelope, moving with a velocity of – km s-1, is expected to be caught up by the fast-moving SN ejecta several years/decades after explosion depending on the history of the mass-loss process acting in the progenitor star prior to explosion. The collision between the SN ejecta and the circumstellar envelope results in net emission in the Balmer-lines, especially in H. We look for signs of late-time H emission in older Type Ia/Ibc/IIb SNe having hydrogen-poor ejecta, via narrow-band imaging. Continuum-subtracted H emission has been detected for 13 point sources: 9 SN Ibc, 1 SN IIb and 3 SN Ia events. Thirty-eight SN sites were observed on at least two epochs, from which three objects (SN 1985F, SN 2005kl, SN 2012fh) showed significant temporal variation in the strength of their H emission in our DIAFI data. This suggests that the variable emission is probably not due to nearby H II regions unassociated with the SN, and hence is an important additional hint that ejecta-CSM interaction may take place in these systems. Moreover, we successfully detected the late-time H emission from the Type Ib SN 2014C, which was recently discovered as a strongly interacting SN in various (radio, infrared, optical and X-ray) bands.
Subject headings:
(stars:) supernovae: general; stars: winds, outflows; (ISM:) H II regionsI. Introduction
All stars are thought to lose mass during their main-sequence and subsequent evolution. This can range from a paltry stellar wind like that from the Sun ( with speeds of hundreds of ) to the slow, dense winds of red giants (– with speeds of tens of ) to brief, violent, Carinae-like expulsions of tens of solar masses from very massive stars. At different stages of evolution, a star will undoubtedly have different modes of mass loss. Binary evolution will play a role in many cases.
While it is impossible to study in real time these different modes of mass loss in an individual star, we can do so by studying individual supernovae (SNe) for years and even decades after the explosion. The fast-moving SN shock is effectively a time machine, encountering material shed earlier in the life of the pre-supernova star.
Recent years have seen a new focus on the circumstellar media (CSM) surrounding SN sites and the interaction of supernova ejecta and shocks with CSM. Well-known CSM-interacting SN types are the Type IIP (Chugai et al., 2007), which arise in red supergiant progenitors that blow nearly steady-state winds into which the star explodes and the Type IIn (SN IIn) events, which have long been recognized to show narrow emission lines that reveal dense CSM (e.g. Filippenko, 1997). In addition, the great luminosities of superluminous supernovae (SLSNe) are also thought to be powered, in some cases, by ejecta-CSM interaction (Chatzopoulos et al., 2013).
The various types of stripped-envelope SNe are also of great interest in this respect, because these events have little or no hydrogen on the progenitor at the time of explosion, but the progenitors must have once been normal hydrogen-rich stars. Such events include the Type IIb SNe, in which the hydrogen envelope has been partly expelled prior to explosion, as well as the Type Ibc, which essentially lost their H-rich envelope. The mechanism of these processes is ill-understood: it could be due to winds (Heger et al., 1997; Puls et al., 2008), episodic ejection (Smith & Owocki, 2006; Pastorello et al., 2007; Shiode & Quataert, 2014) or binary interactions, including common-envelope formation and ejection (see the reviews by Taam & Sandquist, 2000; Smith, 2014). Even some Type Ia SNe, referred to as SNe Ia-CSM, show strong H emission, a clear sign of CSM-interaction, in their late-phase optical spectra (Silverman et al., 2013a; Inserra et al., 2016).
The collision between the fast-moving SN ejecta and the slow-moving CSM creates the well-known double-shock pattern having the forward shock (FS) propagating into the CSM and the reverse shock (RS) propagating back into the ejecta (e.g. Chevalier & Fransson, 2003, and references therein). The acceleration of free electrons results in strong non-thermal emission, from X-rays to radio, coming from the interaction site. Massive SN progenitors ( M⊙) can produce strong, fast-moving winds prior to explosion, which can create a low-density cavity around the explosion site, surrounded by a relatively dense CSM shell consisting of previously expelled (H-rich) material (e.g. Chevalier & Liang, 1989). When the SN ejecta hits this dense shell, it drives a strong RS into the ejecta, which leads to strong X-ray radiation from the region between the RS and the ejecta-CSM interface (Nymark et al., 2006). The hard X-rays produced by the RS are mostly absorbed by the cool, dense CSM shell causing strong ionization in this medium. Subsequent recombination in this H-rich CSM shell results in emergent emission in the hydrogen Balmer-lines, mostly H (Chugai & Chevalier, 2006). This mechanism is thought to produce intermediate-width ( - km s-1) emission lines, mostly due to multiple scattering on free electrons within the shell and, to a lesser extent, bulk motion caused by the acceleration of the shell by the expanding SN ejecta at the beginning of the interaction phase. The FS propagating into the CSM can also ionize the surrounding material, which may produce additional, narrow ( km s-1) H emission coming from the pre-shock CSM in front of the FS. The appearance of the Balmer-emission can be especially interesting in the case of stripped-envelope SNe, since in such cases the ejecta contain only very low or negligible amount of H. Thus, the emerging Balmer-emission is a very strong indication that the ejecta have overrun the cavity and plunged into the H-rich CSM shell.
The natural expectation that the fast-moving SN ejecta must overtake the previously expelled H-rich envelope has been beautifully demonstrated in the case of the Type Ibc SN 2001em, where strong radio (Stockdale et al., 2004) and X-ray emission (Pooley & Lewin, 2004) was discovered years after explosion. These discoveries generated further interest in SN 2001em, because the radio luminosity ( erg s-1 Hz-1 at 6 cm) as well as the X-ray luminosity ( erg s-1) were far above anything seen from other SNe Ibc at an age of several years. Since some fraction of SN Ibc give rise to gamma-ray bursts (GRB) where the jet is aimed in our direction, it was hypothesized by Granot & Ramirez-Ruiz (2004) that SN 2001em may have been an off-axis GRB. Pooley & Lewin (2004), however, suggested the strong interaction between the SN ejecta and a dense CSM as an alternative mechanism which also can produce the exceptionally strong X-ray luminosity as observed by Chandra. Indeed, the late-time optical spectrum of SN 2001em, which revealed strong H emission (Soderberg et al., 2004), added strong support to the ejecta-CSM interaction scenario. Chugai & Chevalier (2006) explained all the unusual late-time X-ray, radio, and optical properties, as well as the failure to resolve a possible jet via VLBI observations (Bietenholz & Bartel, 2005; Schinzel et al., 2009), by suggesting that the SN ejecta had finally caught up with the cast-off hydrogen envelope of the progenitor star and that strong interaction was taking place.
A similar phenomenon is invoked in the case of PTF 11kx (Dilday et al., 2012; Silverman et al., 2013b), a Type Ia-CSM, where strong H emission developed d after maximum in an otherwise normal-looking Type Ia SN.
Motivated by the examples above, we started an observational survey to monitor several years-to-decades-old H-deficient SNe in order to catch signs of the starting (or ongoing) ejecta-CSM interaction. Our concept is that numerous SN Ia and/or Ibc may show detectable CSM interaction at such late phases, because their CSM shells may have reached greater distances from the explosion site than in those well-known cases when the interaction started within a few hundred days after explosion. Assuming that the H-rich envelope travels with a speed between 10 and 100 km s-1 (Chugai & Chevalier, 2006), the interaction with the fast-moving ejecta ( km s-1) is expected to start roughly a decade after SN explosion if the expulsion of the envelope ended – years before core collapse, depending on wind speed.
The aim of our observations is the direct detection of the H emission due to the collision between the H-poor SN ejecta and the surrounding H-rich CSM via imaging the SN sites through narrow-band filters centered on the (redshifted) wavelength of H. In Sections II and III we give details of the observations and our methodology of detecting H emissions. Section IV shows our early results, which are further discussed in Section V. Section VI summarizes our conclusions.
II. Observations
We utilized the 2.7m (107”) Harlan J. Smith Telescope equipped with the Direct Imaging Auxiliary Functions Instrument (DIAFI) at McDonald Observatory for conducting the imaging survey. We applied a narrow-band ( nm) H filter centered on the redshift of the Virgo-cluster (, Å) and another similar filter at an off-line position ( Å) as a guard-band filter to measure the continuum flux near the H line. In the following we refer to these filters as H-on and H-off, respectively.
We have selected a subsample of the full list of 3662 known SN I (SN Ia, SN Ibc) and SN IIb discovered before 2014, based on the following selection criteria:
-
•
declination higher than ;
-
•
distance less than Mpc.
This resulted in 747 potential candidates. These are sampled further, concentrating on the closest ( Mpc) events. The number of SNe in the restricted sample is 178.
Beside observability from the northern hemisphere, the reason for these selection criteria were twofold: to have the H line redshifted into the transmission band of the H-on filter, and to be able to reach a signal-to-noise ratio of for erg s-1 (i.e. a signal similar to SN 2001em) within hour exposure time with DIAFI.
We started our multi-season observing campaign in 2014, using both the H-on and -off filters on the SNe with Mpc. Since then we have imaged 76 galaxies hosting 99 SNe, i.e. percent of the total sample. The journal of the observations can be found in Table 1.
| Start date | End date | No. of observed SN hosts |
|---|---|---|
| 2014 Feb 27 | 2014 Feb 28 | 22 |
| 2014 May 03 | 2014 May 04 | 17 |
| 2014 Sep 30 | 2014 Oct 02 | 23 |
| 2015 Mar 14 | 2015 Mar 16 | 27 |
| 2015 May 20 | 2015 May 20 | 7 |
| 2015 Aug 23 | 2015 Aug 23 | 4 |
| 2016 Jun 07 | 2016 Jun 10 | 17 |
The H emission produced by SN-CSM interaction is likely to be variable in time. This offers an opportunity to distinguish between the ”real” interaction-produced emission and the flux coming from the immediate vicinity of the SN site but not related to the SN blast wave (e.g. from a nearby H II cloud), because the latter sources are expected to remain roughly constant in time. Thus, instead of maximizing the number of observed SNe, we aimed at taking multiple images of those SNe that were detected as H emitters at significantly different epochs. This effort resulted in 38 SNe (in 32 different host galaxies) imaged at least twice, separated by a 3-month-long or longer temporal baseline.
III. Method
The frames taken with DIAFI were reduced and calibrated in the following way. Three frames per filter were collected for each SNe. Following standard bias-subtraction and flatfield-division, the frames obtained through the same filter were geometrically registered by applying the IRAF111Image Reduction and Analysis Facility (IRAF) is distributed by the National Optical Astronomy Observatories, which are operated by the Association of Universities for Research in Astronomy, Inc., under cooperative agreement with the National Science Foundation. task xregister, then they were median-combined to filter out the numerous cosmic-ray hits. The median-combined frames were then transformed to the World Coordinate System (WCS) by using the SEXtractor222http://www.astromatic.net/software/sextractor and WCSTools333http://http://tdc-www.harvard.edu/wcstools/ codes. Having the combined images properly registered in both filters, the HOTPANTS444http://www.astro.washington.edu/users/becker/v2.0/hotpants.html code was applied to subtract the H-off frames from the H-on frames to produce the continuum-subtracted difference images. These images were used to look for any H-emitting source in the immediate vicinity of the SN as described below.
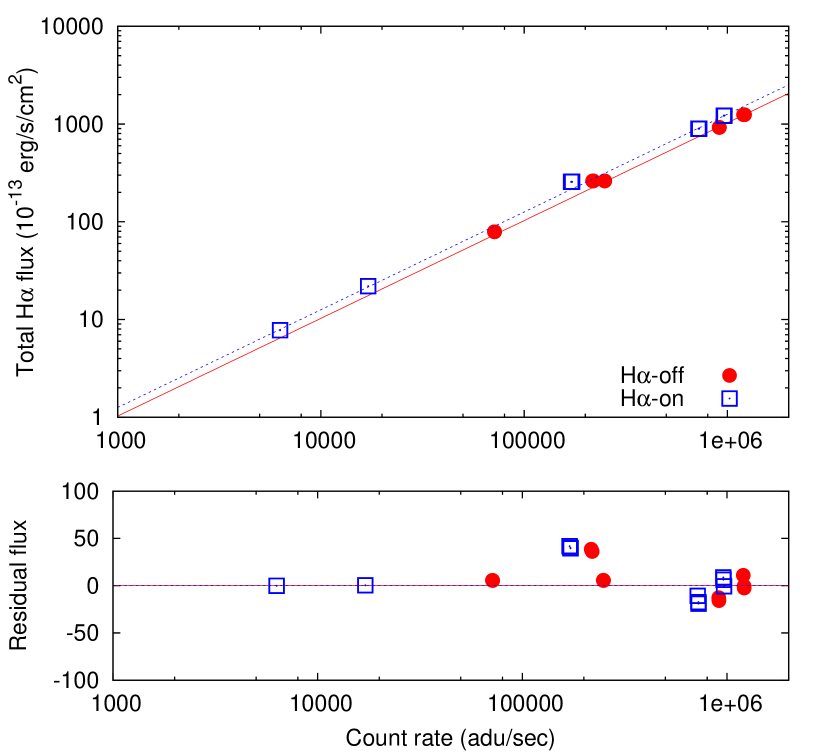
Flux calibration was performed via observing spectroscopic flux standard stars. We measured the observed count rates on the median-combined H-on and -off frames via aperture photometry using the YODA555http://www.as.utexas.edu/drory/yoda/index.html (”Yet anOther object Detection Application”) code (Drory, 2003). The diameter of the circular aperture was chosen as pixels ( arcsec), and the fluxes within this aperture were integrated. The subtracted background flux was estimated within an annulus having inner diameter and width of and pixels, respectively, around each object. The correction for the atmospheric extinction was computed using the wavelength-dependent KPNO extincion function as tabulated in IRAF, although this was found negligible compared to other uncertainties. For the observed spectroscopic standard stars, the true H fluxes were calculated as the integral of their known spectral flux densities within the spectral bandpasses of the applied filters. Finally, the conversion between the observed count rates (, in ADU/s) and the true H fluxes for both filters have been determined by fitting the following simple relation to the data:
| (1) |
Figure 1 illustrates the quality of the fit. The scaling factors obtained this way turned out to be and for the H-off and -on filters, respectively. The uncertainties of the flux calibration, estimated from the scatter of the residual plots in the bottom panel of Figure 1, are and erg s-1 cm-2, respectively.
The continuum-subtracted H flux at the position of every target SNe was estimated by the combination of two approaches. First, aperture photometry (using the same parameters as above) was computed with YODA at the SN position on the continuum-subtracted difference frames produced by HOTPANTS. If the total flux in the aperture exceeded the local sky level, the signal-to-noise ratio (S/N) was estimated by dividing the total flux by its uncertainty reported by YODA. Objects having S/N 4 were selected as detection candidates. Second, the detection candidates were examined by computing the same aperture photometry as before, but on the final, median-combined H-on and H-off frames. After transforming the measured count rates to physical fluxes (applying Equation 1), the net H flux was computed by subtracting the calibrated fluxes from the H-off frames from the fluxes measured on the H-on images. Again, uncertainties are estimated by adopting the values as reported by YODA. Only those candidates that showed S/N 4 after this step were retained as detections. This way it was possible to filter out some bogus detections, which were due to numerical artifacts on the difference images given by HOTPANTS.
For those objects that were observed on more than one epoch, the effect of different atmospheric transparency was corrected for in the following way: photometry of bright, unsaturated stellar sources on the H-off (continuum) frames were computed, and their instrumental magnitudes obtained on the 2nd night were scaled to those taken on the 1st night. Similar transformation was then computed for the H-on frames as well. This resulted in consistent relative photometry on the two datasets within an error of a few percent. These data were used to construct the H ”light curves” to look for temporal variability among the detected sources (see Section IV).
IV. Results
| SN | Type | D | unc. | Remark | |
|---|---|---|---|---|---|
| (Mpc) | (cgs) | (dex) | |||
| 1937D | Ia | 11.0 | 37.8135 | 0.0277 | point source |
| 1979B | Ia | 17.0 | 37.9868 | 0.0070 | diffuse |
| 1981B | Ia | 17.7 | 37.7577 | 0.0868 | diffuse |
| 1983I | Ic | 14.0 | 38.6929 | 0.0048 | diffuse |
| 1984L | Ib | 18.8 | 38.5064 | 0.0341 | diffuse |
| 1985F | Ib | 7.6 | 38.6909 | 0.0121 | point source |
| 1997br | Ia | 27.5 | 38.3376 | 0.0374 | diffuse |
| 2000E | Ia | 23.9 | 38.8246 | 0.0231 | point source |
| 2000cr | Ib | 57.6 | 39.5134 | 0.0272 | point source |
| 2000ew | Ic | 17.6 | 39.6804 | 0.0647 | point source |
| 2004ao | Ib | 26.9 | 38.0196 | 0.0664 | diffuse |
| 2004dk | Ib | 22.8 | 39.1888 | 0.0079 | point source |
| 2004gn | Ic | 14.4 | 38.2218 | 0.1629 | diffuse |
| 2004gt | Ic | 21.4 | 40.0318 | 0.0109 | point source |
| 2005V | Ib | 22.4 | 40.3510 | 0.0095 | diffuse |
| 2005kl | Ic | 21.6 | 41.8452 | 0.0020 | point source |
| 2007Y | Ib | 19.1 | 37.8156 | 0.0272 | diffuse |
| 2007af | Ia | 24.3 | 37.8710 | 0.0676 | diffuse |
| 2007gr | Ic | 8.2 | 38.4519 | 0.0120 | diffuse |
| 2007uy | Ib | 30.0 | 39.2632 | 0.0115 | diffuse |
| 2008ha | Ia | 20.0 | 38.2445 | 0.0684 | point source |
| 2010gi | IIb | 10.2 | 38.4090 | 0.0635 | diffuse |
| 2011jm | Ic | 22.2 | 39.5923 | 0.0030 | diffuse |
| 2012fh | Ic | 16.4 | 38.8490 | 0.0008 | point source |
| 2012P | IIb | 25.7 | 39.4327 | 0.0070 | point source |
| 2013dk | Ic | 21.4 | 38.8910 | 0.0799 | point source |
| 2014C | Ib | 14.3 | 38.8262 | 0.0527 | point source |
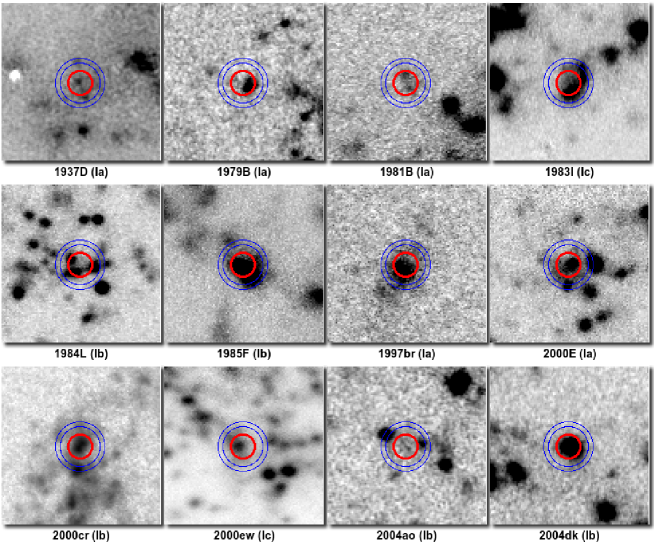
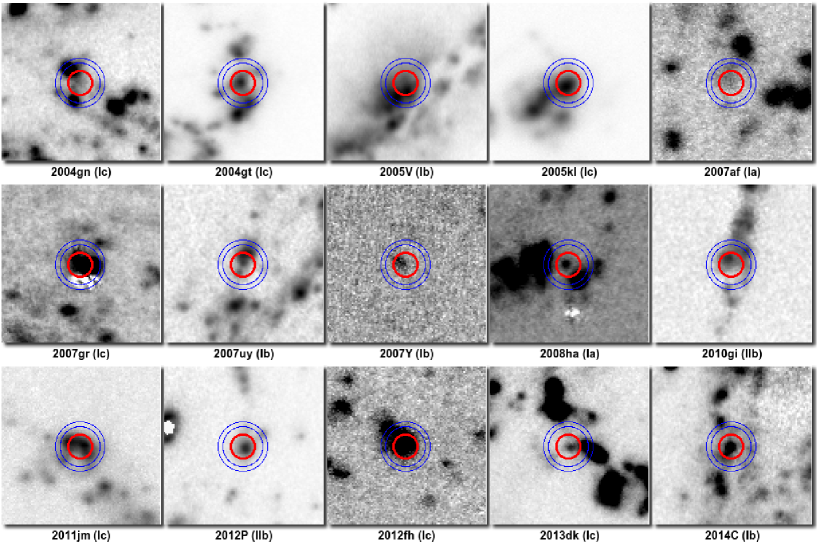
We have detected (using the criterion of S/N ) continuum-subtracted H emission from 27 SN sites (see Table 2). At least 14 of these detections ( percent) are clearly from diffuse H emitting sources, probably nearby H II areas. The others look like point sources in our DIAFI frames, but some of them appear slightly off-center with respect to the expected SN position, and thus could just be nearby compact H II clouds. Figure 2 and 3 show the collection of the positive detections.
The 3rd column of Table 2 contains the average of the redshift-independent distances taken from the NASA Extragalactic Database666http://ned.ipac.caltech.edu (NED). Based on these distances and the Milky Way extinction coefficient in the -band from Schlafly & Finkbeiner (2011), the logarithm of the calculated H luminosities and their uncertainties (expressed in erg s-1) are shown in the 4th and 5th columns of Table 2. The (likely underestimated) uncertainties are pure photometric errors described above and do not contain any other effects, e.g. the uncertainty of the distances or any in-host extinction.
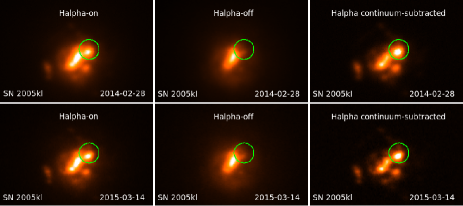
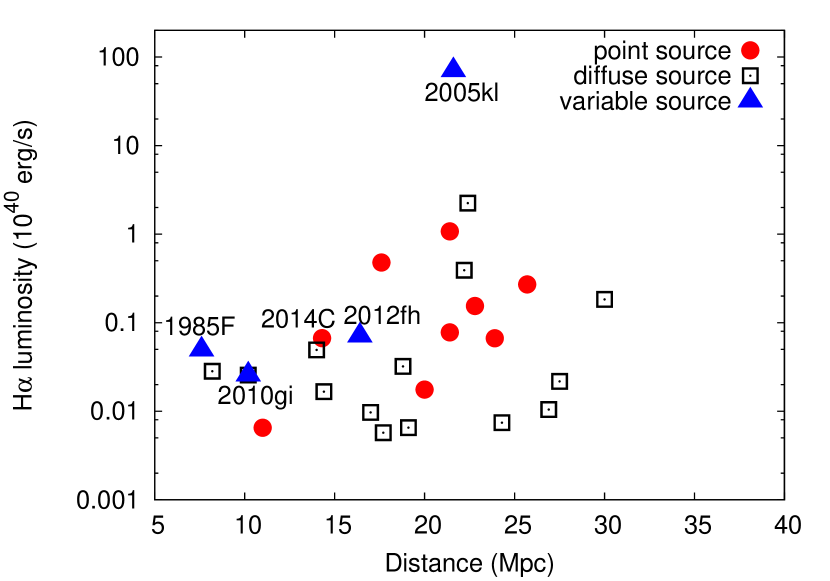
In Figure 4 we give an example of a strong (S/N ) detection on the continuum-subtracted image. SN 2005kl is the strongest H-emitting object in our sample. Its H luminosity, erg s-1 (Table 2 and Figure 5), is about an order of magnitude greater than that of the largest H II clouds (Kennicutt, 1984), which strongly suggests that the detected H emission is (at least partly) due to SN-CSM interaction.
Figure 5 shows the plot of the derived H luminosities as a function of distance. It is seen that, on average, point sources tend to be brighter than diffuse sources (the median luminosities for the two groups are erg s-1 and erg s-1, respectively), but both types of sources can be found at all luminosity levels, except for the exceptionally bright point source SN 2005kl.
Further hints of the possible presence of ejecta-CSM interaction may be gained from the temporal variability of the detected H sources. SN-CSM interaction usually produces variable H emission on the timescale of days (Mauerhan & Smith, 2012; Fransson et al., 2014), although there are known cases, e.g. SN 1988Z, a strongly interacting Type IIn (Aretxaga et al., 1999)) showing nearly constant H luminosity over days. Nevertheless, we imaged 38 SNe on at least two epochs separated by at least 90 days to detect any variability in the net H emission from the SN site.
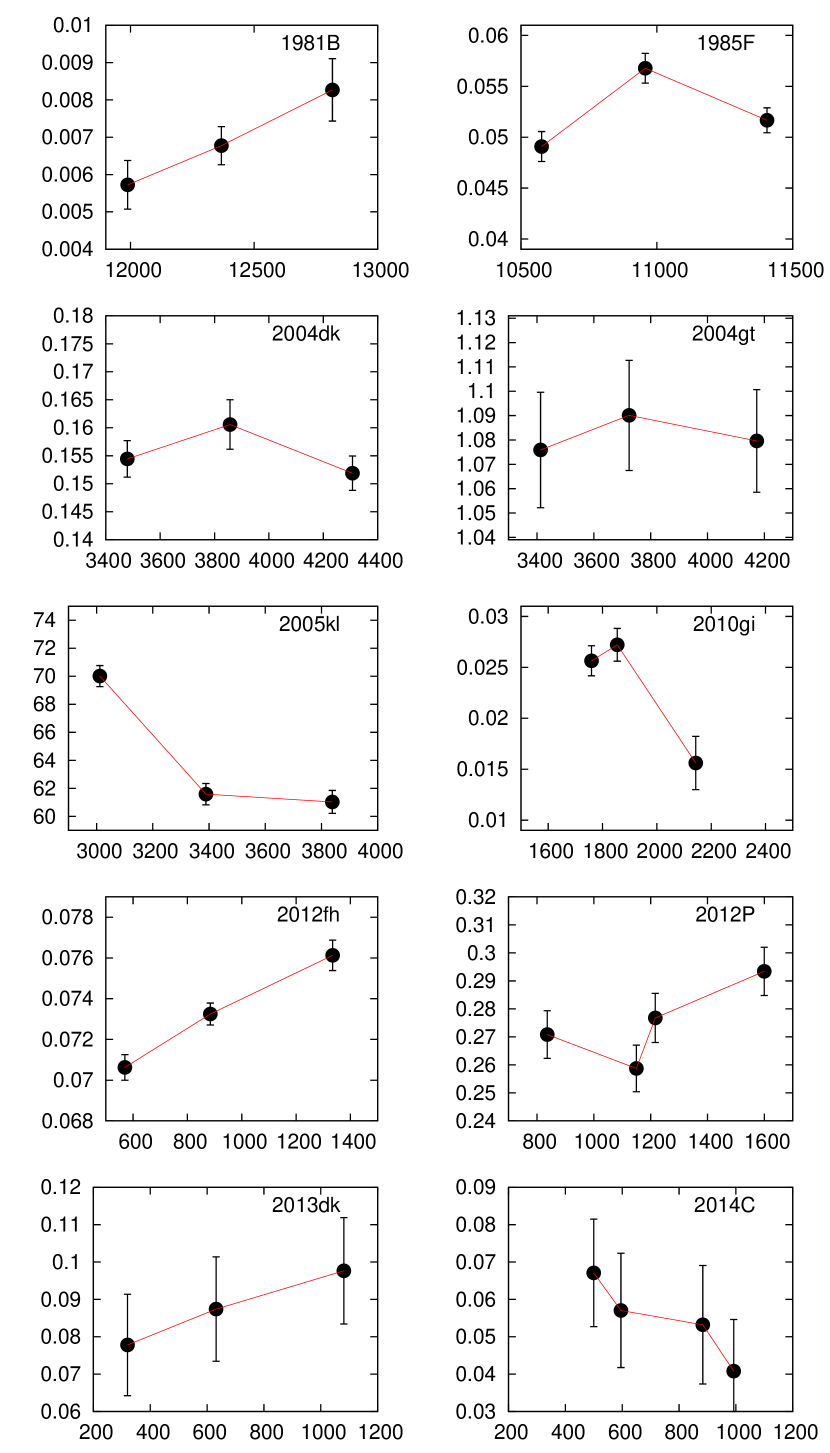
In Figure 6 we plot the light curves of 10 detected H emitters that were observed at least three times. It is seen that 6 of them do not show any change that exceeds the uncertainties, although SN 1981B, 2013dk and 2014C exhibited continuous variation (either increase or decrease) during our observations. Flux changes exceeding the photometric errors significantly (i.e. larger than ) were found in the case of SN 1985F (Ib, ), 2005kl (Ic, ), 2010gi (IIb, ) and 2012fh (Ic, ). SN 2010gi, a Type IIb SN, is a diffuse source (Figure 3) that is more affected by the changing atmospheric conditions, because the applied flux-scaling method that corrects for changing atmospheric transparency (see above) works reliably only for point sources. Thus, we do not believe that the variability detected at the position of SN 2010gi is real, and, instead, we attribute this to an instrumental effect. The other three objects are SNe-Ibc, and they are all point sources, thus, their variability is more convincing. Again, variability of the H line flux alone cannot be considered as proof of the ejecta-CSM interaction, but it might give additional support for this hypothesis, for example in the case of the extremely strong H emitter SN 2005kl, which is also a strongly variable source.
V. Discussion
Even though it is difficult to prove the existence of ejecta-CSM interaction from only narrow-band imaging, without spectroscopic and/or multi-wavelength (X-ray and/or radio) observations, our data at hand strongly suggest that CSM interaction is the likely explanation for the H emission in at least a few of the SNe in our sample. The collision between the SN blast wave and the expelled, slowly moving H-envelope can certainly produce H emission in the same order of magnitude as observed, as already demonstrated by SN 2001em (Section 1).
SN 2004dk (Type Ib) is another example, where SN-CSM interaction was detected in X-rays by XMM-Newton shortly after explosion (Pooley, 2007), and by radio observations at late phases (Stockdale et al., 2009; Wellons et al., 2012). Although Wellons et al. (2012) concluded that ”it is unlikely that the shockwave is interacting with a H-rich common envelope” based on a single nebular spectum of SN 2004dk that showed only a weak, narrow, unresolved H emission feature attributed to ISM (Maeda et al., 2008), our solid (S/N ) detection of a strong point source at the SN position may suggest that the blast wave has finally reached the expelled H-rich envelope. The lack of variability (Fig.6), however, does not strengthen this interpretation, thus, follow-up observations will provide important constraints for this case.
A more recent example occurred during the progress of our project. After emerging from solar conjunction, the Type Ib SN 2014C started to show strong H emission days after explosion, even though H was absent from its spectrum during the photospheric phase (Milisavljevic et al., 2015). Accompanied by contemporaneous strong X-ray and radio emission, this remarkable metamorphosis was explained by ejecta-CSM interaction (Margutti et al., 2016), the same mechanism for which we search.
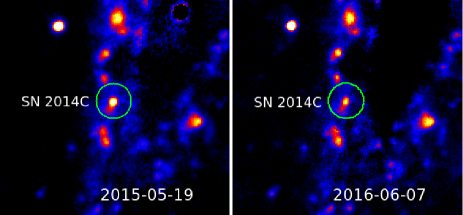
We detected the appearance of the H emission from SN 2014C on our DIAFI frames taken between 2015 May and 2016 June ( and days after explosion, respectively). Figure 7 shows the continuum-subtracted DIAFI frames obtained on 2015-05-19 and 2016-06-07 (left and right panels, respectively), with the object encircled. Its H luminosity (Table 2) is in agreement with the independent spectroscopic measurements given by Milisavljevic et al. (2015). This source seems to show continuously decreasing net (i.e. continuum-subtracted) H flux (see Figure 6), but due to the relatively large errorbars of its photometry, the detected overall flux change did not exceed during the year baseline of our observations.
More recently, SN 2014C was also detected in mid-IR bands with the Spitzer Space Telescope by the SPIRITS project, as a variable point source (Tinyanont et al., 2016). Note that Tinyanont et al. (2016) observed an increase of the mid-IR fluxes from SN 2014C between 200 and 600 days after explosion, while our observations span only the later ( days) phases. The latest Spitzer observations from the SPIRITS project, partly published by Tinyanont et al. (2016), show a slow but continuous decline of mid-IR fluxes between and days in both the and the bands, in agreement with our H observations.
Tinyanont et al. (2016) explained the observed re-brightening of SN 2014C in the mid-IR as due to shock heating (either radiative or collisional) of pre-existing dust around SN 2014C, which is in good agreement with the observations in other bands, including our H detections. This highlights the importance of simultaneous observations in non-optical bands, in order to detect additional tracers of the ejecta-CSM interaction that may discriminate between the different mechanisms producing the contemporaneous H emission.
The relatively low number of detected H-emitting point sources (13 out of 99 SNe, i.e. percent) is more-or-less consistent with the recent estimate for the rate of the SN 2001em/2014C-like events published by Margutti et al. (2016) based on late-time re-brightening in the radio. From 41 Type Ibc SNe having radio coverage at days after explosion, Margutti et al. (2016) found 4 cases (SN 2001em, SN 2003gk, SN 2007bg and SN iPTF11qcj, percent of the sample) when luminous radio re-brightening was observed years after core collapse. Since radio light curves are usually attributed to SN-CSM interaction, the emergence of radio fluxes at such late phases are very strong signs for the ejecta-CSM collision. Their result ( %) is consistent with our detection rate ( %) when taking into account that at least some of our detected H emitters could also be compact H II areas very close to the SN site, i.e. the detected emission may not be due to ejecta-CSM interaction in every case.
Variability in the detected H line emission can be another tracer for the SN-CSM interaction, because H II clouds are usually close to ionization/recombination equilibrium, and do not show noticeable variation in their emission line strengths. On the contrary, existing models on the ejecta-CSM interaction (e.g. Chugai & Chevalier, 2006; van Marle et al., 2010) predict several forms of variability in the produced radiation. The most commonly accepted scenario is the close link between the X-rays produced by the RS and the H line emission coming from the H-rich dense shell in between the FS and the RS (see Section 1). Since the main source of the escaping H line photons are the X-rays absorbed by the shell, any kind of variation in the absorbed X-rays can imply change in the emergent H flux. At the beginning of the interaction the models predict a relatively quick rise ( days) of the X-ray flux (Chugai & Chevalier, 2006) followed by a slower decline after the FS passed through the dense shell and the shell got accelerated by the SN ejecta piling up from behind (Chevalier & Liang, 1989). The deceleration of the RS, , where is the power-law index of the density profile in the outer part of the SN ejecta, is also partly responsible for the decrease of the H luminosity since (Chevalier & Fransson, 2003; Nymark et al., 2006) and , where is the efficiency of converting the X-ray flux to H photons and is the mass of the dense CSM shell (Chugai & Chevalier, 2006). In addition, at later phases the shell gets diluted by expansion, reducing the X-ray optical depth, which causes further decrease in the produced H radiation.
In Figure 6 there are examples for increasing (e.g. SN 1981B, 2012fh) as well as decreasing (SN 2005kl, SN 2014C) H luminosities. In the simple interaction scenario described above, the increasing H fluxes might be connected with an early-phase, still strengthening ejecta-CSM interaction, while the declining H fluxes could be explained by a more evolved interaction. The possibility for the developing ejecta-CSM interaction around the Type Ia SN 1981B, as suggested by the persistent (even though not statistically significant) increase in its H luminosity, is especially interesting, since is the only SN Ia in our sample that shows such a phenomenon. Since the baseline of our survey is still less than 1000 days, and we have only a few measured points for each SNe, it is premature to draw any definite conclusion on such details. Future observations will be useful to decide whether these SNe are indeed subject to ejecta-CSM interaction.
VI. Conclusions
Our narrow-band imaging survey of old, H-deficient (Type Ibc, Ia and IIb) SNe through H filters resulted in the following:
-
•
detection of continuum-subtracted H emission from 27 SNe sites (see Table 2), 13 of which are point sources at our resolution;
-
•
detection of significant variation (exceeding ) of the H emission from 3 SNe: SN 1985F, SN 2005kl, SN 2012fh (all SN Ibc and point sources). SN 2010gi, a diffuse source around a SN IIb, also shows some sort of variability, but its reality is more uncertain;
-
•
a strong, variable H emitter, SN 2005kl (SN Ic), for which the H luminosity exceeds that of the typical H II regions by an order of magnitude;
-
•
detection of H emission from the known late-time interacting SN 2004dk and SN 2014C;
-
•
possible variation in the H emission from SN 1981B (Ia), SN 2012P (IIb), SN 2013dk (Ic) and SN 2014C (Ib).
We conclude that in the case of the three variable H emitters, i.e. SN 1985F, SN 2005kl and SN 2012fh, the source of the net H emission is likely the ongoing ejecta-CSM interaction. The robustness of our methodology is demonstrated by the successful detection of the well-known interacting SN 2004dk and SN 2014C. The number of the detected point-source H emitters, 13 out of 99 SNe, is consistent with the recently estimated rate ( percent) of such events (Margutti et al., 2016).
In addition to continuing our narrow-band imaging for all nearby Type I SNe, we plan to obtain spectroscopic and multi-wavelength data, from radio to X-ray bands, for the SNe listed in Table 2 to confirm and characterize the ejecta-CSM interaction. We are also investigating the archival radio and X-ray coverage of these SNe (Pooley et al., in prep).
References
- Aretxaga et al. (1999) Aretxaga, I., Benetti, S., Terlevich, R. J., et al. 1999, MNRAS, 309, 343
- Bietenholz & Bartel (2005) Bietenholz, M. F., & Bartel, N. 2005, ApJ, 625, L99
- Chatzopoulos et al. (2013) Chatzopoulos, E., Wheeler, J. C., Vinko, J., Horvath, Z. L., & Nagy, A. 2013, ApJ, 773, 76
- Chevalier & Fransson (2003) Chevalier, R. A., & Fransson, C. 2003, Supernovae and Gamma-Ray Bursters, 598, 171
- Chevalier & Liang (1989) Chevalier, R. A., & Liang, E. P. 1989, ApJ, 344, 332
- Chugai & Chevalier (2006) Chugai, N. N., & Chevalier, R. A. 2006, ApJ, 641, 1051
- Chugai et al. (2007) Chugai, N. N., Chevalier, R. A., & Utrobin, V. P. 2007, ApJ, 662, 1136
- Dilday et al. (2012) Dilday, B., Howell, D. A., Cenko, S. B., et al. 2012, Science, 337, 942
- Drory (2003) Drory, N. 2003, A&A, 397, 371
- Filippenko (1997) Filippenko, A. V. 1997, ARA&A, 35, 309
- Fransson et al. (2014) Fransson, C., Ergon, M., Challis, P. J., et al. 2014, ApJ, 797, 118
- Granot & Ramirez-Ruiz (2004) Granot, J., & Ramirez-Ruiz, E. 2004, ApJ, 609, L9
- Heger et al. (1997) Heger, A., Jeannin, L., Langer, N., & Baraffe, I. 1997, A&A, 327, 224
- Inserra et al. (2016) Inserra, C., Fraser, M., Smartt, S. J., et al. 2016, MNRAS, 459, 2721
- Kennicutt (1984) Kennicutt, R. C., Jr. 1984, ApJ, 287, 116
- Maeda et al. (2008) Maeda, K., Kawabata, K., Mazzali, P. A., et al. 2008, Science, 319, 1220
- Mauerhan & Smith (2012) Mauerhan, J., & Smith, N. 2012, MNRAS, 424, 2659
- Margutti et al. (2016) Margutti, R., Kamble, A., Milisavljevic, D., et al. 2016, arXiv:1601.06806
- Milisavljevic et al. (2015) Milisavljevic, D., Margutti, R., Kamble, A., et al. 2015, ApJ, 815, 120
- Nymark et al. (2006) Nymark, T. K., Fransson, C., & Kozma, C. 2006, A&A, 449, 171
- Pastorello et al. (2007) Pastorello, A., et al. 2007, Nature, 447, 829
- Pooley & Lewin (2004) Pooley, D., & Lewin, W. H. G. 2004, IAU Circ., 8323, 2
- Pooley (2007) Pooley, D. 2007, in Supernova 1987A: 20 Years After: Supernovae and Gamma-Ray Bursters, ed. S. Immler, K. Weiler, & R. McCray, volume 937 of American Institute of Physics Conference Series, 381
- Puls et al. (2008) Puls, J., Vink, J. S., & Najarro, F. 2008, A&A Rev., 16, 209
- Schinzel et al. (2009) Schinzel, F. K., Taylor, G. B., Stockdale, C. J., Granot, J., & Ramirez-Ruiz, E. 2009, ApJ, 691, 1380
- Schlafly & Finkbeiner (2011) Schlafly, E. F., & Finkbeiner, D. P. 2011, ApJ, 737, 103
- Shiode & Quataert (2014) Shiode, J. H., & Quataert, E. 2014, ApJ, 780, 96
- Silverman et al. (2013a) Silverman, J., et al. 2013a, ApJS, 207, 3
- Silverman et al. (2013b) Silverman, J., et al. 2013b, ApJ, 772, 125
- Smith & Owocki (2006) Smith, N., & Owocki, S. P. 2006, ApJ, 645, L45
- Smith (2014) Smith, N. 2014, ARA&A, 52, 487
- Soderberg et al. (2004) Soderberg, A. M., Gal-Yam, A., & Kulkarni, S. R. 2004, GRB Coordinates Network, 2586, 1
- Stockdale et al. (2004) Stockdale, C. J., et al. 2004, IAU Circ., 8282, 2
- Stockdale et al. (2009) Stockdale, C. J., Heim, M. S., Vandrevala, C. M., et al. 2009, IAU Circ., 1714, 1
- Taam & Sandquist (2000) Taam, R. E., & Sandquist, E. L. 2000, ARA&A, 38, 113
- Tinyanont et al. (2016) Tinyanont, S., Kasliwal, M. M., Fox, O. D., et al. 2016, ApJ, 833, 231
- van Marle et al. (2010) van Marle, A. J., Smith, N., Owocki, S. P., & van Veelen, B. 2010, MNRAS, 407, 2305
- Wellons et al. (2012) Wellons, S., Soderberg, A. M., & Chevalier, R. A. 2012, ApJ, 752, 17