Plasma Brightenings in a Failed Solar Filament Eruption
Abstract
Failed filament eruptions are solar eruptions that are not associated with coronal mass ejections. In a failed filament eruption, the filament materials usually show some ascending and falling motions as well as generate bright EUV emissions. Here we report a failed filament eruption that occurred in a quiet-Sun region observed by the Atmospheric Imaging Assembly on board the Solar Dynamics Observatory. In this event, the filament spreads out but gets confined by the surrounding magnetic field. When interacting with the ambient magnetic field, the filament material brightens up and flows along the magnetic field lines through the corona to the chromosphere. We find that some materials slide down along the lifting magnetic structure containing the filament and impact the chromosphere to cause two ribbon-like brightenings in a wide temperature range through kinetic energy dissipation. There is evidence suggesting that magnetic reconnection occurs between the filament magnetic structure and the surrounding magnetic fields where filament plasma is heated to coronal temperatures. In addition, thread-like brightenings show up on top of the erupting magnetic fields at low temperatures, which might be produced by an energy imbalance from a fast drop of radiative cooling due to plasma rarefaction. Thus, this single event of failed filament eruption shows existence of a variety of plasma brightenings that may be caused by completely different heating mechanisms.
1 Introduction
Eruptions of solar filaments or prominences (Tandberg-Hanssen, 1974) are one of the drastic activities in the solar atmosphere (Parenti, 2014; Vial & Engvold, 2015; McCauley et al., 2015). They involve energy release, plasma heating, as well as ascending and/or falling motions of plasma, which are coupled with the ambient magnetic field in both active regions and quiet-Sun regions. There are three kinds of filament eruptions (Gilbert et al., 2007), referred to as full, partial, and confined (or failed; Ji et al. 2003) ones. The former two are usually associated with a coronal mass ejection; while in the latter two, one might observe the filament material falling back to the Sun.
When the erupted filament material falls back to the Sun, it could cause bright impacts on the solar surface by kinetic energy dissipation. Reale et al. (2013) reported the hot impacts after the 2011 June 7 eruption that was associated with an M2.5 flare. They found through a numerical simulation that the strong impact brightening comes from the original fragment material when hitting the solar surface. In their simulation, they did not consider the role of magnetic field, since the magnetic field in most of the impact regions (quiet-Sun) is rather weak, and most of the fragments are basically in free fall. Petralia et al. (2016) studied the same event but focused on the impacts close to active regions with relatively strong magnetic fields. They observed that the magnetic channel brightens before the fragment impacts the solar surface. By performing a magnetohydrodynamic simulation with the magnetic field included, they found that the filament material is channelled by the magnetic field and that the brightening ahead of the pre-impact fragments mainly comes from a shocked region. Innes et al. (2016) also investigated the same event and reported that many of the falling fragments are dissipated above the chromosphere and cause brightenings in the corona, either due to ionization and trapping in magnetic fields or because of encountering a splash from earlier impacts.
The kinetic motion and emission property of the filament material could be influenced by the surrounding magnetic field. Firstly, the magnetic field could spread out, deform, and fragment the filament material (Innes et al., 2012; Petralia et al., 2016). The filament material could also be slowed down by magnetic drag forces (Dolei et al., 2014) and even prevented from falling deep into the chromosphere (Innes et al., 2016). In some cases, for example, the magnetic pressure balances the ram pressure of filament material, or the material is ionized and so trapped in the magnetic field, the material would be channelled along the magnetic field lines (Petralia et al., 2016). During the channelling, the material can generate bright EUV emission by kinetic energy dissipation (Innes et al., 2016) or impact ionization (Downs et al., 2013). In other words, the bright EUV emission of the material could simply trace out the magnetic field lines (Downs et al., 2013; Innes et al., 2016; Petralia et al., 2016). Note that, even in the quiet-Sun region, the confinement and impact of the falling material could produce loop-like brightenings, implying that the quiet-Sun corona is still structured by the magnetic field (Innes et al., 2016). In addition, bright EUV emissions could show up as a result of magnetic reconnection between the magnetic field in the filament and that in the ambient corona as manifested by a redirection of the filament material (van Driel-Gesztelyi et al., 2014; Li et al., 2016).
In this paper, we report a failed filament eruption that occurred in a quiet-Sun region (i.e., confined eruption of a quiescent filament; Priest 1989). In this event, the erupting filament is confined by the surrounding magnetic field. When interacting with the ambient magnetic field, the filament material brightens up and flows along the magnetic field lines through the corona to the chromosphere. We find two ribbon-like brightenings near the solar surface, plasma heating in some helical structures, and also thread-like brightenings on top of the erupting magnetic fields. These brightenings appearing in different magnetic structures in this event are possibly related to different kinds of mechanisms that produce local heating effect.
2 Observations
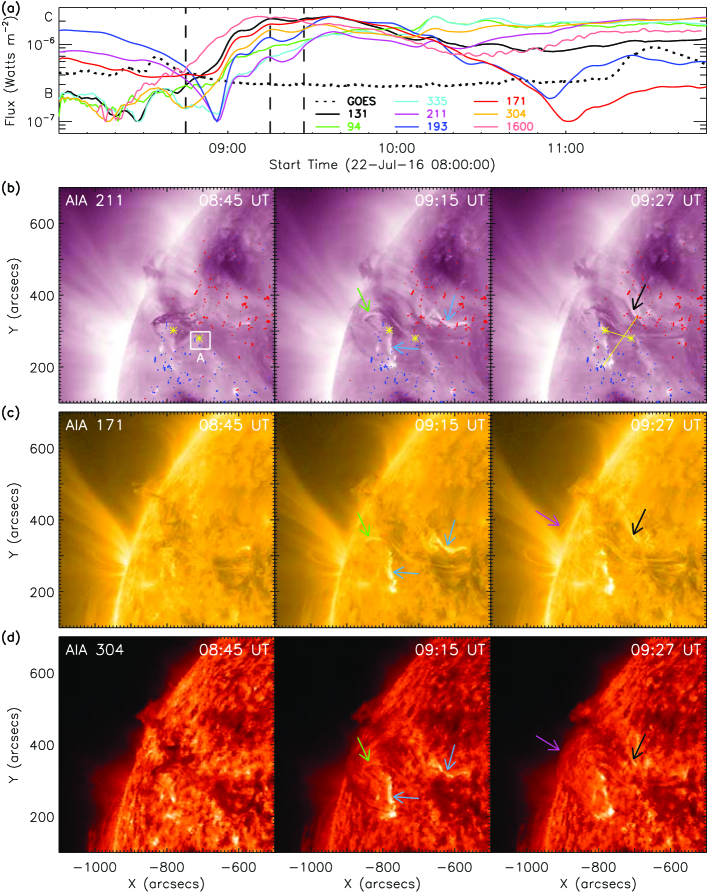
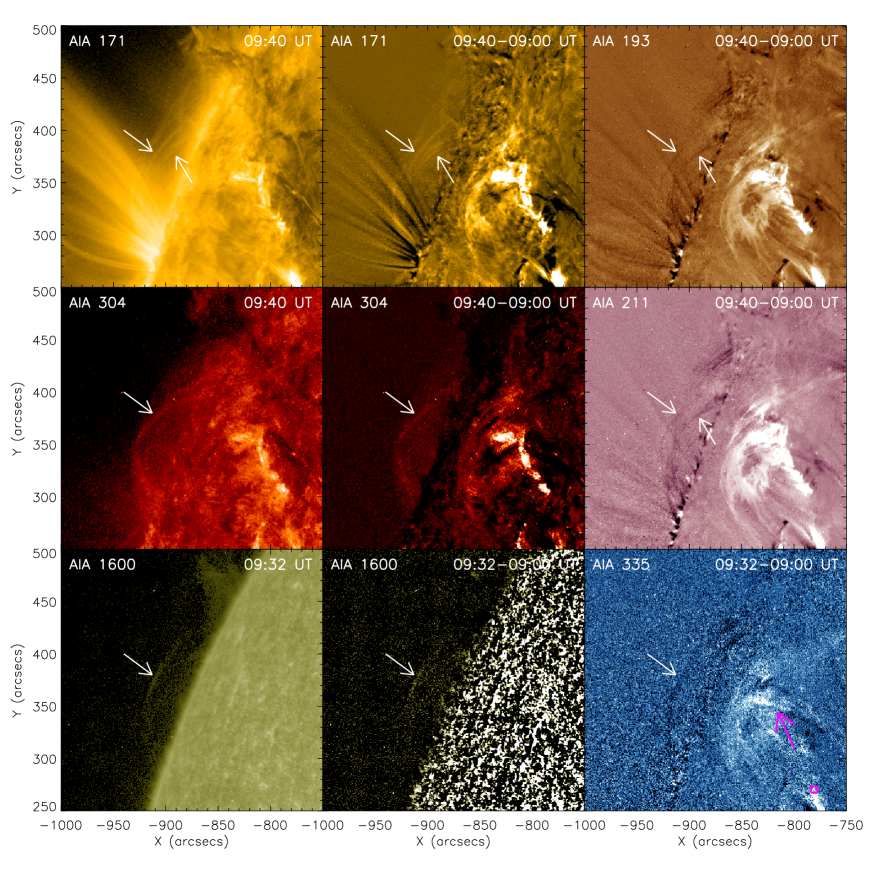
The event presented here is a failed filament eruption on 2016 July 22 in a quiet-Sun region near the northeast limb. It was observed by the Atmospheric Imaging Assembly (AIA; Lemen et al. 2012) with a high spatial resolution ( pixel-1) and time cadence (12 or 24 s) in the EUV111The EUV passbands include 131 Å (10 MK), 94 Å (6.3 MK), 335 Å (2.5 MK), 211 Å (2.0 MK), 193 Å (1.6 MK), and 171 Å (0.6 MK) for coronal plasmas, and 304 Å (0.05 MK) for chromospheric plasmas. and UV222The UV 1600 Å passband contains the chromospheric continuum plus the transition region C iv line. passbands and by the Helioseismic and Magnetic Imager (HMI; Schou et al. 2012) on board the Solar Dynamics Observatory (SDO). From the multi-wavelength (or multi-temperature) AIA images (Animation 1 accompanying Figure 1), we can see that the filament spreads out but gets confined by the surrounding magnetic field. When interacting with the ambient magnetic fields, the dark material gets brightened in the form of threads (see the green and magenta arrows in Figure 1) as well as slides down along the lifting coronal field lines. As the material hits the chromosphere, it creates two ribbon-like brightenings (marked by the blue arrows in Figure 1). From the line of sight HMI magnetogram (see the contours at 100 G in Figure 1(b) and also Animation 1), it is seen that this event takes place in a bipolar region with weak magnetic fields and the polarity inversion line generally extends from northeast to southwest. Note that there exist some quite weak positive magnetic polarities within the main negative polarity area, and vice versa.
We notice that the erupting filament material likely flows along the magnetic field lines, displaying a sheared arcade structure containing the filament (referred to as sheared filament arcade hereafter) in an early time and a series of less-sheared thread structures at a later time (see the two yellow asterisks in Figure 1(b) marking the approximate position of the sheared filament arcade footpoints and the two yellow lines implying a change of shear in the magnetic field lines, i.e., the angle between the connecting line of conjugate footpoints and the polarity inversion line along the northeast–southwest direction becoming larger over time)333There should be a line of sight effect in the shear, but combining the HMI magnetogram, we could say that a sheared arcade structure and some less-sheared field lines show up in this region.. Note that some background coronal arcades could also be seen in the AIA 211 Å and 193 Å images. As the sheared filament arcade expands and interacts with the surrounding magnetic field, some helical structures show up (see the white box in Animation 1 around 09:30 UT) with bright plasmas swirling along the magnetic field lines.
Note that, despite two ribbon-like brightenings generated by the falling plasma, no notable flare (i.e., traditional GOES X-ray event) was observed during this failed eruption. The GOES 1–8 Å soft X-ray flux (the black dotted curve in Figure 1(a)) is basically flat at the B3 level during the main eruption. In addition, no evident flare loops (i.e., filled with the plasma from chromospheric evaporation) show up in the EUV images. The integrated EUV light curves (Figure 1(a)) do not show a clear cooling trend as flare loops usually behave (Li et al., 2014; Qiu & Longcope, 2016), either.
3 Analysis and Results
3.1 the brightenings near the solar surface: impacts of
the filament material channelled along the coronal field lines
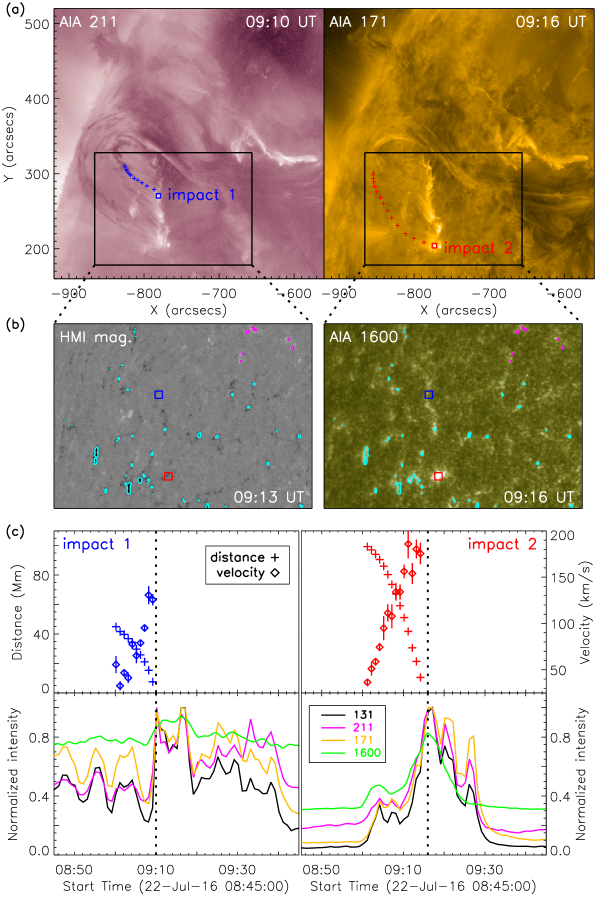
The multi-temperature AIA images show that the filament materials slide down along the lifting coronal field lines and hit the chromosphere causing two ribbon-like brightenings. Here we focus on these brightenings in the context of the material impacts first. From Figure 1 and the accompanying Animation 1, one can find some obvious features in the impact brightenings. (1) The brightenings show up in all the EUV passbands as well as the UV 1600 Å channel almost simultaneously, though in the latter, the two ribbons are not well defined (see Figure 2(b)). This indicates that the impacting materials are rapidly heated to millions of degrees and have a wide temperature range. (2) The brightenings generally display patches or pieces in shape. (3) The brightenings fade out quickly with a typical lifetime of only several minutes. (4) The brightenings show multiple peaks in the EUV light curves at some locations (Figure 2(c)), implying that a series of impacts occur there.
For a further quantitative analysis, we select two sample locations (see the blue and red squares in Figure 2) on the ribbon-like brightenings, and track the falling paths of the impacting plasmas (denoted by plus symbols in Figure 2 and the accompanying Animation 2444We derotate the AIA images when tracking the falling paths of the two sample impacts.). From the falling paths, we derive the plane-of-sky velocities (diamonds in Figure 2(c)) that increase from tens to hundreds of km s-1. As seen in Animation 2, the kinetic motion of the material actually contains two components, i.e., an expanding (or unshearing) motion and a falling one, as the filament fragments get elongated and channelled by the coronal field lines. When the dark fragments hit the chromosphere (at 09:10 UT for impact 1 and 09:16 UT for impact 2), they generate significant brightenings as shown in the EUV and UV light curves (Figure 2(c)) seemingly converting kinetic energy to thermal energy. We find that the impact velocities of the two sample locations (i.e., 1266 and 17612 km s-1) are similar to the ones measured in Gilbert et al. (2013). Therefore, heating by kinetic energy dissipation of falling material is a viable mechanism to explain these observations.
The two ribbon-like brightenings support the gravitational model proposed for disappearing filaments by Hyder (1967). These brightenings correspond to the chromospheric footpoints of a row of coronal field lines, which is consistent with the distribution of the pair of magnetic polarities on the HMI magnetogram (see Figure 1(b) and Animation 1).
Note that, in this event, one can also find that some filament materials have brightened before they impact the chromosphere (such as the bright threads indicated by the black arrow in Figure 1). Moreover, some materials seem to mainly brighten in the corona. These materials are presumably heated and ionized by kinetic energy dissipation in the corona (Innes et al., 2016) or by shock fronts and thermal conduction ahead of the falling materials (Petralia et al., 2016).
3.2 the brightenings in the helical structures:
reconfiguration of the coronal magnetic field
In this event, evident brightenings also show up in some helical (or twisted) structures which can be described as magnetic flux ropes, as shown in Animation 1 (see the white box). These brightenings are visible in almost all the EUV passbands, indicating that the plasma is heated to a few MK. The brightenings and the helical flux rope (indicated by the arrows in Figure 3) probably suggest that magnetic reconnection occurs as the sheared filament arcade expands and interacts with the surrounding magnetic fields (Parenti, 2014; Vial & Engvold, 2015). This reconnection can heat the filament material and transform some sheared arcades into twisted field lines comprising the flux rope (van Ballegooijen & Martens, 1989; Longcope et al., 2007; Priest & Longcope, 2017).
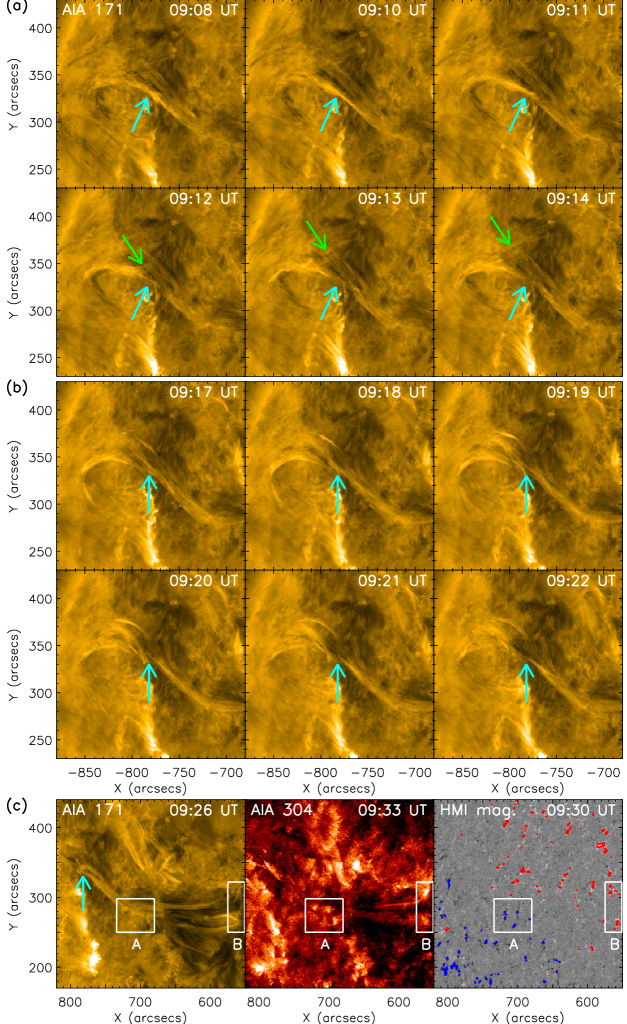
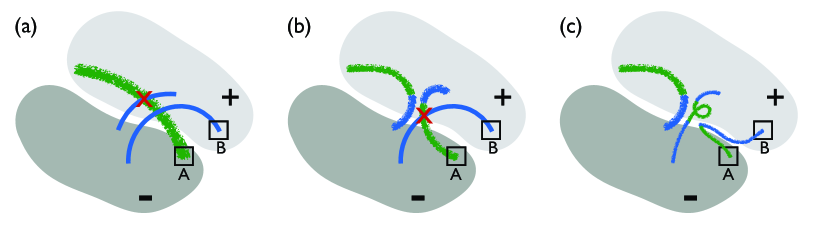
More evidence of magnetic reconnection comes from a break of filament plasma distribution (basically tracing the coronal magnetic field) and a new connection of field line footpoints. From Figures 4(a) and (b) and the accompanying Animation 3, one can see that the brightened filament plasmas seem to break up (indicated by the cyan arrows) as time evolves. In particular, during the break at an early time, some of the brightened plasmas are also redirected (marked by the green arrows in Figure 4(a); also see Animation 3). Near the break site, some plasmas begin to swirl up along the helical structures and some others fall down along the coronal (i.e., reconnected) field lines. The break of filament plasma distribution then brings a new connection of the footpoints of coronal field lines, as shown in Figure 4(c). It is seen that one of the footpoint (in the white box A; also denoted in Figure 1(b)) of the sheared filament arcade is connected to a new footpoint (in the white box B), both of which start to brighten at the same time. The footpoints in A and B, as clearly seen in the AIA 304 Å images, are located at the negative and positive magnetic polarities on the HMI magnetogram, respectively. The magnetic configuration of reconnection between the sheared filament arcade and the surrounding magnetic fields is sketched in Figure 5.
3.3 the brightenings on top of the erupting magnetic fields:
rarefaction of the plasma constrained in the coronal magnetic field
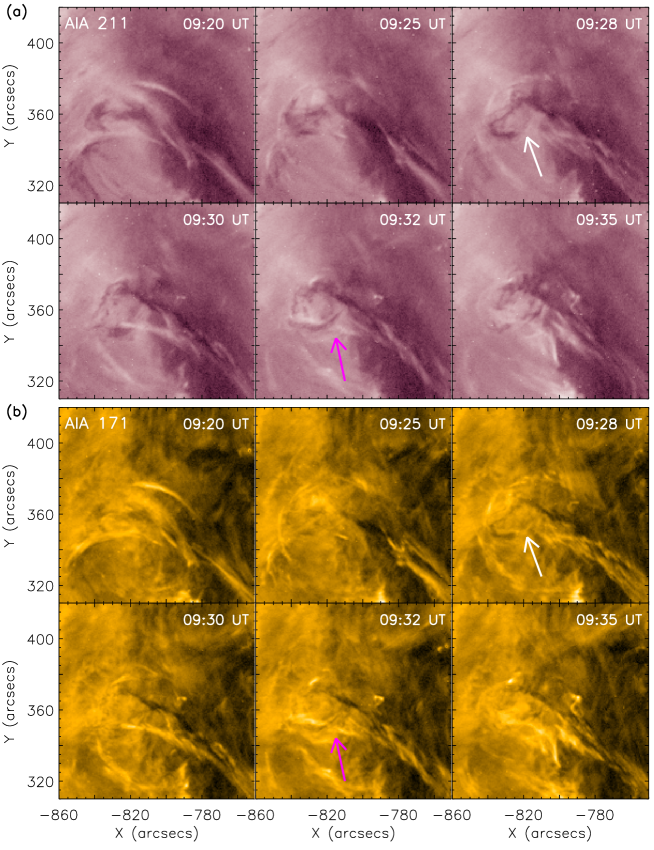
Besides the brightenings at the two ribbon-like impacts and in the helical structures, we observe thread-like brightenings on top of the erupting magnetic fields (see the white arrows in Figure 6 and the accompanying Animation 4). These weak emissions only show up as bright threads in some of the lower-temperature passbands (1 MK), i.e., in the AIA 1600 Å, 304 Å, and 171 Å passbands. While in the relatively hot 193 Å, 211 Å, and 335 Å passbands (1 MK), these threads display dark features, indicative of a relatively low temperature there. This is quite different from the brightenings due to material impacts (S3.1) and magnetic reconnection (S3.2), which are visible in almost all the EUV passbands covering a temperature range up to a few MK (see the magenta arrow and square overplotted in Figure 6). This implies that a different mechanism is at work in the thread-like brightenings on top of the erupting magnetic fields.
From Animation 4, we see that the thread structures filled with dark filament materials appear to expand and brighten up in the low-temperature passbands. The expansion of the thread structures and, in particular, the falling down of plasma along the field lines (described in S3.1), can make the plasma near the top rarefied. We therefore propose a possible cause of the thread-like brightenings in terms of an energy imbalance between the radiative cooling and the background heating. Suppose that originally the radiative cooling is balanced by the background heating from, say, wave damping (Erdélyi, 2004; Antolin et al., 2008) or nanoflare heating (Parker, 1988; Klimchuk, 2006), on top of the erupting magnetic fields. If the mass density there decreases, the radiative cooling rate, proportional to the density square, drops more rapidly than the background heating rate, which is usually proportional to the density. Then, an energy imbalance could induce a heating effect there. This process has been reproduced in numerical simulations (P. F. Chen 2016, private communications). Since such a heating only works subtly, the induced temperature increase should be small and probably only visible in some low-temperature passbands, as revealed in this event.
4 Summary and Discussions
We have presented a failed filament eruption in a quiet-Sun region observed by AIA and HMI. In this event, the erupting filament is confined by the surrounding magnetic field. When interacting with the ambient magnetic field, the filament material brightens up and flows along the magnetic field lines through the corona to the chromosphere. We find two ribbon-like brightenings near the solar surface, plasma heating in some helical structures, as well as thread-like brightenings on top of the erupting magnetic fields. Based on their different observational features, these brightenings in different magnetic structures likely result from different kinds of heating mechanisms.
First, the two ribbon-like brightenings near the solar surface mainly come from the impacts of filament fragments through kinetic energy dissipation (Innes et al., 2016; Petralia et al., 2016). The fragments slide down along the lifting coronal field lines and crash into the chromosphere to cause impact brightenings. Although the impact is most likely the cause here, we do not exclude some other mechanisms, such as a reconnection between the magnetic field channelling the impact material and the low-lying loops (Gilbert et al., 2013), which might play some role in these brightenings.
Second, the brightenings in the helical structures are likely from the magnetic reconnection between the sheared filament arcade and the surrounding magnetic field. Although we find some probable signatures of reconnection, such as brightenings, helical structures, and breaks of plasma distribution as well as a new connection of coronal field line footpoints, it is interesting that no evident flare loops were observed in this event. Moreover, magnetic reconnection usually accelerates non-thermal particles to produce hard X-ray emissions; however, no excess emissions were found in the hard X-ray light curves from RHESSI during this event. The above facts could be explained by the following reasons. (1) The reconnection between the sheared filament arcade and the surrounding magnetic field probably involves only a little magnetic flux (so as not to produce any notable flare) in this quiet-Sun region with a weak magnetic field, and thus could not produce evident chromospheric evaporation to fill and brighten the flare loops. In fact, we notice that van Driel-Gesztelyi et al. (2014) reported a similar event in which a reconnection occurs between the erupting flux rope and the ambient magnetic field. Their event shows little signature of chromospheric evaporation in flare loops, just like our case. (2) The energy released from the reconnection might be mainly converted to plasma heating and only a small fraction is used to accelerate electrons. Those non-thermal electrons, if present, may be quickly thermalized by the heated dense filament plasma; thus, no detectable hard X-ray emission could be produced. This case has been reported by Milligan (2008) in which a microflare showed hot plasma with absence of any detectable hard X-ray emission. It is also noteworthy that, in addition to the energy released through reconnection, compression of the filament plasma may also provide some heating energy.
Finally, for the bright threads on top of the erupting magnetic fields only appearing in the low-temperature passbands, a possible explanation is the energy imbalance from a fast drop of radiative cooling due to the plasma rarefaction. Such an effect has rarely been reported in previous studies. This failed filament eruption is a promising example showing this mechanism to work at some places. We do not, however, exclude other possibilities, such as plasma compression by the expanding thread structures, which could be responsible for these thread-like brightenings.
Overall, this event reveals different kinds of brightenings resulting from different heating mechanisms. In the future, a numerical simulation is needed to show how these mechanisms work jointly in a single event.
References
- Antolin et al. (2008) Antolin, P., Shibata, K., Kudoh, T., Shiota, D., & Brooks, D. 2008, ApJ, 688, 669
- Dolei et al. (2014) Dolei, S., Bemporad, A., & Spadaro, D. 2014, A&A, 562, A74
- Downs et al. (2013) Downs, C., Linker, J. A., Mikić, Z., et al. 2013, Science, 340, 1196
- Erdélyi (2004) Erdélyi, R. 2004, Astronomy and Geophysics, 45, 4.34
- Gilbert et al. (2007) Gilbert, H. R., Alexander, D., & Liu, R. 2007, Sol. Phys., 245, 287
- Gilbert et al. (2013) Gilbert, H. R., Inglis, A. R., Mays, M. L., et al. 2013, ApJ, 776, L12
- Hyder (1967) Hyder, C. L. 1967, Sol. Phys., 2, 49
- Innes et al. (2012) Innes, D. E., Cameron, R. H., Fletcher, L., Inhester, B., & Solanki, S. K. 2012, A&A, 540, L10
- Innes et al. (2016) Innes, D. E., Heinrich, P., Inhester, B., & Guo, L.-J. 2016, A&A, 592, A17
- Ji et al. (2003) Ji, H., Wang, H., Schmahl, E. J., Moon, Y.-J., & Jiang, Y. 2003, ApJ, 595, L135
- Klimchuk (2006) Klimchuk, J. A. 2006, Sol. Phys., 234, 41
- Lemen et al. (2012) Lemen, J. R., Title, A. M., Akin, D. J., et al. 2012, Sol. Phys., 275, 17
- Li et al. (2016) Li, L., Zhang, J., Peter, H., et al. 2016, Nature Physics, 12, 847
- Li et al. (2014) Li, Y., Qiu, J., & Ding, M. D. 2014, ApJ, 781, 120
- Longcope et al. (2007) Longcope, D. W., Beveridge, C., Qiu, J., et al. 2007, Sol. Phys., 244, 45
- McCauley et al. (2015) McCauley, P. I., Su, Y. N., Schanche, N., et al. 2015, Sol. Phys., 290, 1703
- Milligan (2008) Milligan, R. O. 2008, ApJ, 680, L157
- Parenti (2014) Parenti, S. 2014, Living Reviews in Solar Physics, 11, 1
- Parker (1988) Parker, E. N. 1988, ApJ, 330, 474
- Petralia et al. (2016) Petralia, A., Reale, F., Orlando, S., & Testa, P. 2016, ApJ, 832, 2
- Priest (1989) Priest, E. R. 1989, Dynamics and Structure of Quiescent Solar Prominences, 150
- Priest & Longcope (2017) Priest, E. R., & Longcope, D. W. 2017, Sol. Phys., 292, 25
- Qiu & Longcope (2016) Qiu, J., & Longcope, D. W. 2016, ApJ, 820, 14
- Reale et al. (2013) Reale, F., Orlando, S., Testa, P., et al. 2013, Science, 341, 251
- Schou et al. (2012) Schou, J., Scherrer, P. H., Bush, R. I., et al. 2012, Sol. Phys., 275, 229
- Tandberg-Hanssen (1974) Tandberg-Hanssen, E. 1974, Geophysics and Astrophysics Monographs, 12
- van Ballegooijen & Martens (1989) van Ballegooijen, A. A., & Martens, P. C. H. 1989, ApJ, 343, 971
- van Driel-Gesztelyi et al. (2014) van Driel-Gesztelyi, L., Baker, D., Török, T., et al. 2014, ApJ, 788, 85
- Vial & Engvold (2015) Vial, J. C., & Engvold, O. (ed.) 2015, Solar Prominences (Astrophysics and Space Science Library), 415