Peak Transmission Rate Resilient Crosslayer Broadcast for Body Area Networks
Abstract.
Wireless Body Area Networks (WBAN) open an interdisciplinary area within Wireless Sensor Networks (WSN) research, with a tremendous impact in healthcare area where sensors are used to monitor, collect and transmit biological parameters of the human body. We propose the first network-MAC cross-layer broadcast protocol in WBAN. Our protocol, evaluated in the OMNET++ simulator enriched with realistic human body mobility models and channel models issued from the recent research on biomedical and health informatics, outperforms existing flat broadcast strategies in terms of percentage of covered nodes, energy consumption and correct reception of causally-ordered packets (i.e. packets are received in the same order as they were sent by the sink). Furthermore, we investigate the resilience of both existing flat broadcast strategies and our new protocol face to various transmission rates and human body mobility. Existing flat broadcast strategies without exception start to have a drastic drop of performances for transmission rates above Kb/s while our cross-layer protocol performances maintains its good performances for transmission rates up to Kb/s.
1. Introduction
In healthcare area WBAN (Wireless Body Area Networks) ((Movassaghi et al., 2014), (Latré et al., 2011), (Javaid et al., 2013)) emerged as a viable solution in response to the various disadvantages associated with wired sensors commonly used to monitor patients in hospitals and emergency rooms. WBAN is a promising technology and shall be increasingly necessary for monitoring, diagnosing and treating populations. Recent medical reports predict that the number of people using home health technologies will enormously increase from 14.3 to 78 million consumers from 2014 to 2020 (32, 2015), respectively. Additionally, body sensors shipments will hit 3.1 million units every year.
In WBAN tiny devices with low computing power and limited life, deployed in/on or around a human body, are able to detect and collect the physiological phenomena of the human body (such as: EEG, ECG, SpO2, lactic acid, etc.), and further transmit this information to a collector point (i.e Sink) that will process it, take decisions, alert or record.
WBANs (Johny and Anpalagan, 2014) differ from typical large-scale wireless sensor networks in many aspects: the size of the network is limited to a dozen of nodes, in-network mobility follows the body movements and the wireless channel has its specificities. Links have, in general, a very short range and a quality that varies with the wearer’s posture, but remains low in the general case. Indeed, the transmission power is kept low, which improves devices autonomy and reduces wearers electromagnetic exposition. Consequently, the effects of body absorption, reflections and interference cannot be neglected and it is difficult to maintain a direct link (one-hop) between a data collection point and all WBAN nodes. Although, recent research (i. Naganawa et al., 2015) advocates for using multi-hop communication in WBAN, very few multi-hop communication protocols have been proposed so far and even fewer are optimized for the human body mobility. In this paper we are focusing multi-hop broadcast protocols where the packets sent by a Sink node have be received by all the nodes in the network. Additionally, we investigate the native capability of these protocols to handle the reception of packets in the order they have been sent by the Sink without using heavy synchronization mechanisms.
Contributions
The current work extends in several ways the results in (Badreddine et al., 2015) where the authors propose a collection of network layer broadcast strategies designed specifically to be resilient to human body mobility in WBANs. First, we stressed all the strategies proposed in (Badreddine et al., 2015) with various transmission rates up to Kb/s in seven different mobility postures (walk, run, sleep, weak walk, etc). Our evaluation has been conducted in the OMNET++ simulator that we enriched with realistic human body mobility models and channel models issued from the recent research on biomedical and health informatics (i. Naganawa et al., 2015). With no exception, the existing flat broadcast strategies register a dramatic drop of performances when the transmission rate is superior to Kb/s. Second, we propose the first network-MAC layer broadcast protocol, CLBP, designed for multi-hop topologies and resilient to realistic human body postures and mobility. Our protocol is optimized to exploit the human body mobility by carefully choosing the most reliable communication paths in each studied posture. Moreover, our protocol includes a slot assignment mechanism that reduces the energy consumption, collisions, idle listening and overhearing. Additionally, CLBP includes a synchronization scheme that helps nodes to resynchronize with the sink on the fly. Our protocol outperforms existing flat broadcast strategies in terms of percentage of covered nodes, energy consumption and correct reception of causally-ordered packets (i.e. packets are received in the order of their sending). Furthermore, our protocol maintains its good performances up to Kb/s transmission rates.
Roadmap
This paper is organized as follows: Section 2 presents the related work. Section 3 presents the channel model and realistic human body mobility. In Section 4 we detail CLPB our new cross layer broadcast protocol. In section 5, we extensively evaluate protocols in (Badreddine et al., 2015) and our new cross layer protocol. Section 6 concludes the paper.
2. Related Work
Inspired by the tremendous work in WSN, adhoc networks(Ni et al., 1999) and DTN(Evan P. C. Jones and Ward, 2007), (Badreddine et al., 2015) proposes for the first time in the WBAN a set of multi-hop broadcast strategies and extensively evaluate them against realistic human body mobility. The evaluation focus the scenario where a specific node in the network, Sink sends a single packet to all the nodes in the network. Our current work extends the study in (Badreddine et al., 2015) by stressing the strategies proposed in (Badreddine et al., 2015) with various transmission rates. Our results, show a drastic drop of performances when the transmission rates. In order to encompass this drawback we propose a new cross layer broadcast protocol that exploits the communication graphs defined by the body mobility in order to optimize the communication. Hence our new protocol outperform existing flat strategies in terms of end-to-end delay, percentage of covered nodes, energy and native capability to provide causal order reception of packets.
There are very few cross-layered protocols specifically designed for WBAN (please refer to (Laurie et al., 2012), (Ullah et al., 2016), (Ullah et al., 2012) and (Correa et al., 2016) for a review of cross layer concepts, methods and existing protocols overview).
In the following we will discuss mainly multi-hop MAC-network cross-layer protocols that involve MAC and Network layers. These protocols focus converge-cast (nodes send packets to the Sink). To the best of our knowledge no cross-layer broadcast protocol has been proposed so far for multi-hop WBAN.
In (Braem et al., 2006), authors proposed WASP (implemented in (Garg et al., 2010)), a converge-cast cross-layer protocol. WASP is a slotted protocol that uses a spanning tree for medium access coordination and traffic routing. (Braem et al., 2006) is not resilient to realistic human body mobility.
CICADA, (Latre et al., 2007), was proposed as an improvement of WASP. CICADA aims at reducing energy consumption with the use of a spanning tree and an assignment of transmission slots. In addition, CICADA handles network nodes joining. CICADA has never been evaluated against realistic human body mobility and various transmission rates. Moreover, the medium access control scheme proposed in CICADA is specifically designed to handle converge-cast. Its adaptation to broadcast is an open question (Latre et al., 2007).
3. Channel model
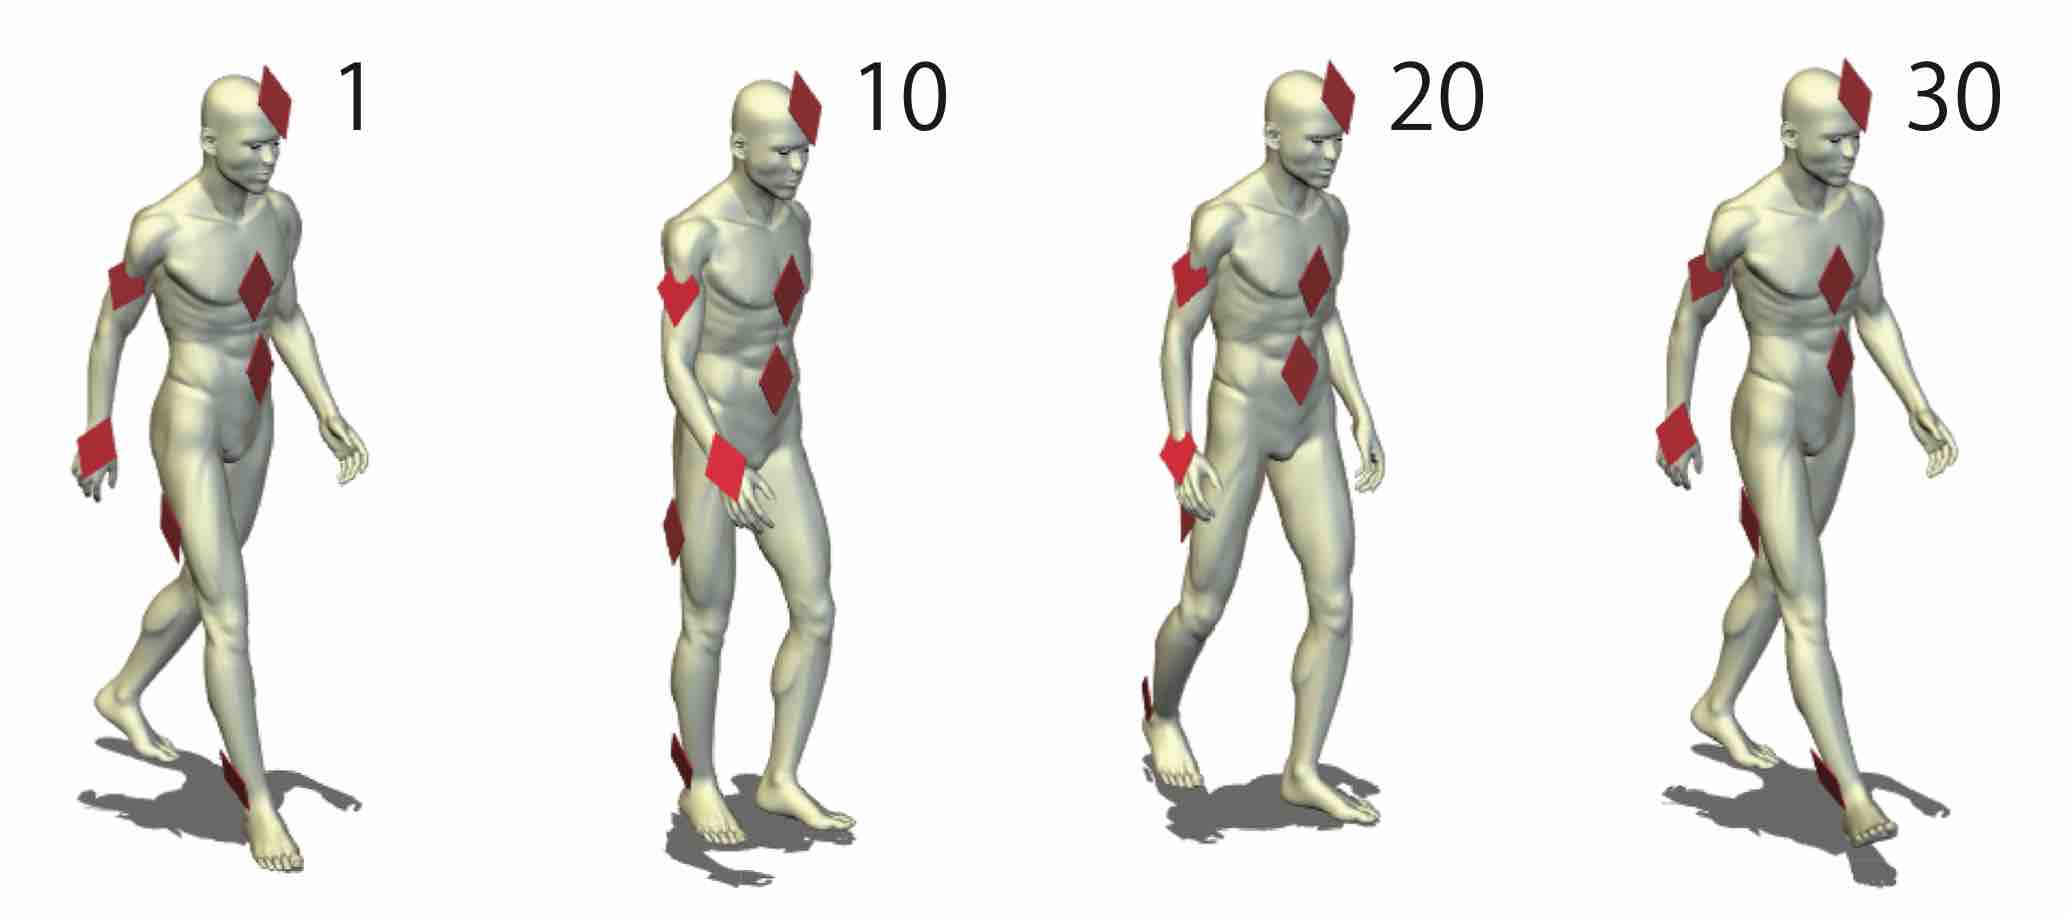
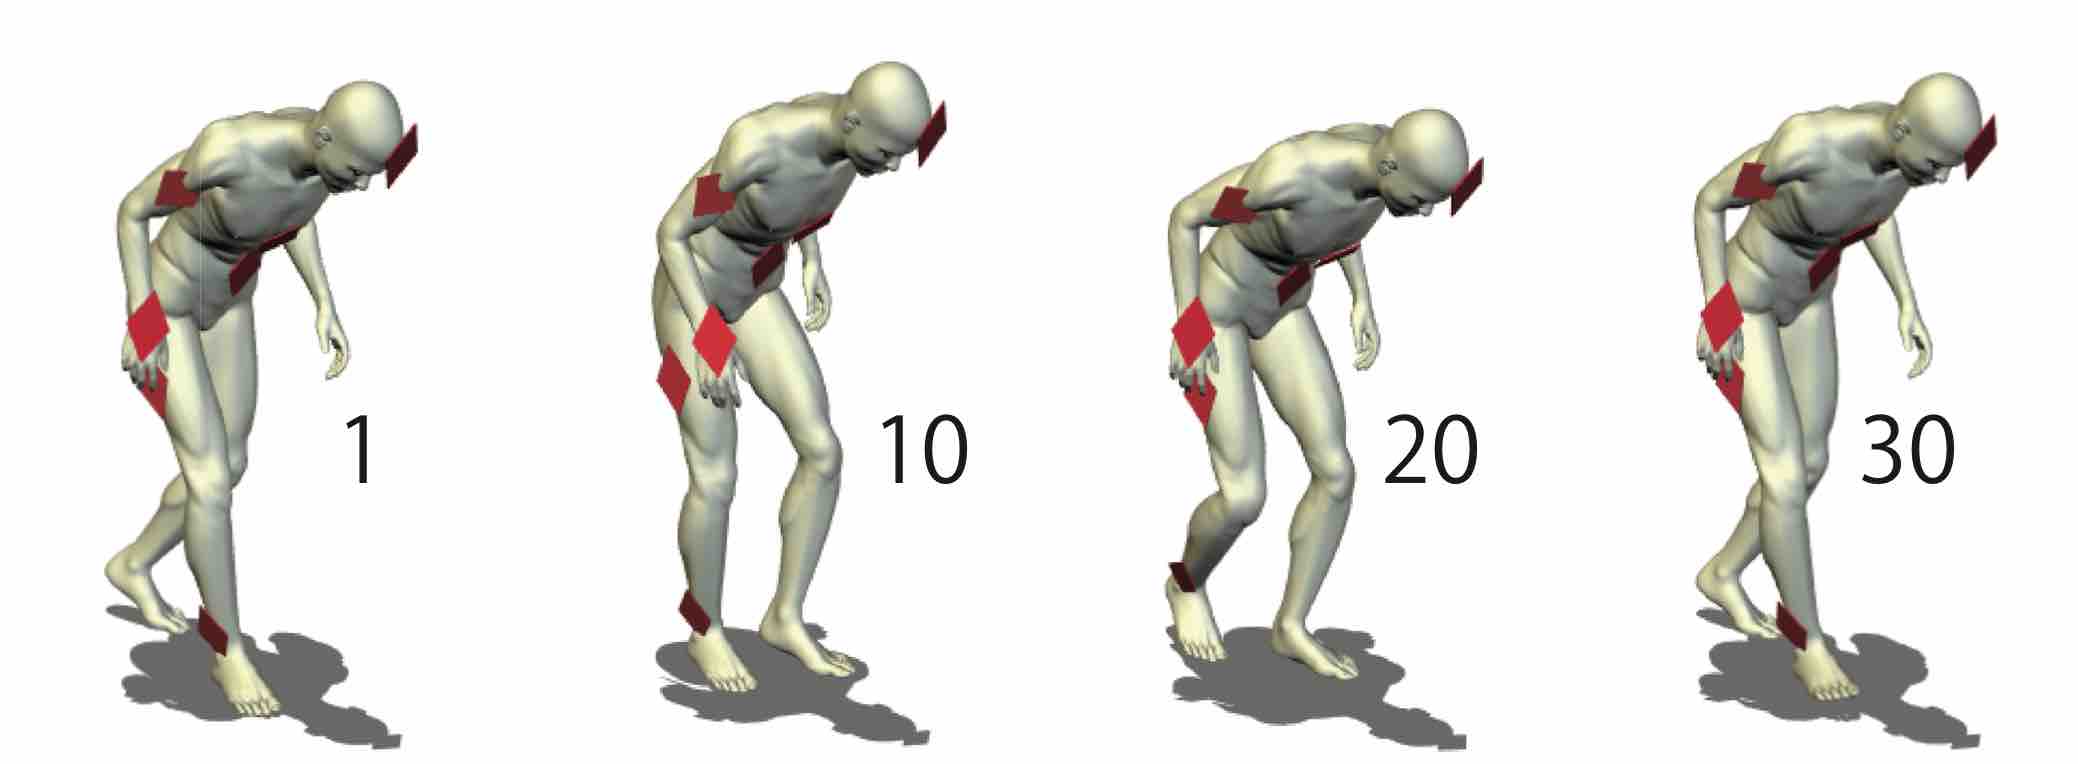
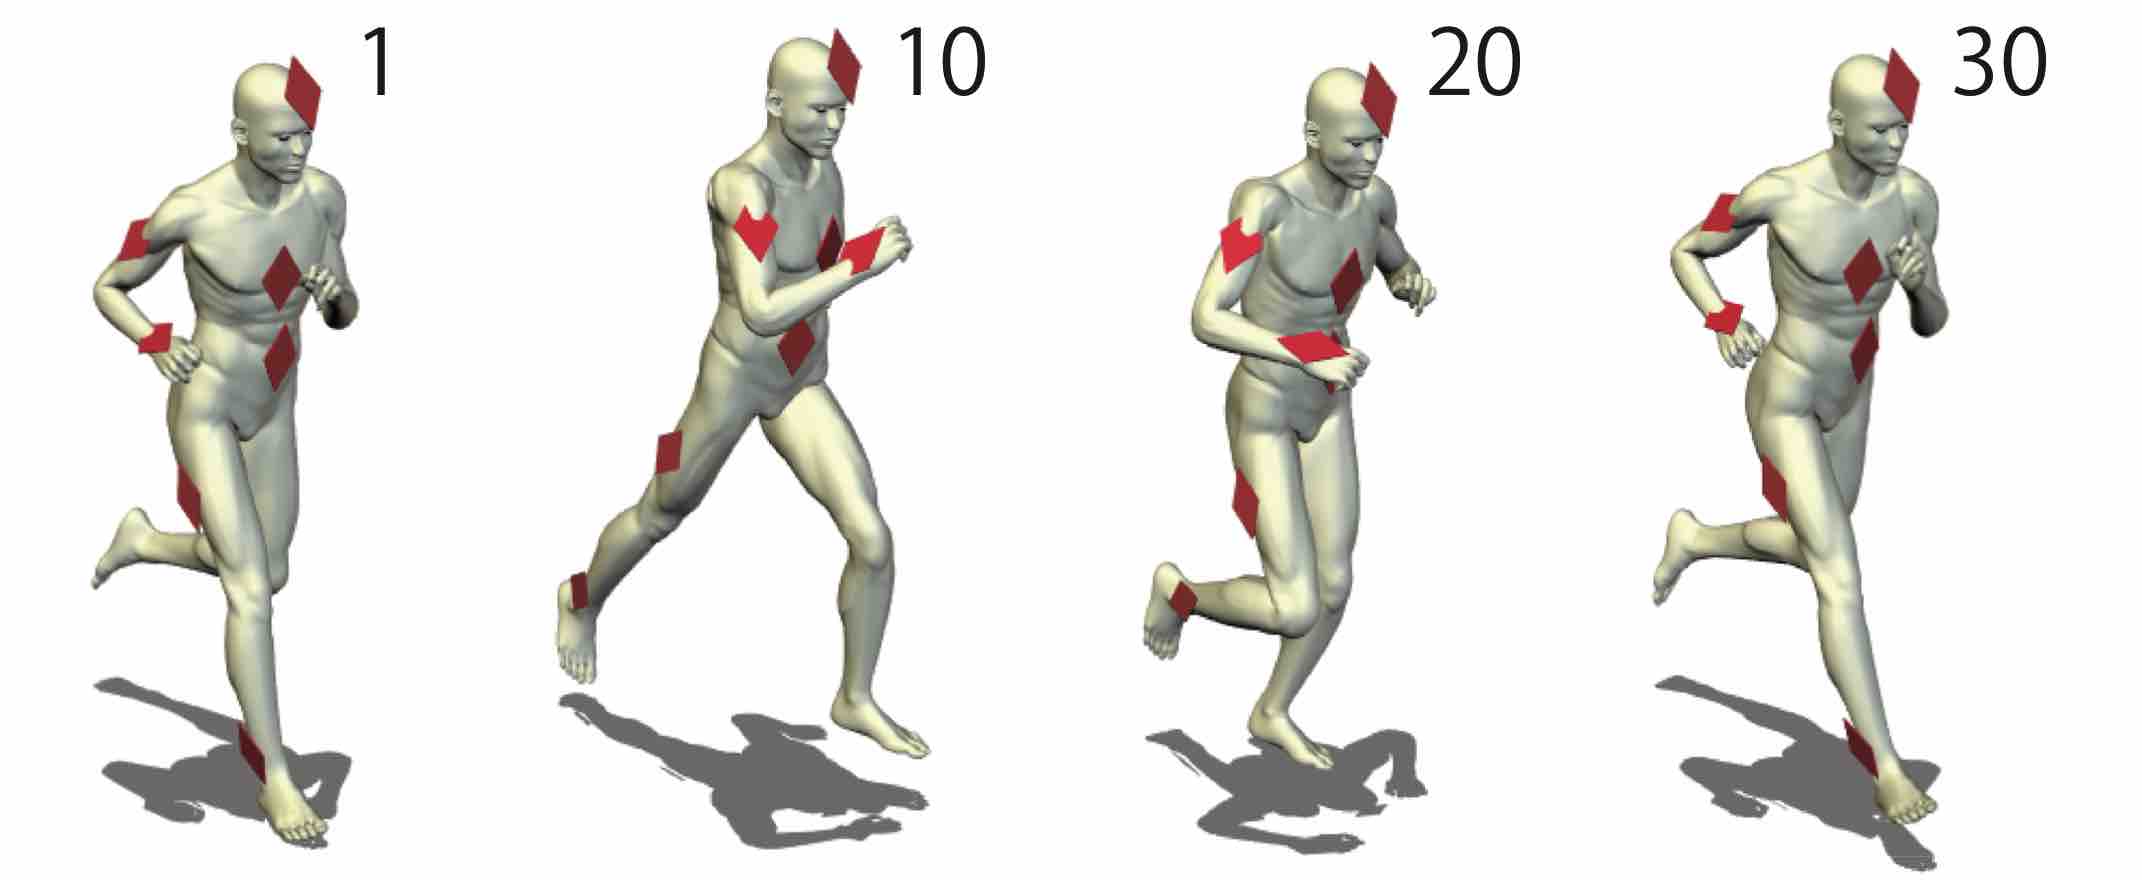
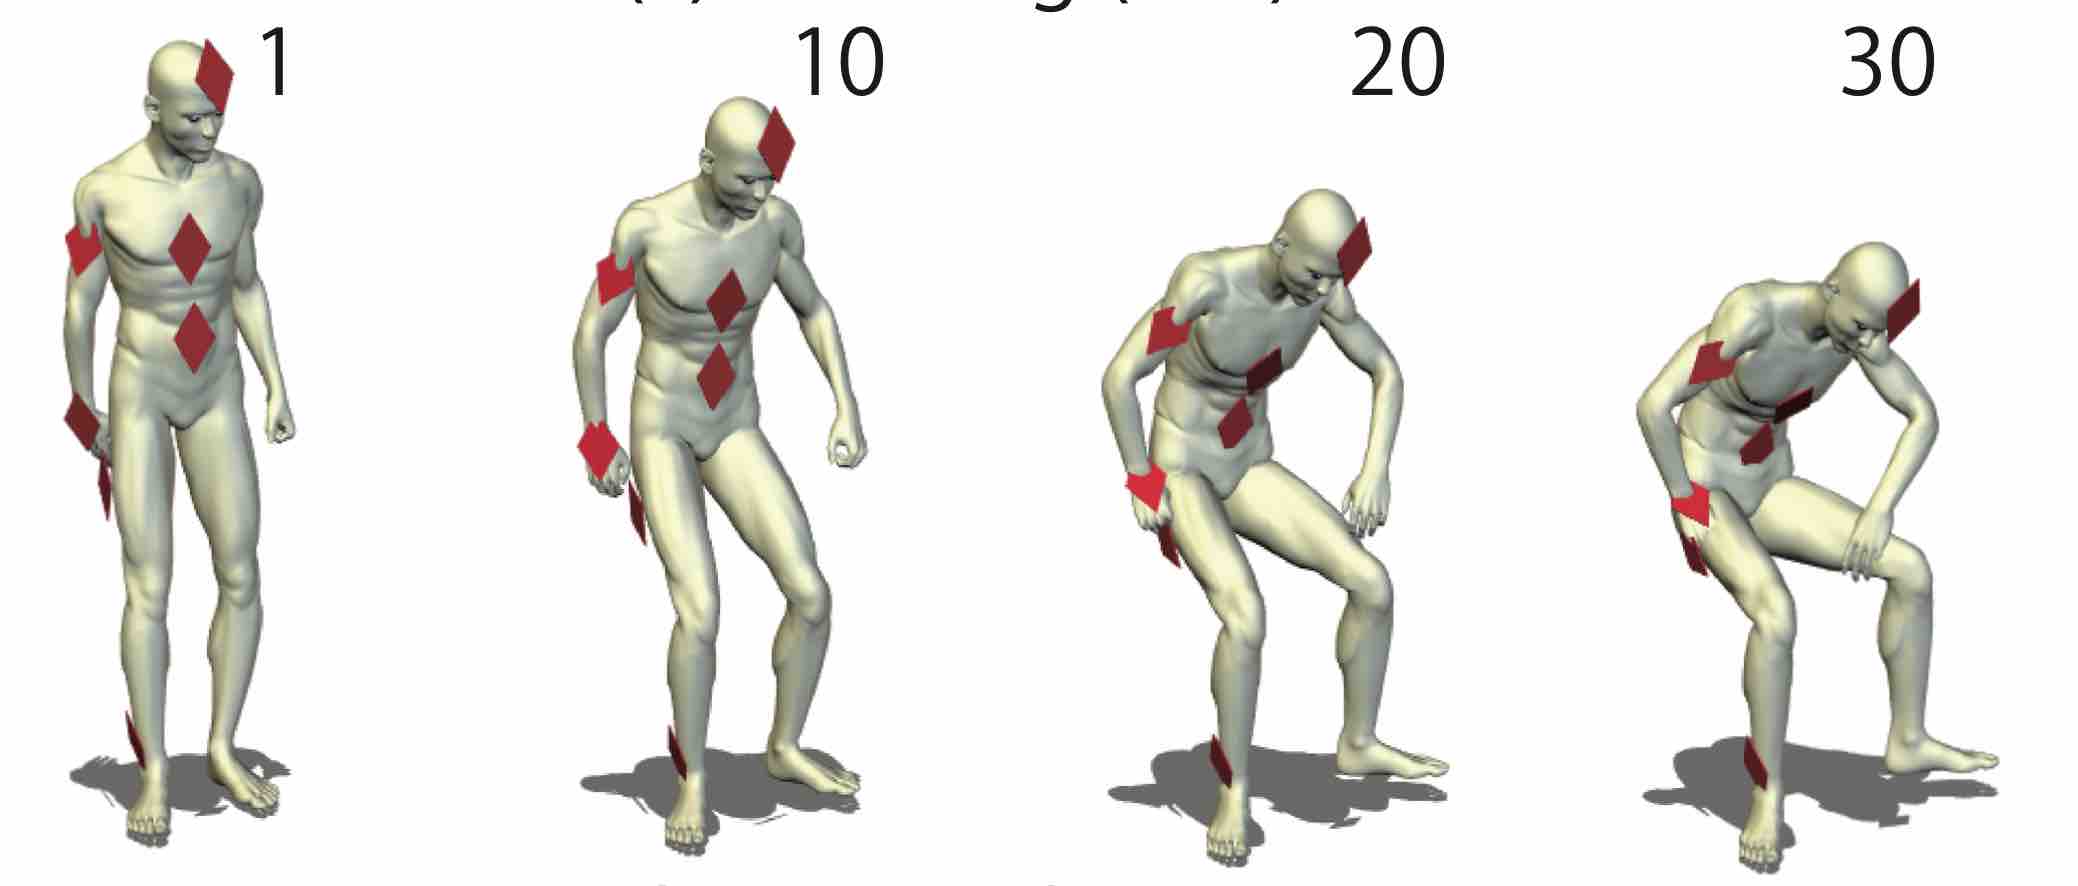
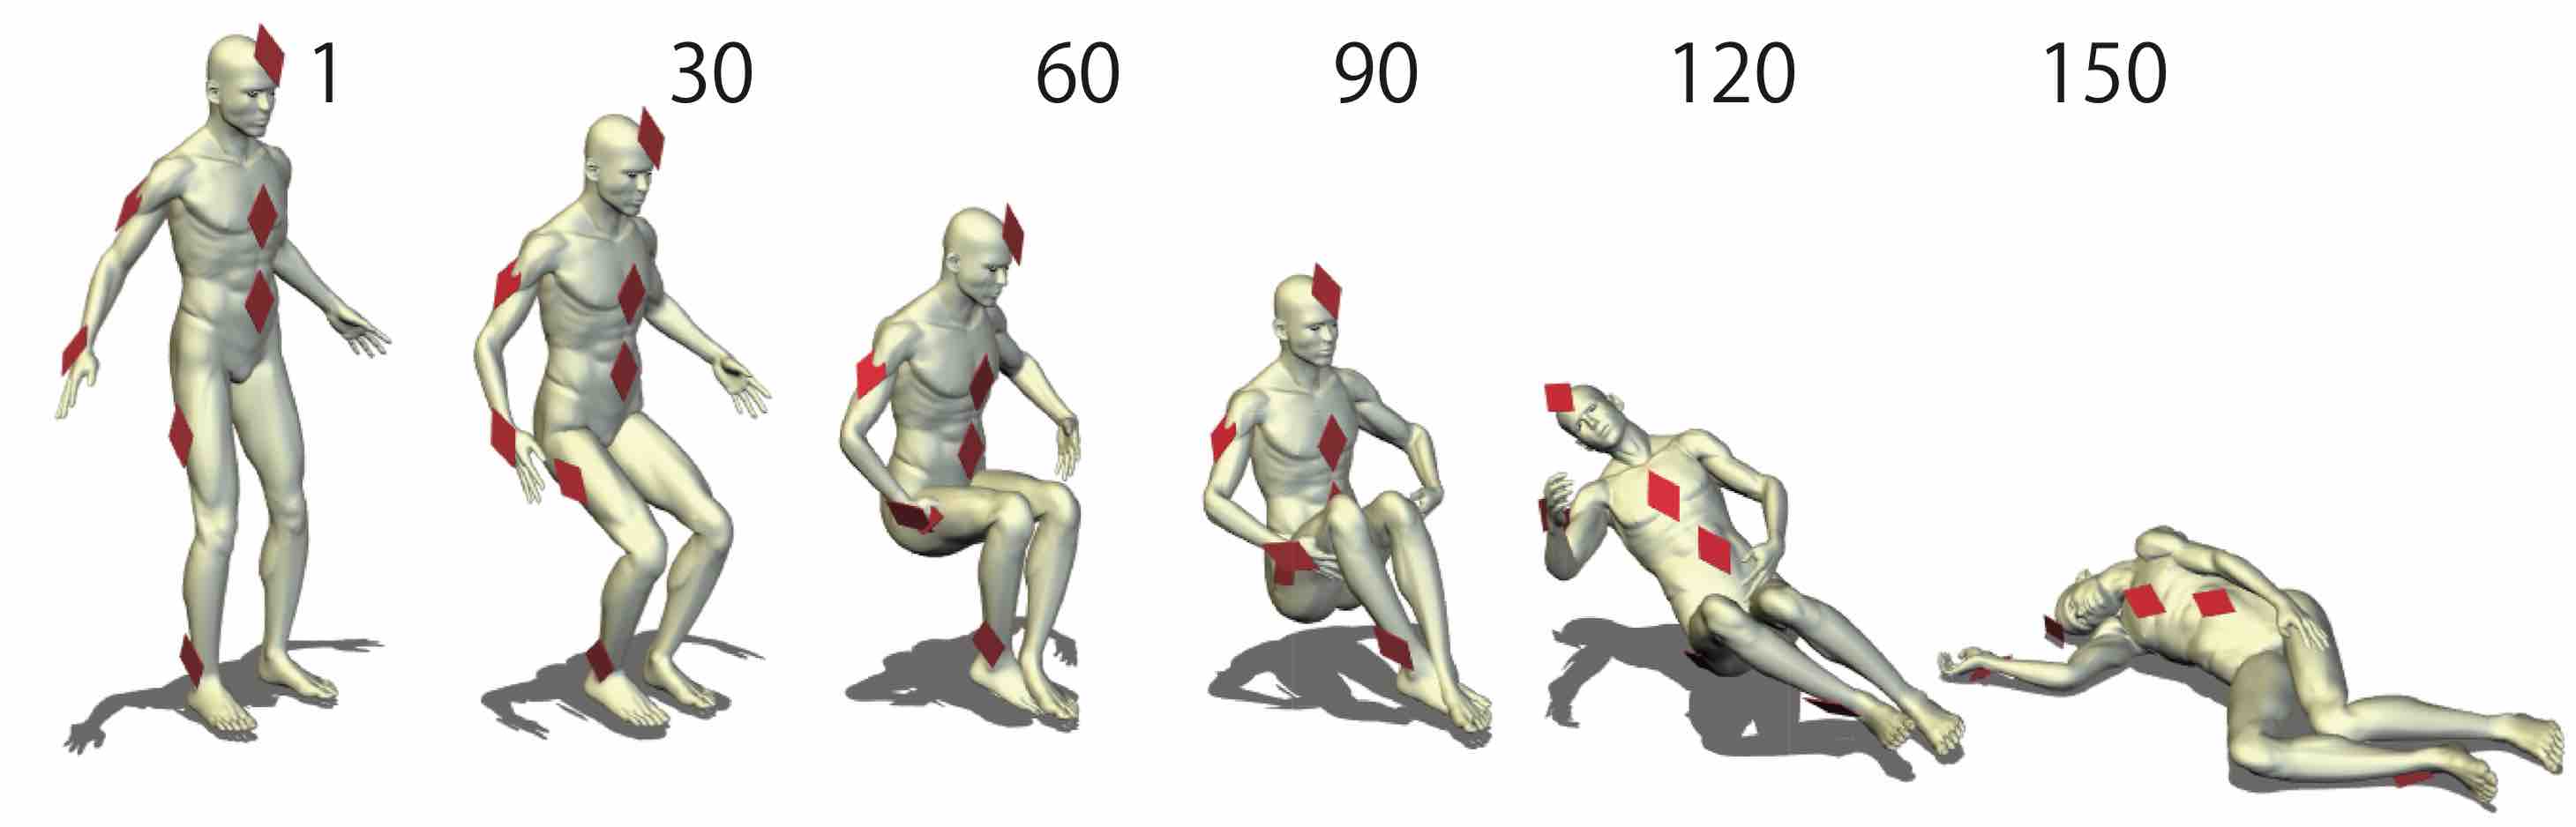
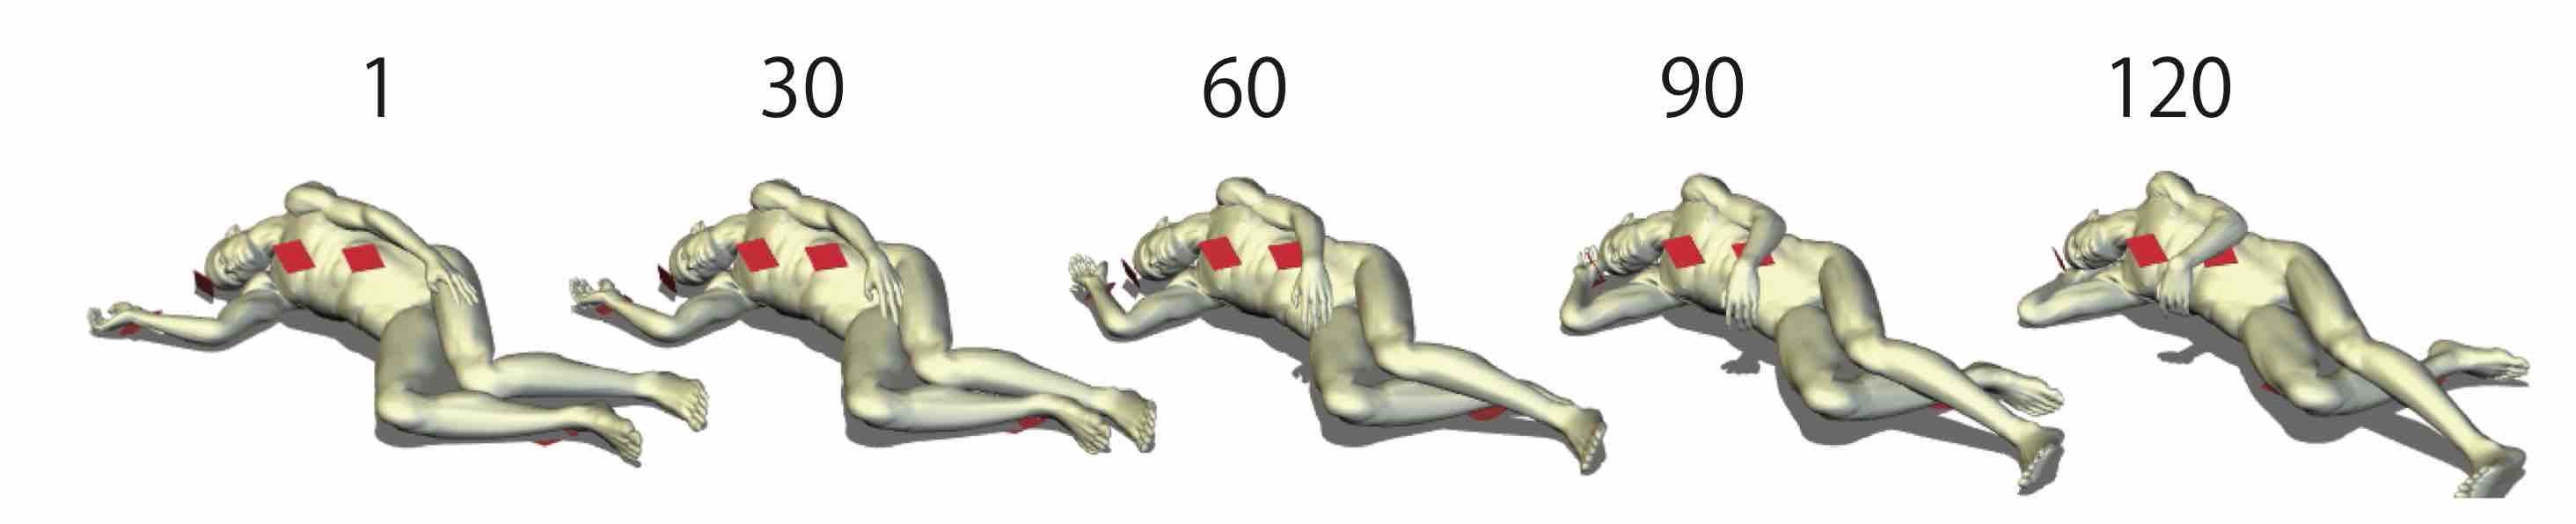
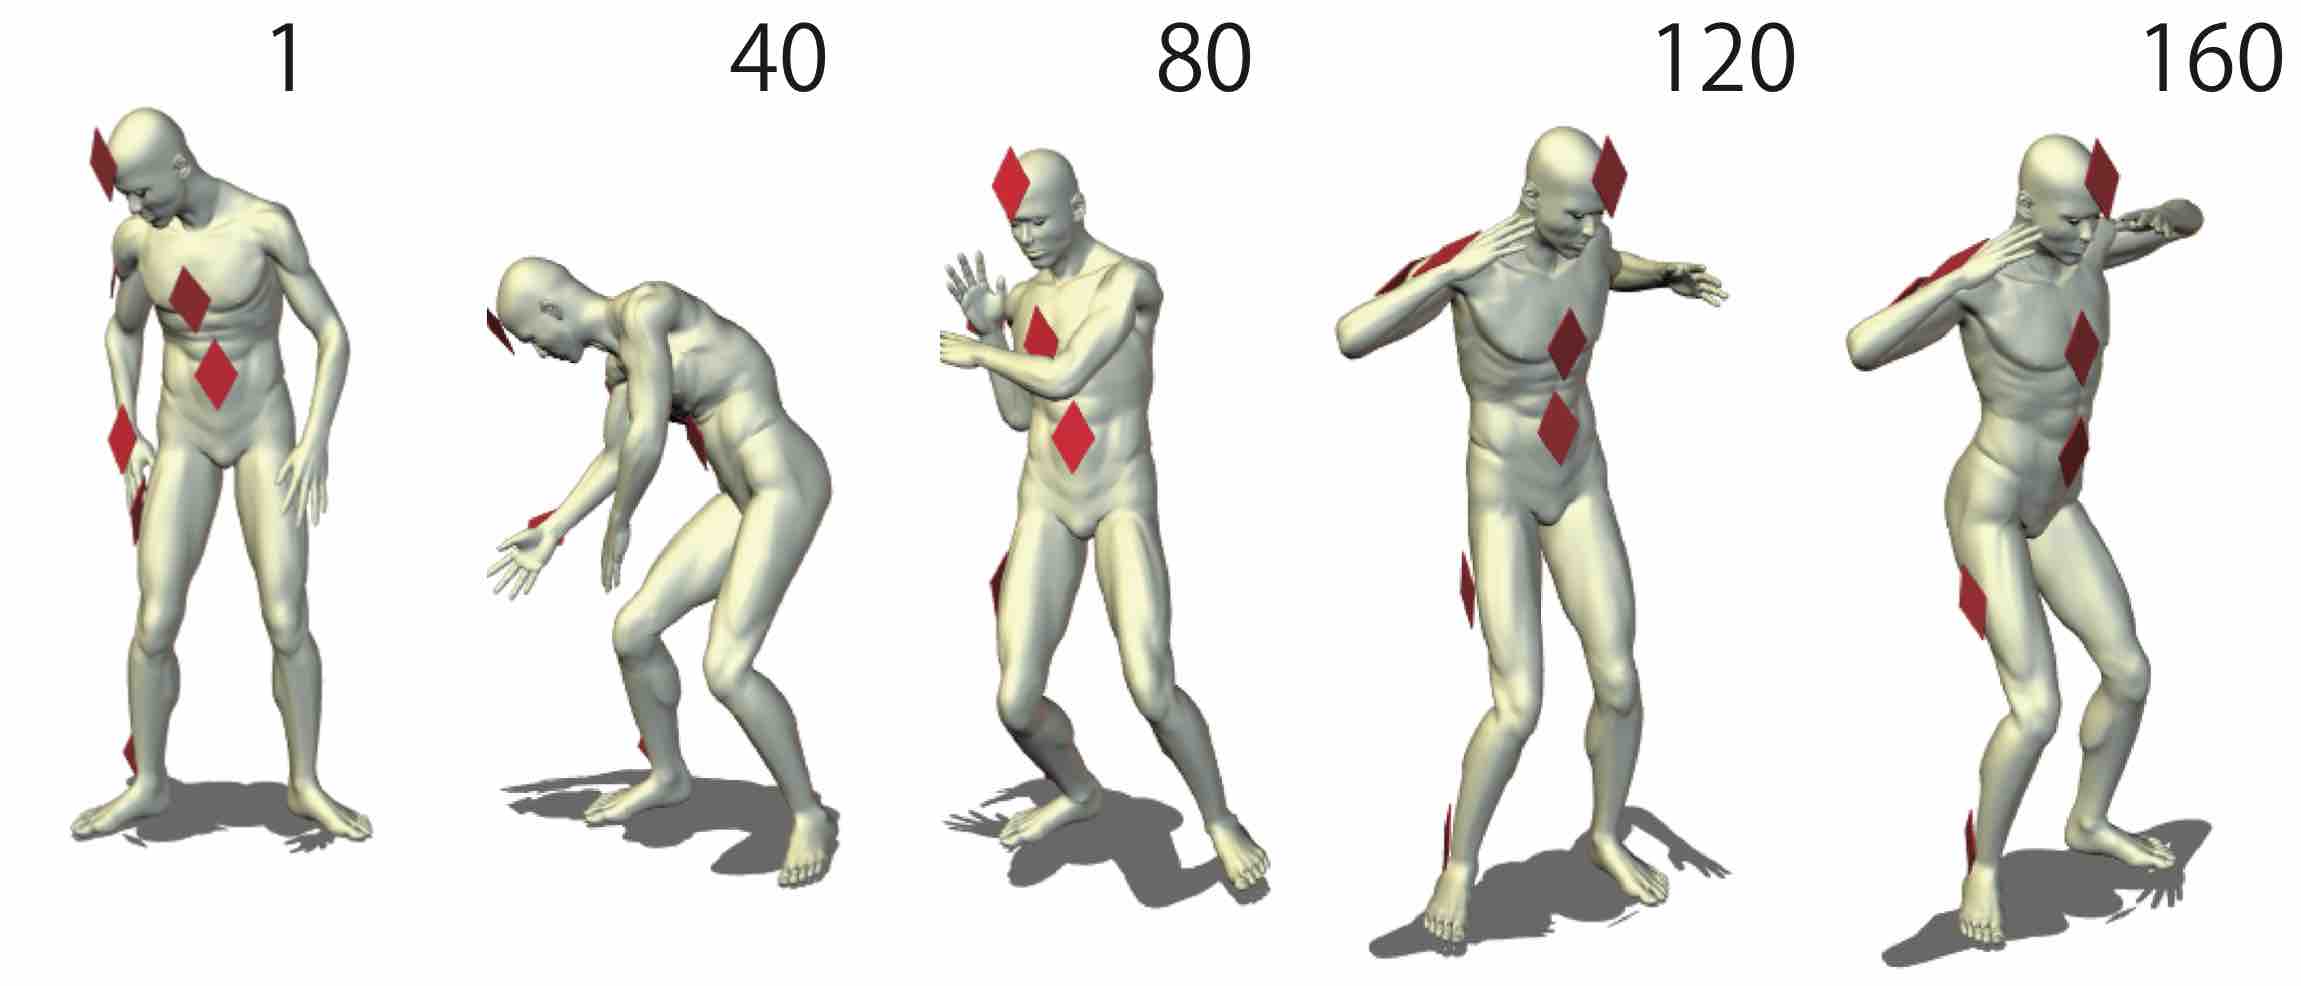
We implemented the realistic channel model in (i. Naganawa et al., 2015) over the physical layer implementation provided by the Mixim framework (Köpke et al., 2008). This channel model of an on-body channel between nodes, that belong to the same WBAN, using small directional antennas modeled as if they were away from the body. Nodes are assumed to be attached to the human body on the head (2), chest (1), upper arm (3), wrist (6), navel (0), thigh (5), and ankle (4).
Nodes positions are calculated in postures: walking (walk), walking weakly (weak), running (run), sitting down (sit), wearing a jacket (wear), sleeping (sleep), and lying down (lie). These postures are represented on Fig. 1. Walk, weak, and run are variations of walking motions. Sit and lie are variations of up-and-down movement. Wear and sleep are relatively irregular postures and movements.
Channel attenuations are calculated between each couple of nodes for each of these positions as the average attenuation (in dB) and the standard deviation (in dBm). The model takes into account: the shadowing, reflection, diffraction, and scattering by body parts.
4. CLPB: New Cross Layer Broadcast Protocol
In this section, we introduce our new cross layer broadcast protocol CLPB. CLPB is a slotted protocol that builds on top of pruned communication graphs constructed based of the channel model (i. Naganawa et al., 2015) . CLPB handles both the control medium access and the broadcast process. In oder to include the channel model specificities in the broadcast process CLPB needs a preprocessing phase that is handled at the Sink level. After this preprocessing phase, Sink broadcast packets that will carry both data and control information (e.g. slots assignment, synchronization information).
4.1. Preprocessing
The aim of preprocessing is to identify for each posture and for each node, one or more reliable paths from Sink to . This phase is executed only by the Sink before starting the broadcast process.
First, Sink computes, based on the mean and standard deviation of each link in (i. Naganawa et al., 2015), the Cumulative Distribution Function (CDF) of the random attenuation : where is a threshold. represents the maximum acceptable attenuation referring to the transmission power and reception sensibility . Thereby, is equal ( - ())= and represents the probability of a successful transmission. Then Sink defines a pruned communication graph. Nodes in this graph are the nodes in the network, the edges correspond to the links with transmission probability greater than .
Figure 2 shows the 7 pruned communication graphs, one per posture, obtained by applying the procedure described above. Note that at the end of the preprocessing the obtained communication graphs are not necessary trees. In the following we will denote these communication graphs where is the number of the corresponding posture.
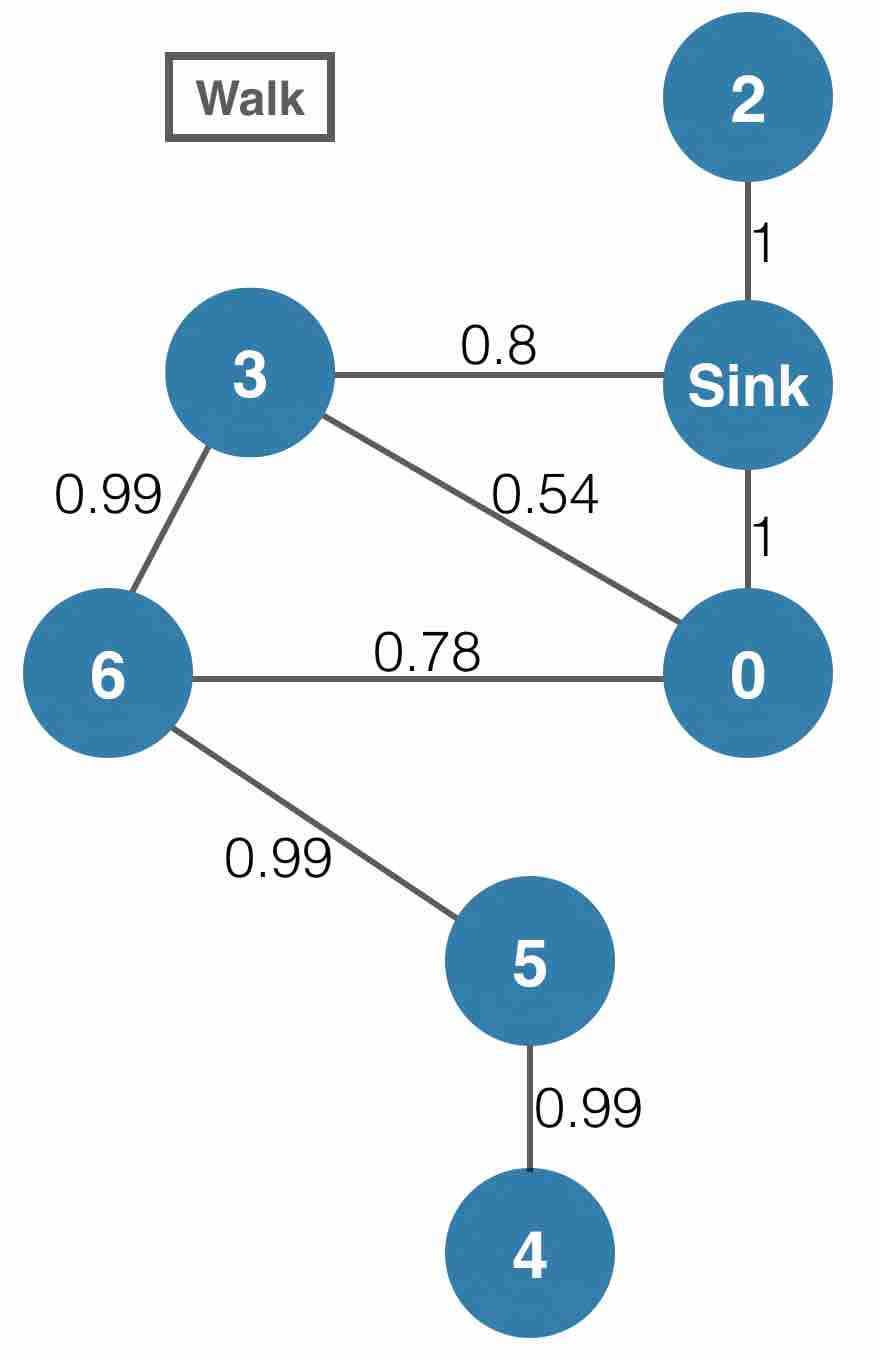
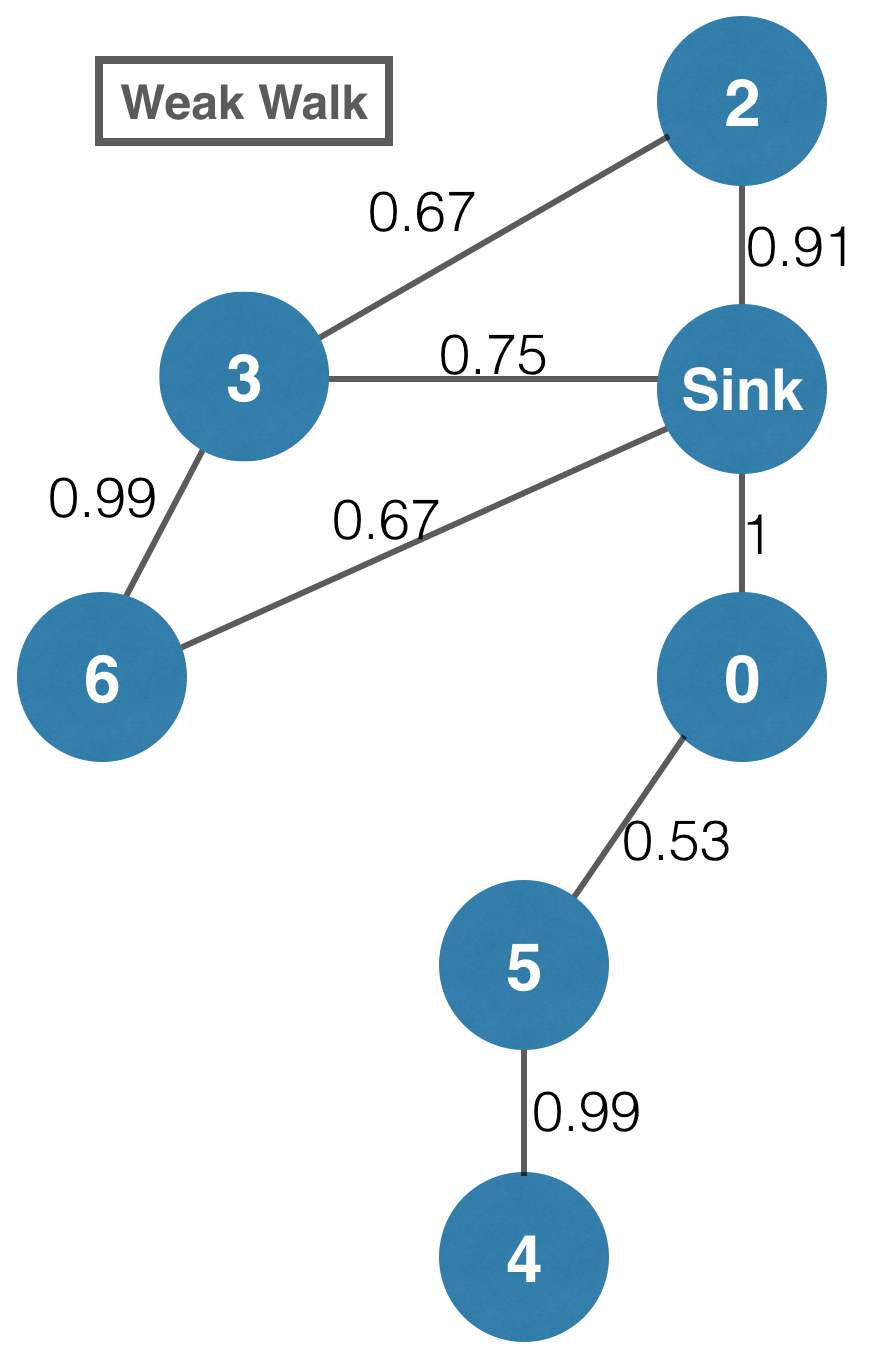
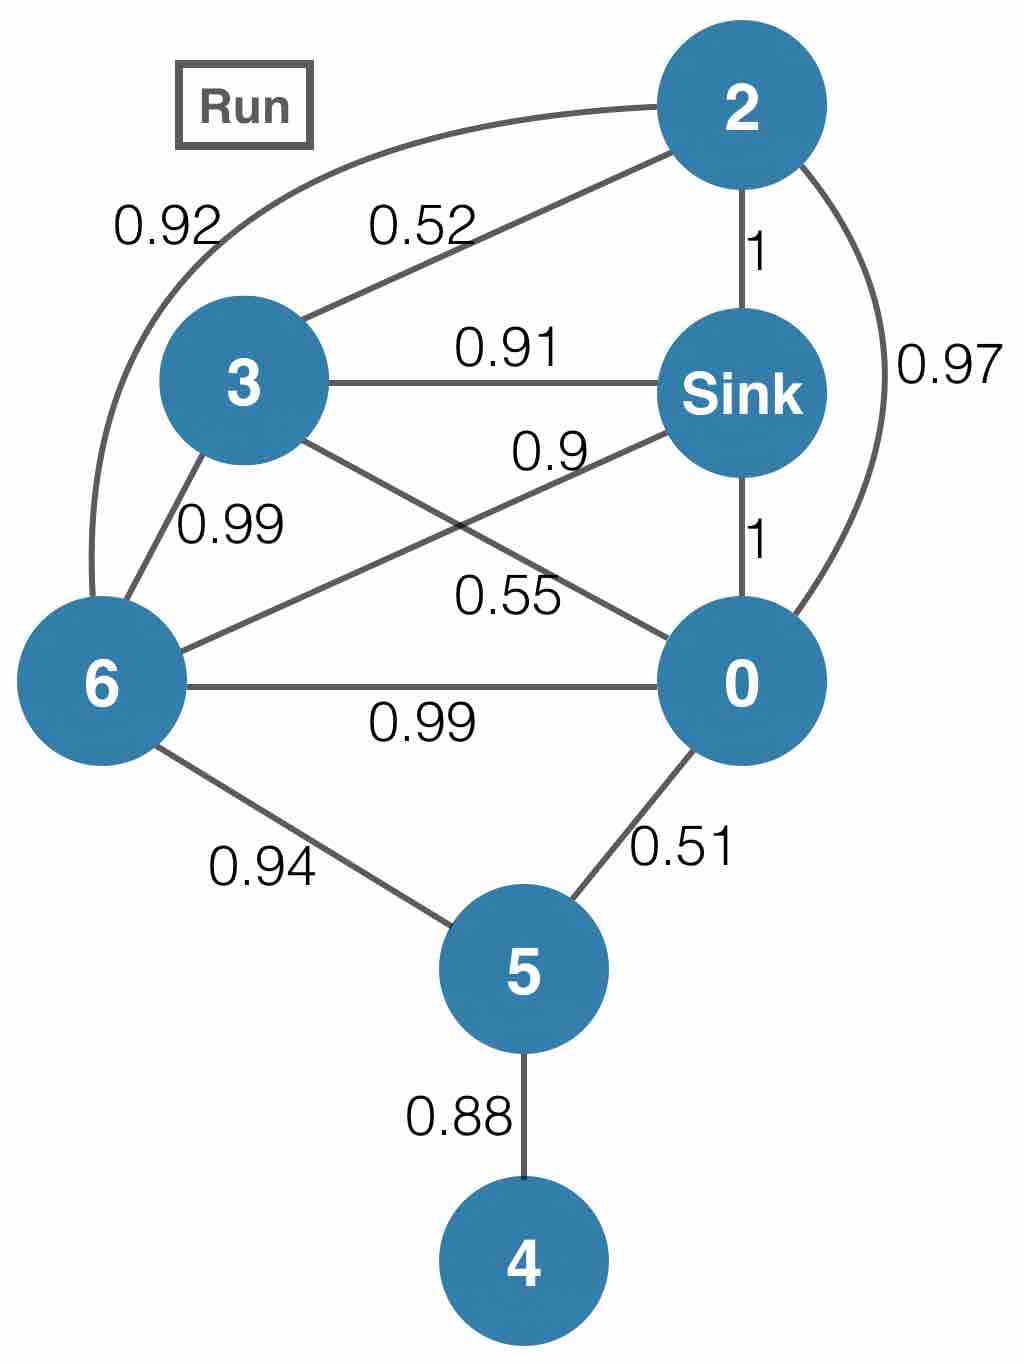
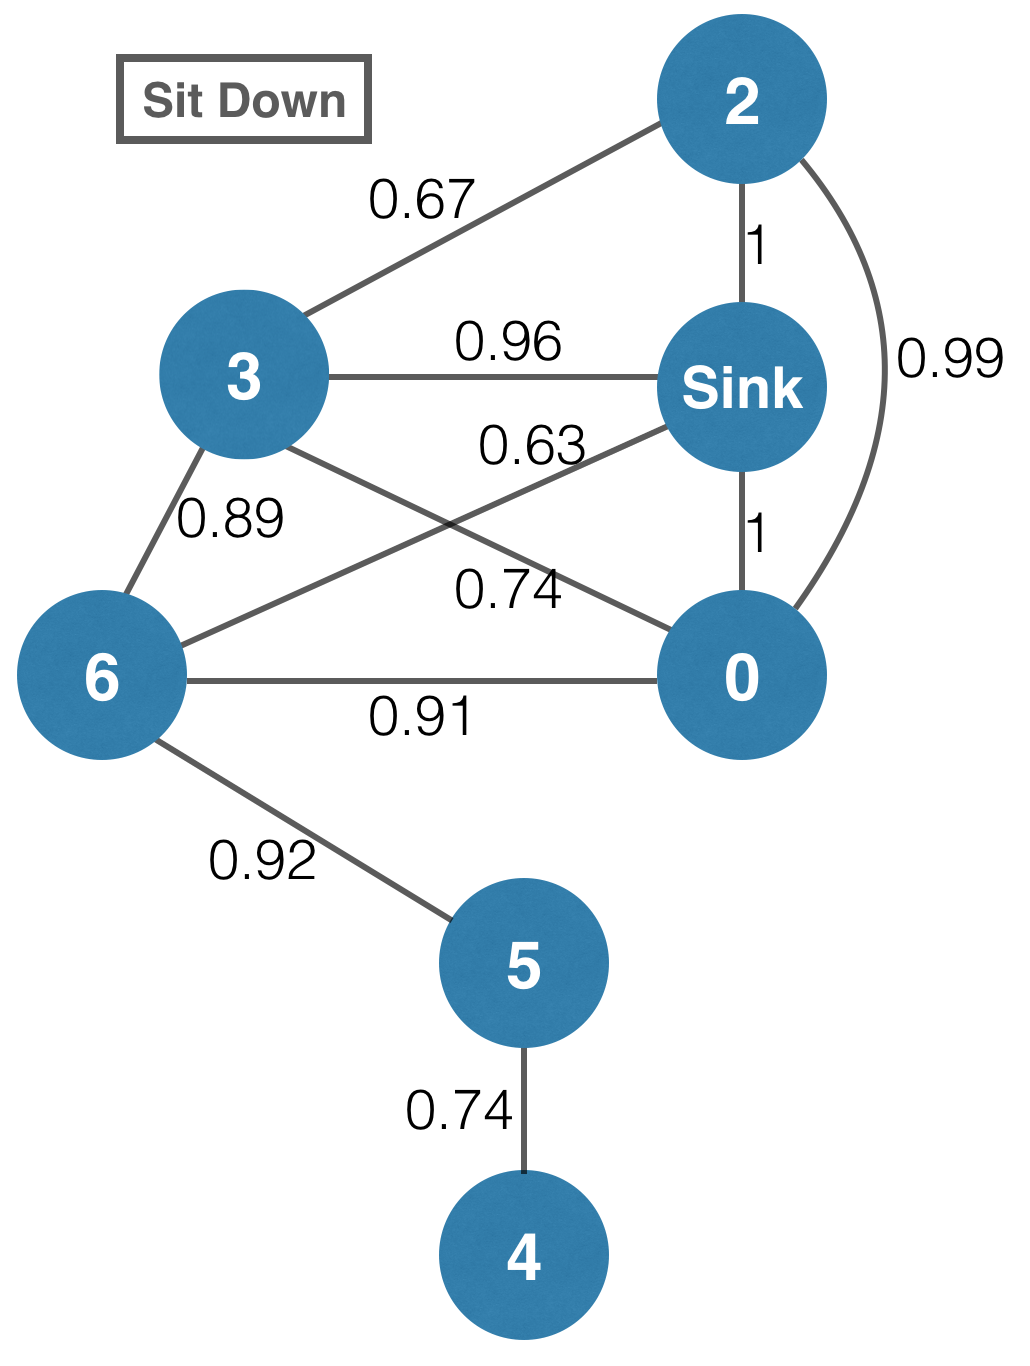
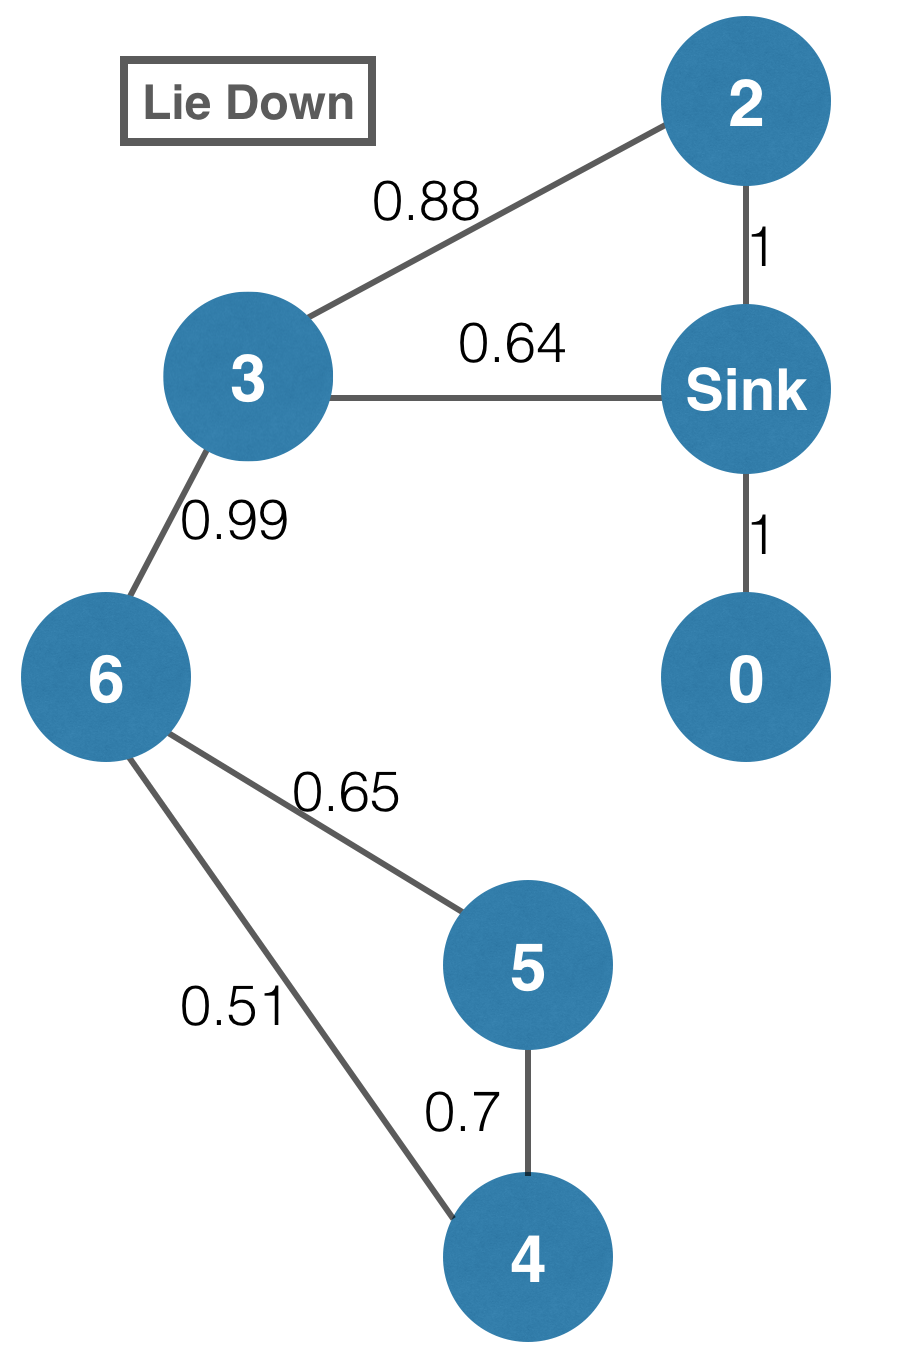
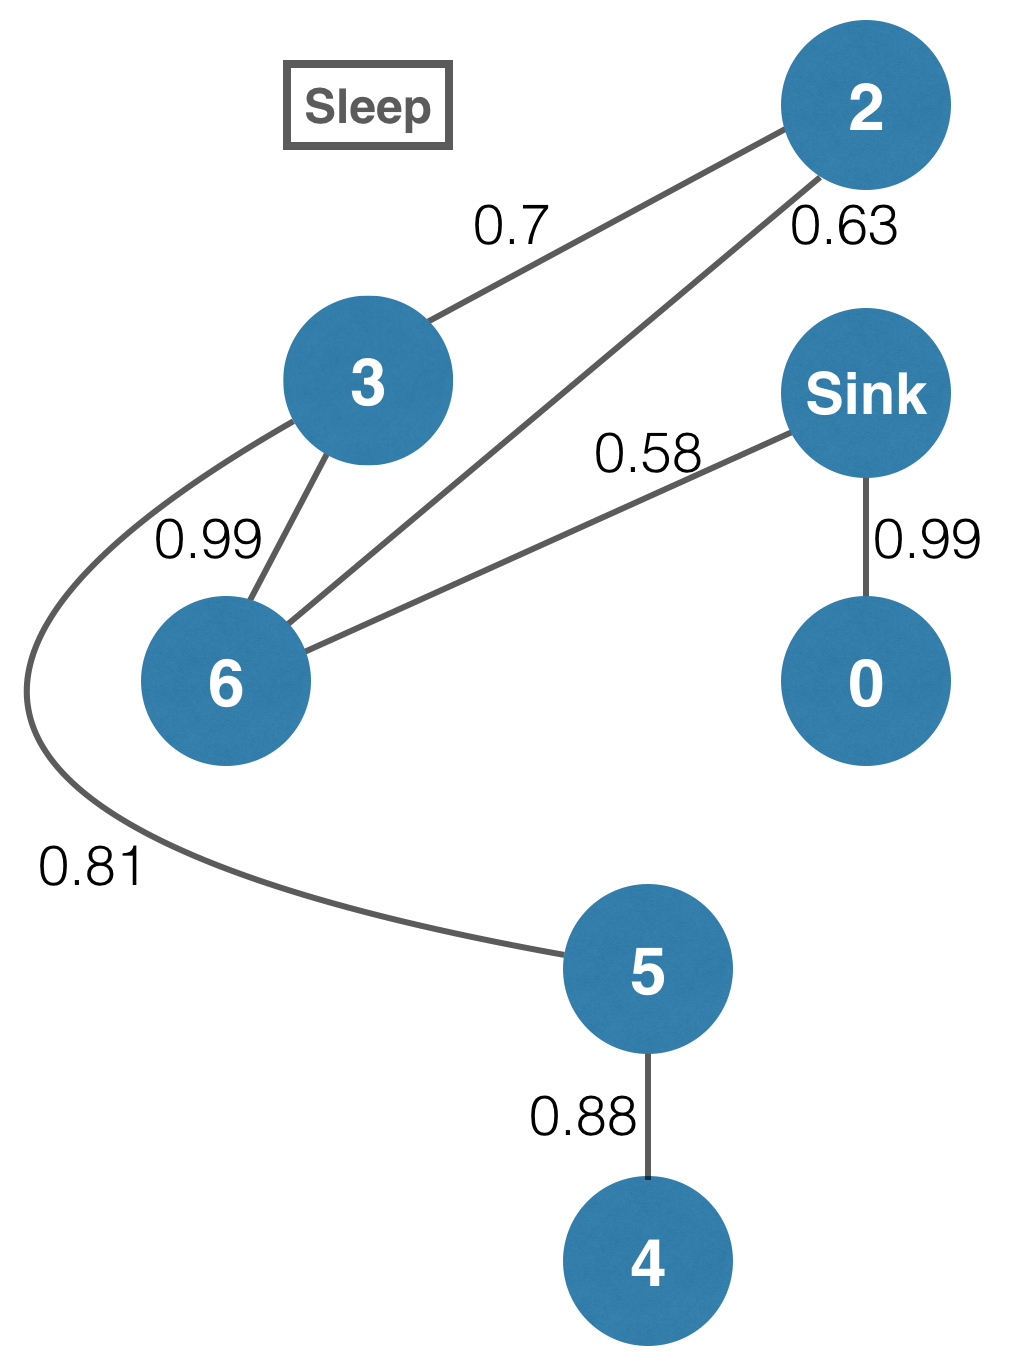
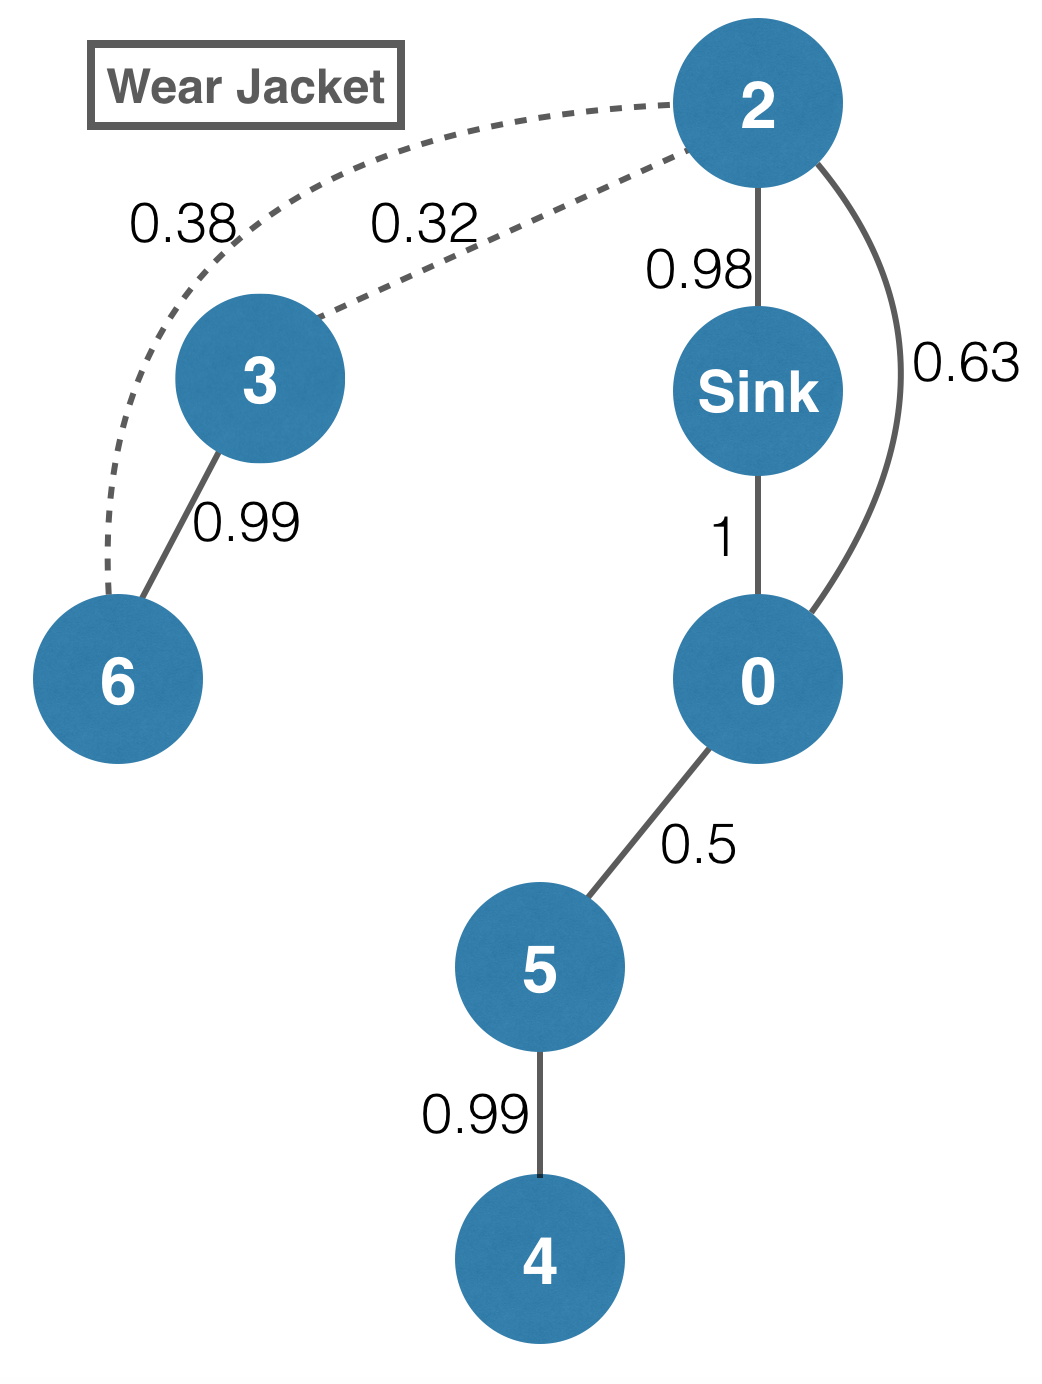
Then, Sink selects a set of senders for each posture. For each node, , in the communication graph , Sink computes the paths between Sink and with maximal reliability. The set of nodes on these paths are included in the senders set for the graph . In Figure 2, for the communication graph corresponding to the walk posture, the senders set contains nodes .
4.2. Protocol Overview
Sink assigns transmission slots to the senders outputed by the preprocessing phase (see Section 4.1). The broadcasted packets will carry both data and control information (e.g. slots assignment, synchronization information). A node is allowed to forward previously received packets only if it is a sender and the current slot was assigned to it.
Finally, Sink broadcasts packets that include data and a medium access and synchronization scheme. Note that with our protocol, no control packets exchange is needed.
Our protocol assumes that nodes execute in synchronized time-slots. Furthermore, it is assumed that the boundaries of slots are also synchronized.
4.3. Medium access and Synchronization scheme
The time is divided at the Sink level in cycles. A cycle corresponds to a sequence of time slots equal to the number of senders, in other words, equal to the number of nodes allowed to transmit including Sink node. Cycle duration is given by the following equation eq.1:
| (1) |
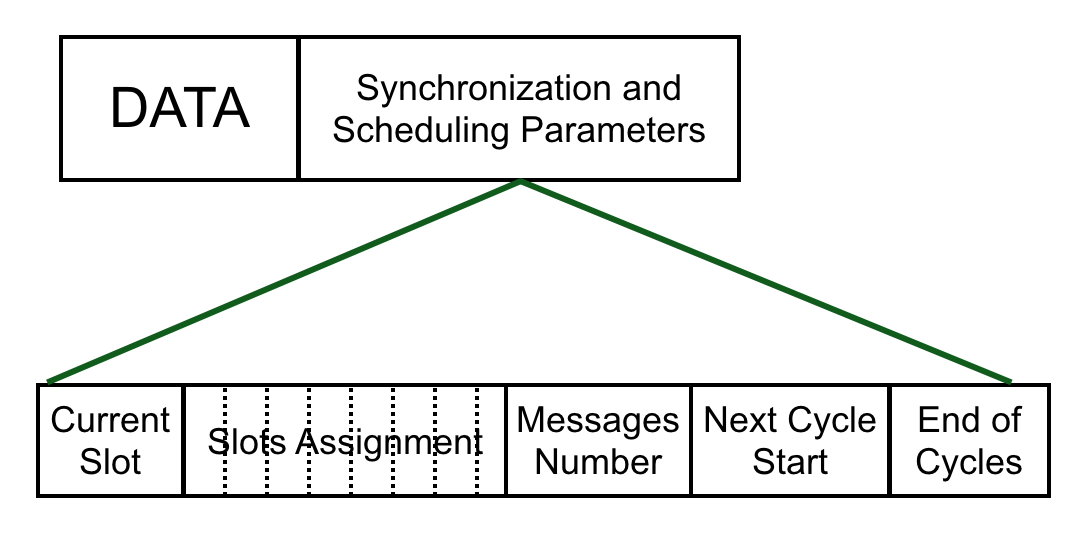
Nodes synchronize with the sink via the scheduling and synchronization scheme described in details in the sequel. That is, each received packet is considered as a reference for the current time slot. A sender includes in packets it forwards its slot number called current slot and the next cycle start in a way that at the reception of this data packet, nodes can position the current time with respect to the current slot and to the next cycle.
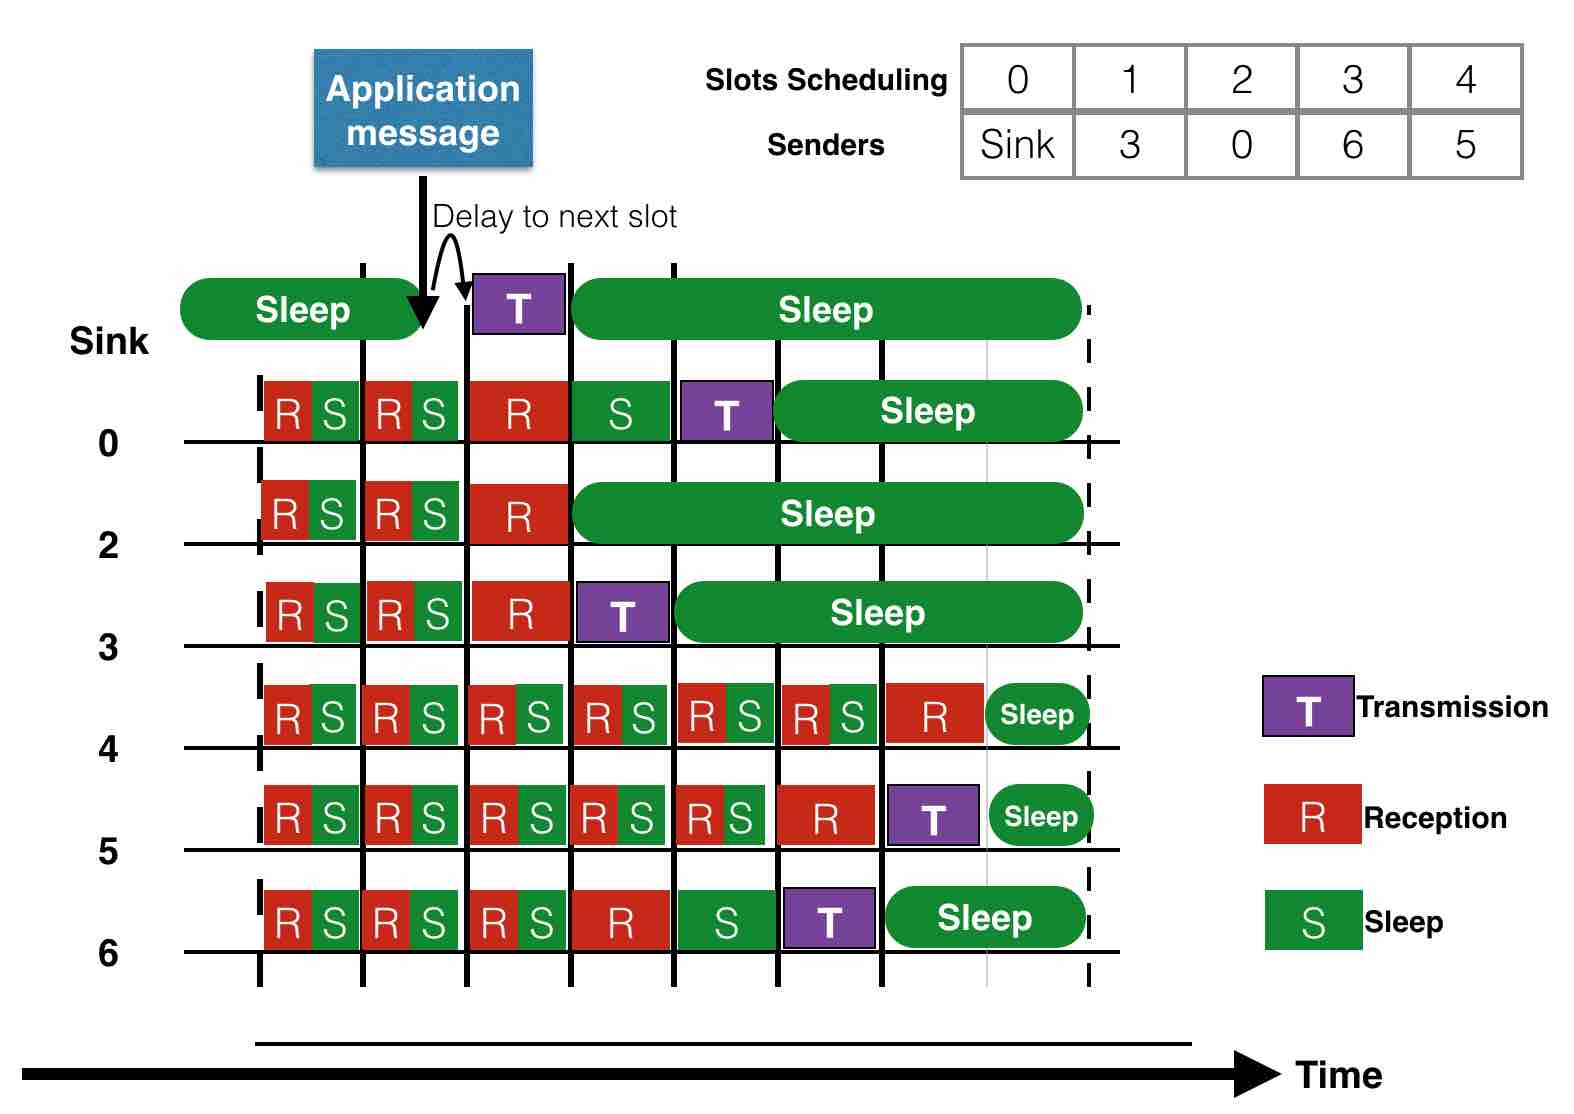
Figure 3 presents the synchronization and scheduling parameters.
-
(1)
Current slot: is a reference slot that allows nodes to position in time with respect to the current cycle. For example in Figure 5, Sink node sends the packet with a current slot equal to its time slot equal to . Suppose, node misses packet reception from Sink node while node receives it correctly. After that, node broadcasts the packet with a current slot equal to its time slot (i.e. ). Node receives the packet, it checks slot scheduling, it is a sender but its time slot (equal to ) is less than the current time slot (equal to ) so it will not broadcast the packet at this cycle and it will schedule the transmission next cycle to avoid collisions.
-
(2)
Slots Assignment: assigns to each sender its time slot. Slot number is always assigned to Sink. Based on example Figure 5, node sends at time slot then node at time slot , while nodes and are not designated as senders.
-
(3)
Messages Number: represents the total number of packets to be send by Sink node and that should be received by all nodes.
-
(4)
Next Cycle Start: Depends on the transmission frequency of Sink node. This frequency allows to compute the time between two consecutive cycles: the CyclesInterleave parameter presented below and so to determine Next Cycle Start. If the transmission frequency is such that Sink node receives an application packet while previous packet is still in broadcast in the network (the current cycle is not finished), then cycles interleave is nul. As shown in the example a) in Figure 4, Sink node receives an application packet every time slots, which is less than a cycle duration ( time slots). In this case, Sink node puts packets in its buffer and waits the end of the current cycle. Then, it immediately starts a new cycle. If Sink node receives an application packet much later. For example, as shown in the example b) in Figure 4, Sink node receives an application packet every time slots, which is greater than a cycle duration ( time slots). In this case, nodes enter in a sleep mode waiting for the next cycle.
(5) 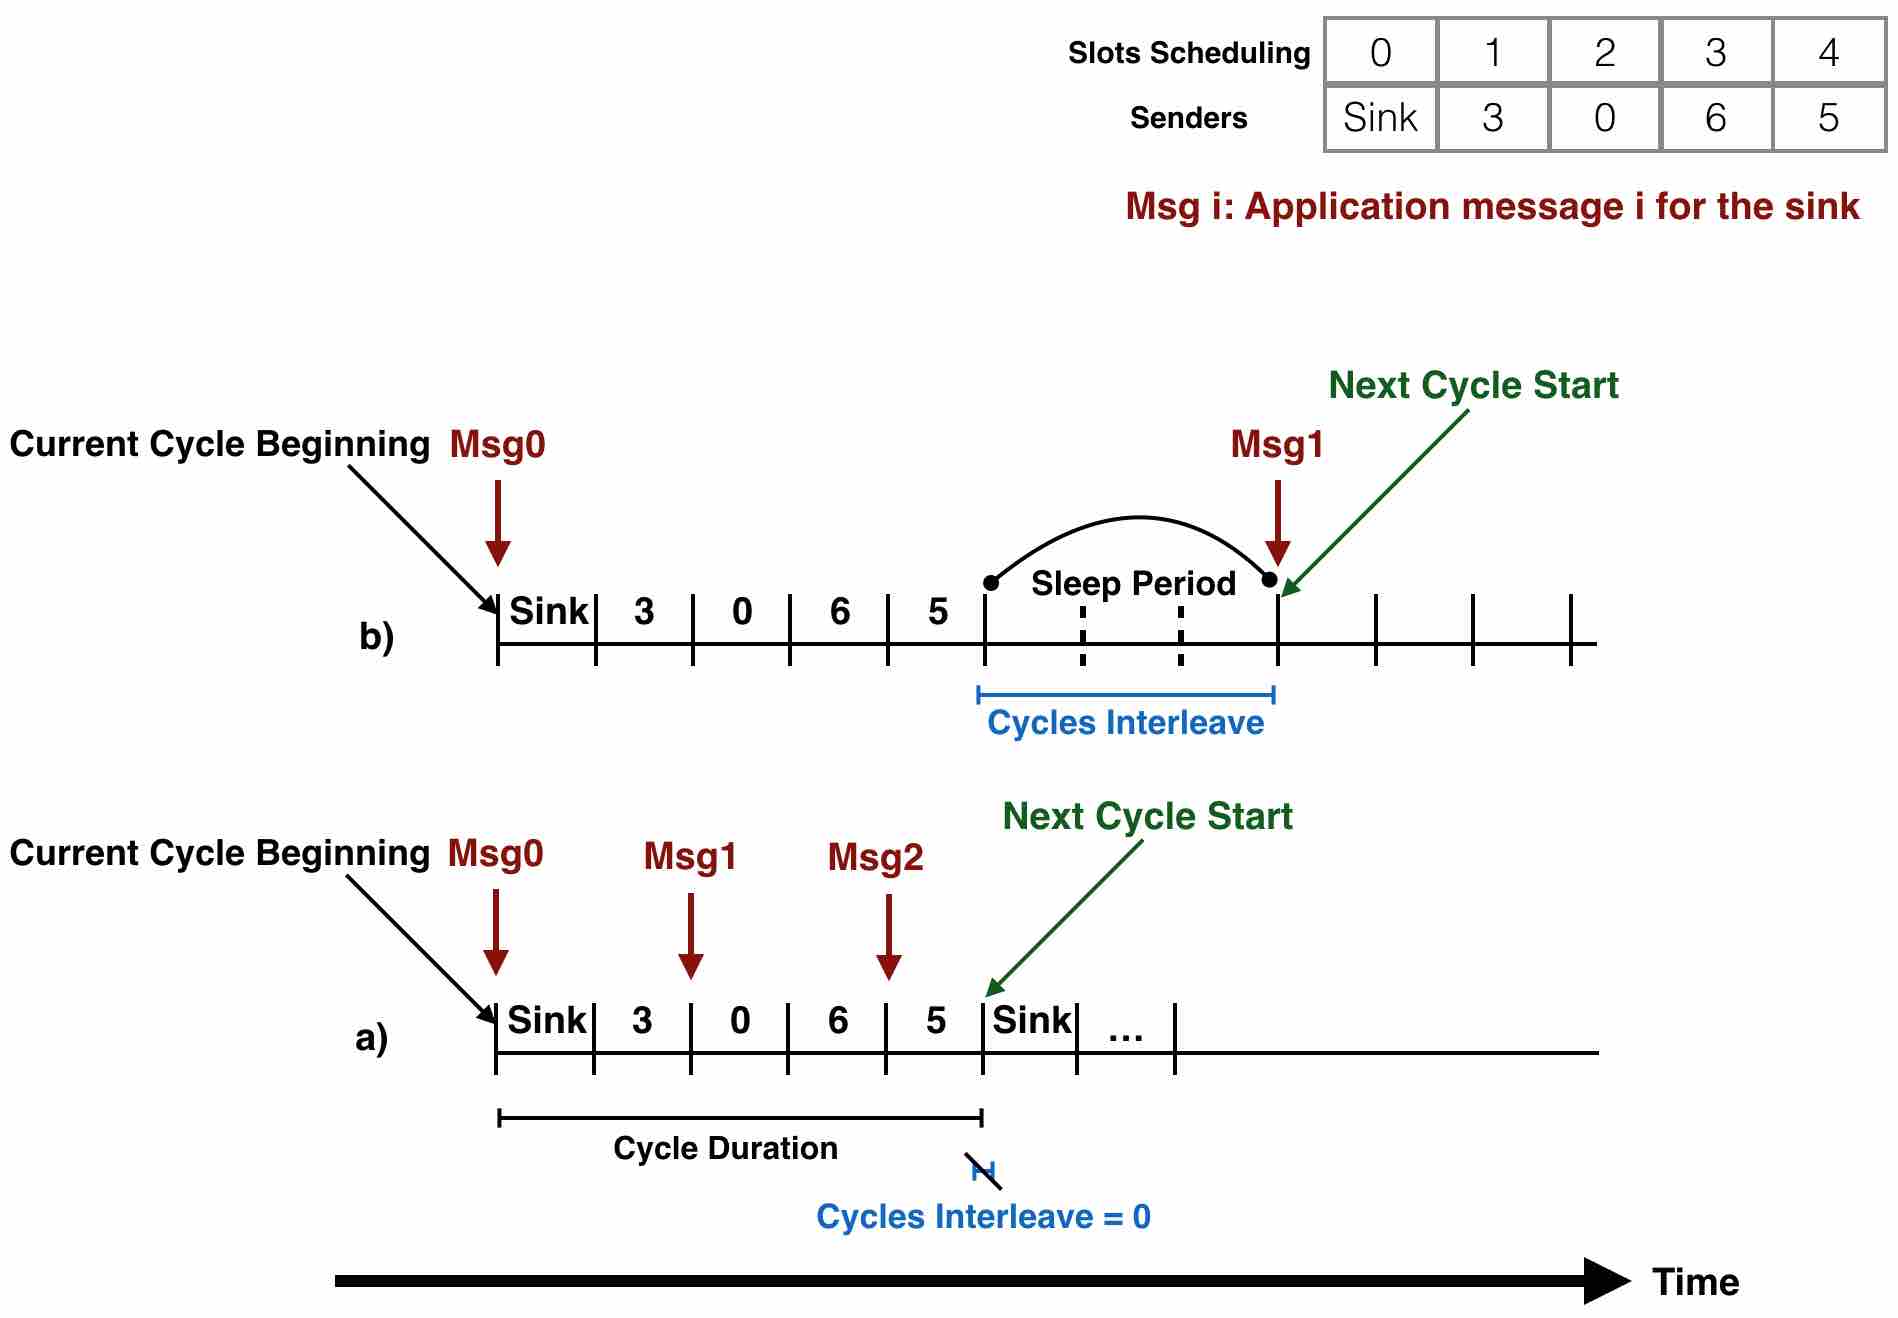
Figure 4. Cycles Interleave: Both cases Next Cycle Start is a key parameter that optimizes nodes duty cycle. In fact, instead of alternating between reception and sleep mode each time slot, nodes will go back to sleep and schedule wake up when more packets are available in the network.
-
(5)
End of Cycles indicates to nodes when to sleep definitely. In fact, nodes keep waking up each cycle until receiving all data packets. However, in case of packet loss due to unreliable links for example, nodes will keep waiting for lost packets and continue to wake up each time slot. In order to optimize nodes energy consumption, Sink node will compute based on traffic parameter an estimation for time needed to send all packets. Then, if a node reaches the estimated time and is still missing some packets, it will be able to detect this loss and decide to sleep definitely.
To avoid that nodes miss data packet, it is important to over estimate End of Cycles parameter by supposing the worst case given by the Equation 6 below.
(6)
4.4. Protocol Details Description
Upon reception of an application packet Sink schedules the broadcast of the packet plus the medium access control scheme information (see Section 4.3) at the next time slot.
Each sender node wakes up on each slot on reception mode, RX, for a period of time equal to a half time slot. During this period, there are two possible cases:
-
•
no packet is received: Node goes back to sleep mode and wakes up (on reception mode RX) next time slot.
-
•
a packet is received:
-
–
if it is allowed to transmit (based on time slots schedule), then it schedules a transmission.
-
–
if more packets are expected (based on sink transmission frequency) then it computes the next cycle and goes back to sleep at the end of the current cycle. Otherwise, it sleeps definitely.
-
–
When a node wakes up on its assigned time slot to transmit previously received data, it transmits until the end of its slot. After this point, it delays the remaining packets to be broadcasted in the next cycle.
Nodes alternate between: Reception, Sleep and Transmission modes. However, differently from other similar techniques, we strive to reduce the number of state switches and the duty cycle duration. As shown in Figure 5 for example, after receiving a packet, nodes and sleep waiting their turn to broadcast based on the scheduling scheme. Also, node sleeps after broadcasting the packet. Leaf nodes (in this example: nodes and ) sleep after receiving all packets while sender nodes sleep after transmitting all received packets. Note that in this example, we suppose only one packet is broadcasted in the network so nodes sleep after receiving the unique packet. If more than one packet is expected, nodes sleep at the end of the current cycle and wake up the next cycle.
5. Performance analysis
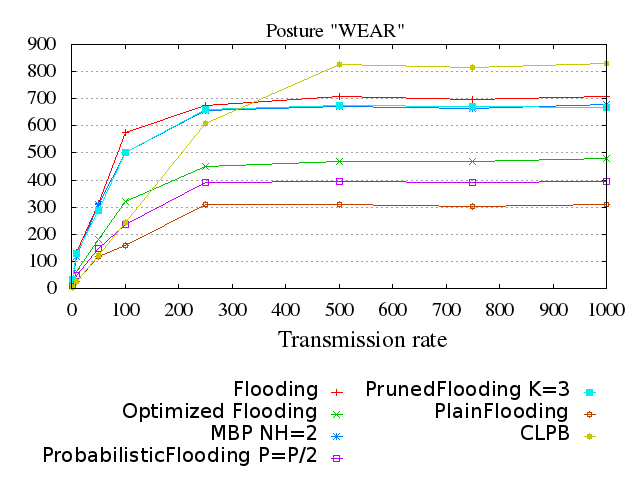
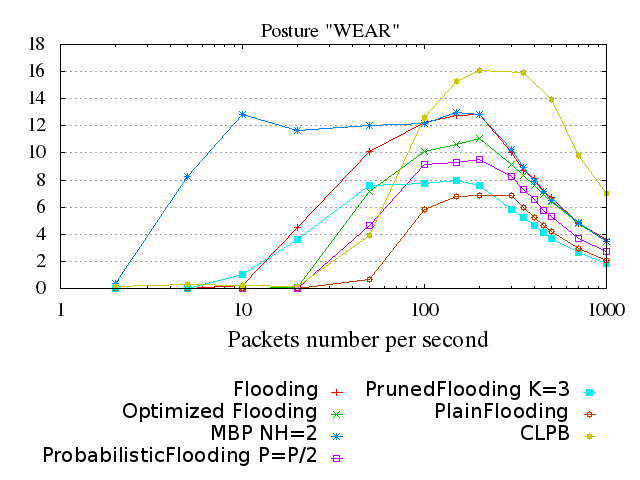
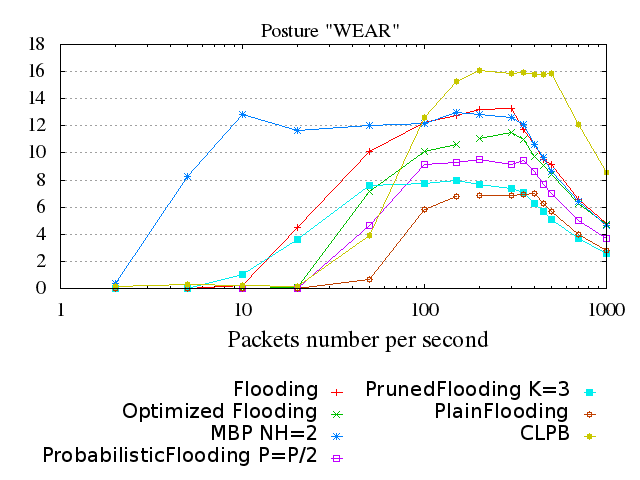
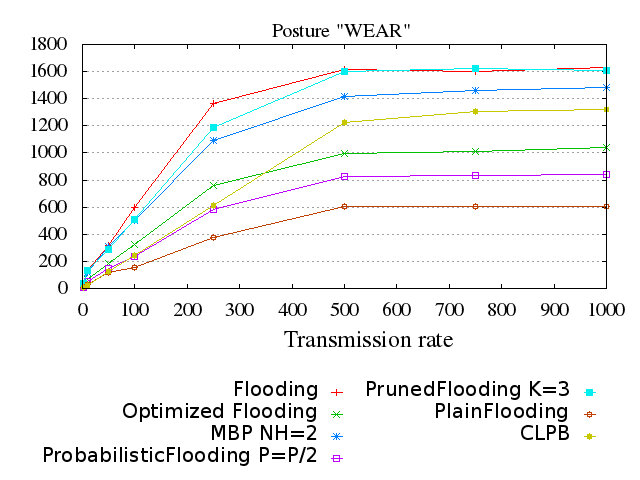
In this section we compare the strategies proposed in (Badreddine et al., 2015) (and its companion technical report (Badreddine et al., 2016)) and our new cross layer protocol face to various broadcast rates up to 1000 packets/s and seven realistic body posture and mobility. We use the discrete event simulator Omnet++ (Omn, ) and the Mixim framework (Köpke et al., 2008) enriched with the channel and mobility model 3. Broadcast strategies investigated in (Badreddine et al., 2015) and its companion technical report (Badreddine et al., 2016) are as follows: Flooding represents the basic broadcast strategies where nodes rebroadcast each received packet; Plain flooding is a more restrictive strategy where nodes rebroadcast each received packet only once; Pruned flooding strategy is based on a random choice of the next hops; Probabilistic flooding (P=P/2) where broadcasting decision depends on a probability . is divided by after every broadcast so that broadcasting is more limited by time; MBP that begins as a basic flooding algorithm (i.e Flooding strategy) then it is conditioned by different parameters. The aim is to limit broadcasting at the center of the network while redirecting it to the peripheral nodes; OptFlood strategy for Optimized Flooding. It is presented as a revised version of Flooding. This strategy targets the good end-to-end delay similar to Flooding while lowering energy consumption by eliminating unnecessary retransmissions.
5.1. Simulation Settings
Above the channel model described in section 3, we used standard protocol implementations provided by the Mixim framework (Köpke et al., 2008). In particular, we used, for the medium access control layer, the IEEE 802.15.4 implementation. The sensitivity levels, header length of the packets and other basic information and parameters are taken from the 802.15.4 standards.
Each data point is the average of simulations run with different seeds. The transmission power is set at the minimum limit level that allows an intermittent communication given the channel attenuation and the receiver sensitivity , guarantees a connected network at each time t of the simulation and ensures a limited energy consumption. Slot duration is equal to with a bitrate equal to .
Our evaluation targets the parameters below:
-
•
Percentage of covered nodes: Since our unique source is the Sink, we therefore calculate the percentage of nodes that have received a packet.
-
•
Percentage of de-sequencing: The percentage of packets received in a different order than the sending order. This parameter is evaluated only in the case of broadcast rates greater than 1.
-
•
End to end delay: The average end-to-end delay is the time a packet takes to reach the destination(i.e. every node except the Sink).
-
•
Energy Consumption: This is a main concern in WBAN. Energy consumption is estimated as the number of transmissions and receptions in the case of single packet broadcast and as average number of transmissions and receptions per node in the case of higher than 1 broadcast rates.
.
Sections 5.2 and 5.4 below present simulation results when strategies are stressed with broadcast rates from 2 to 1000 packets/s and various buffer sizes (e.g. 100, 200, 300 etc) 111Due to lack of space we choose to present the results for buffer sizes 100 and 300.. The goal of studying strategies performance with various transmission rates and different buffer sizes is to highlight the hidden impact of some parameters like MAC buffer size on strategies performances. Our simulation confirm that cross-layer approach offers the best performances. Section 5.5 zoom the case when Sink node broadcasts only packet. The results confirm that even for small rates broadcast the cross-layer approach offers the best performances.
5.2. Broadcast rates up to 1000 packets/s and buffer size 100
We stress CLPB and the flat strategies in (Badreddine et al., 2015) and (Badreddine et al., 2016) with broadcast rates up 1000 packets/s. In all the seven body postures CLPB strategy outperforms the flat strategies. Moreover, the good performances CLPB are maintained for broadcast rates up to 500 packets/s while the strategies in (Badreddine et al., 2015) observe a drop of performances starting with 10 packets/s.
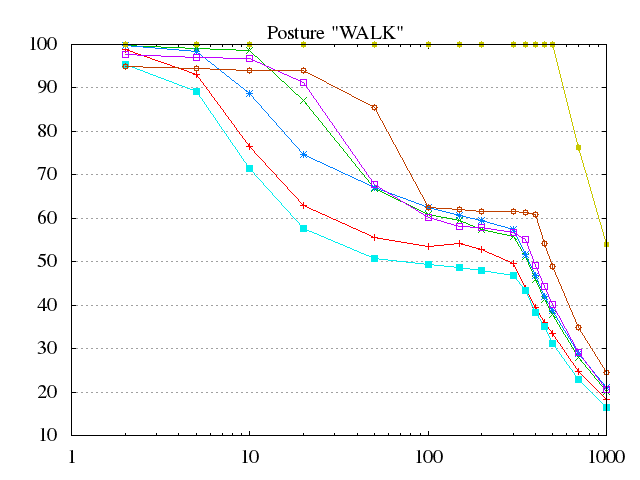
5.2.1. Percentage of covered Nodes
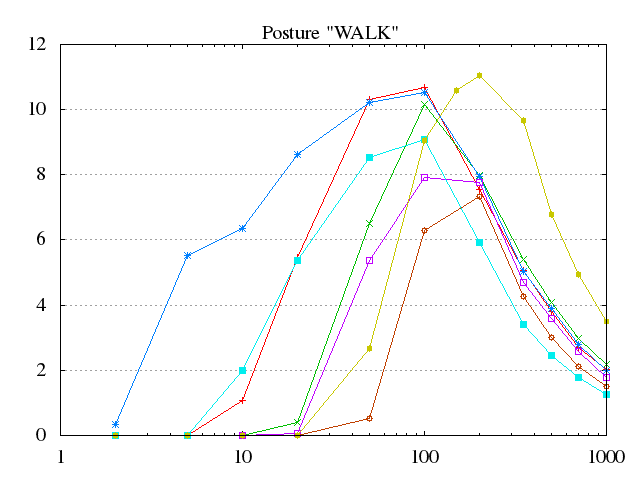
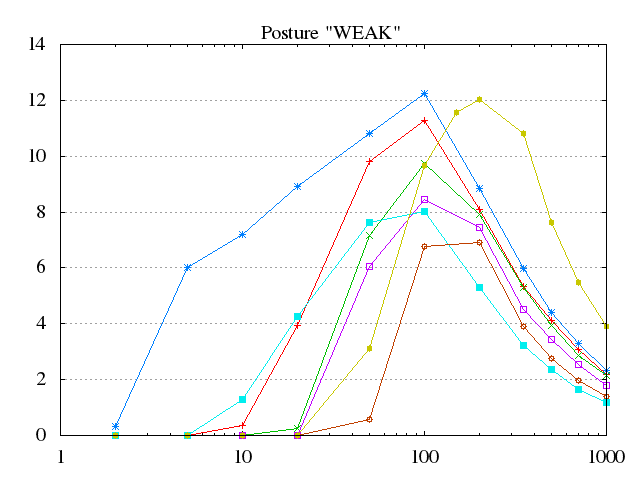
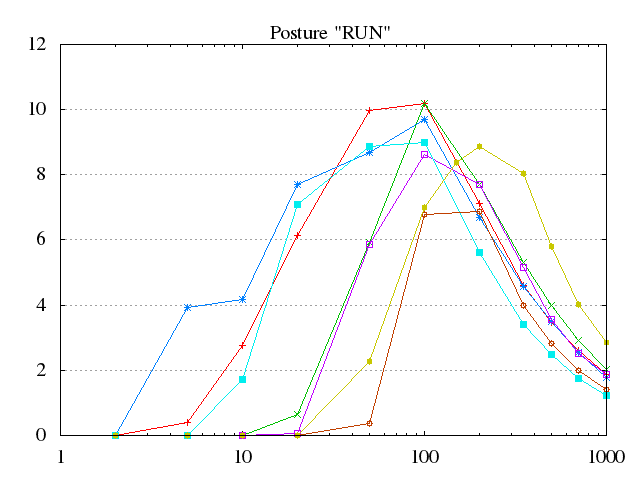
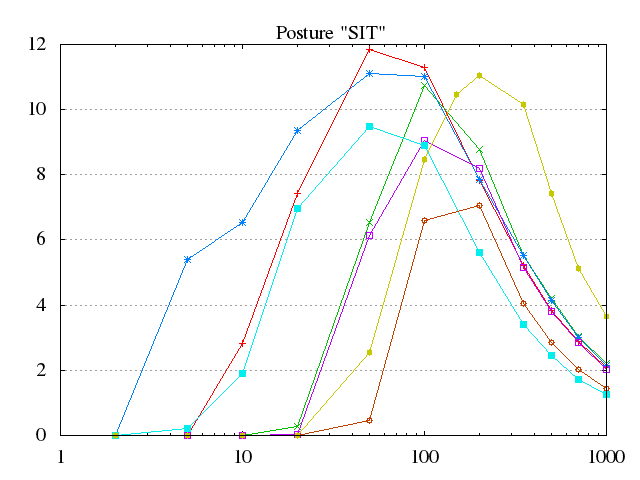
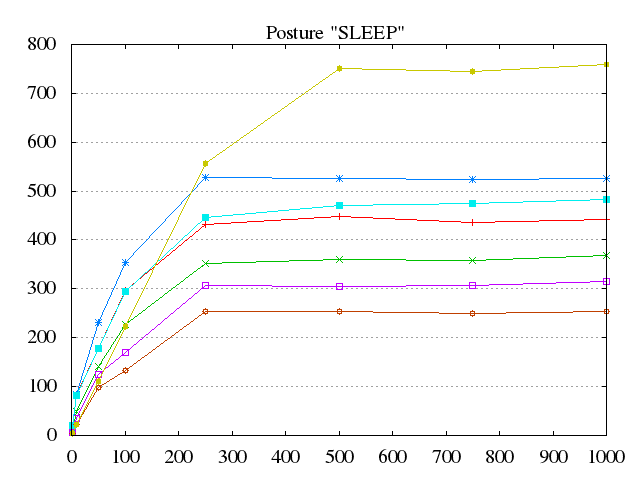
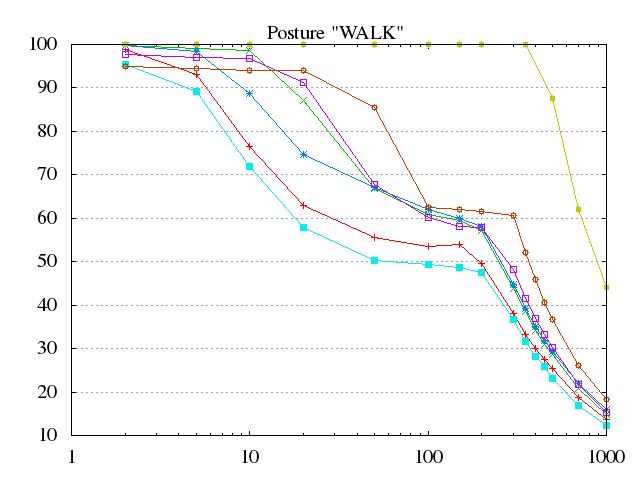
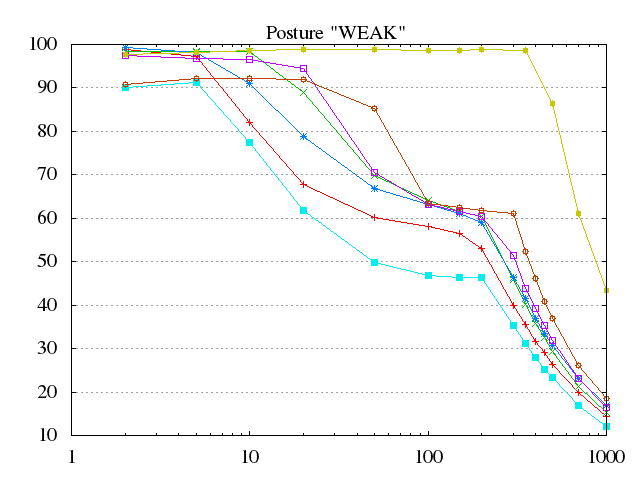
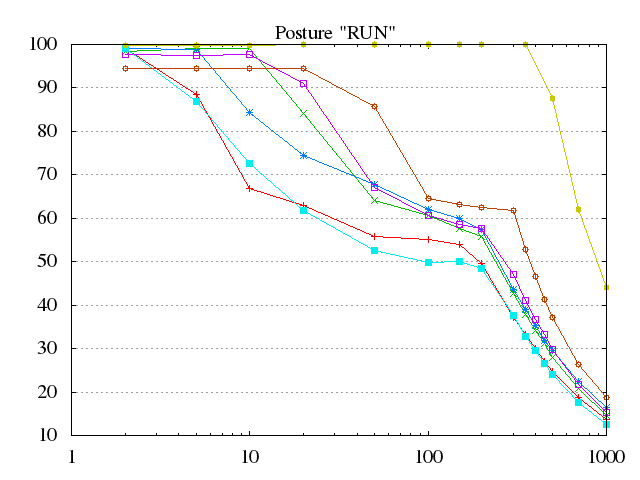
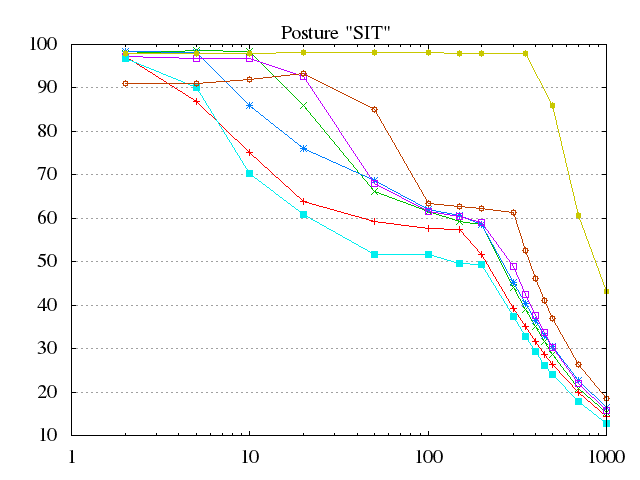
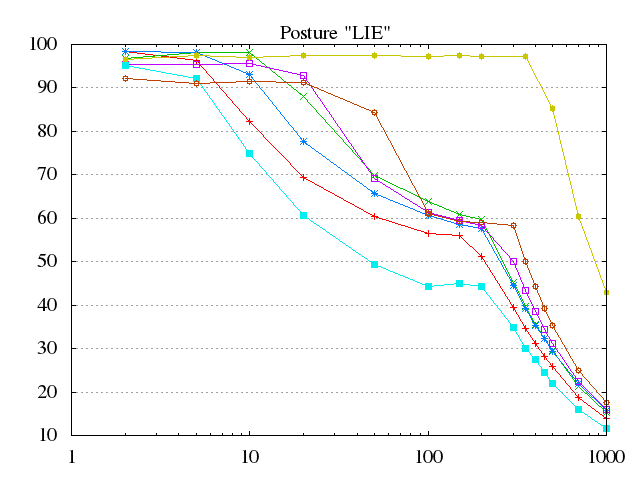
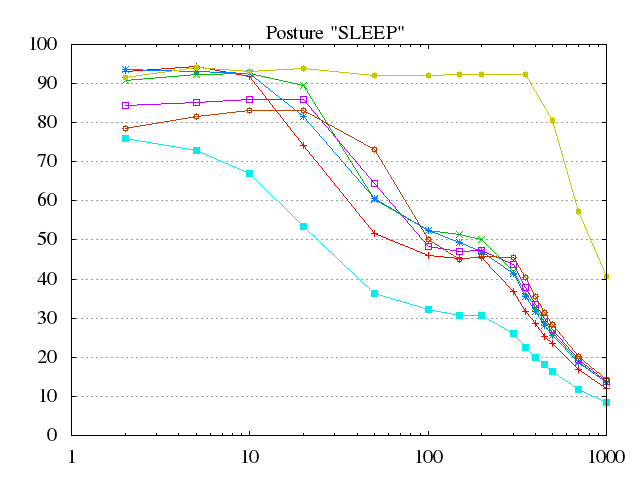
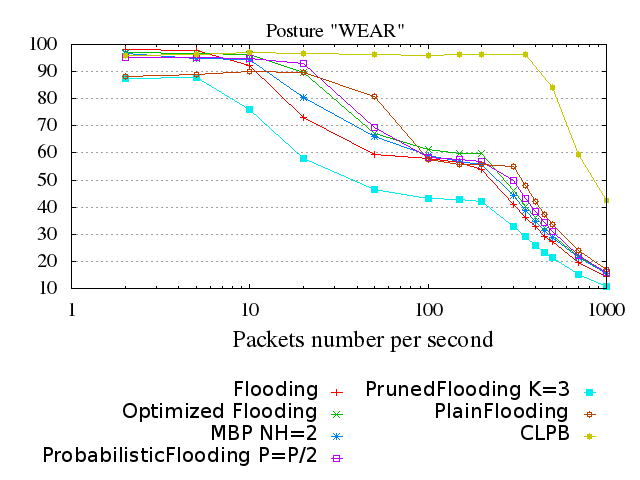
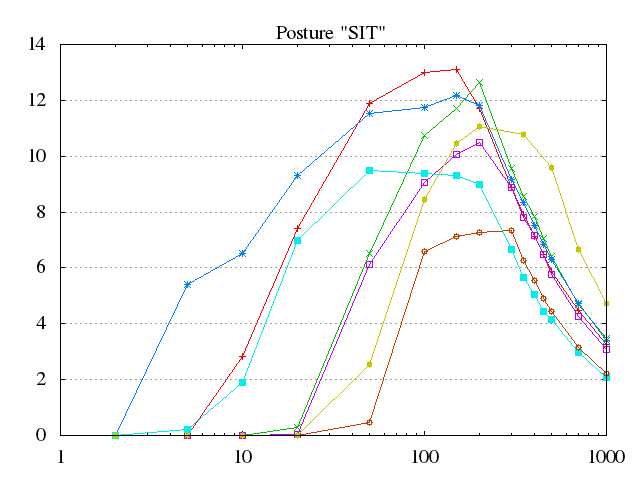
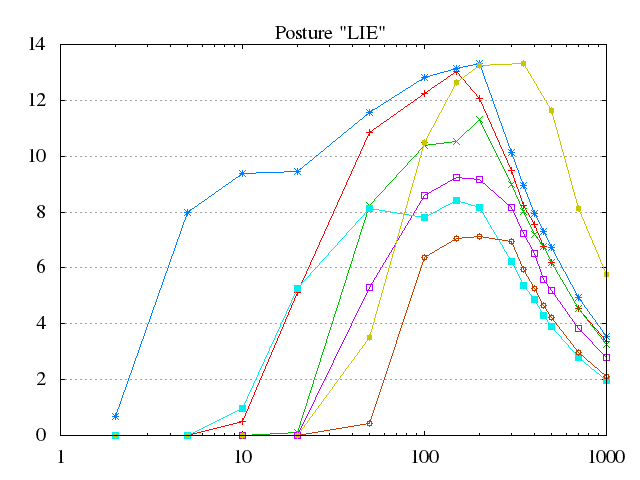
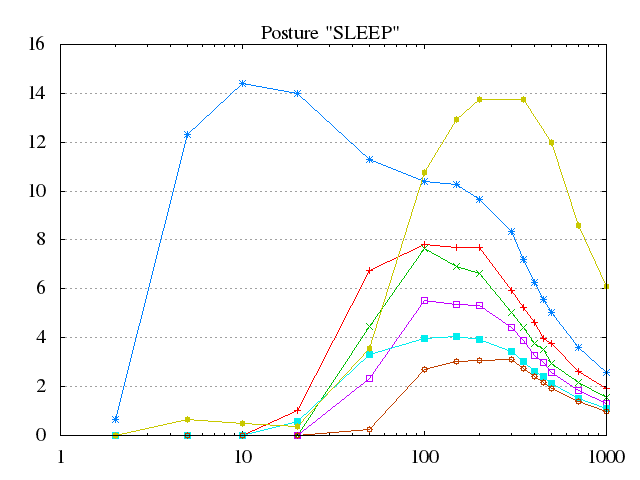
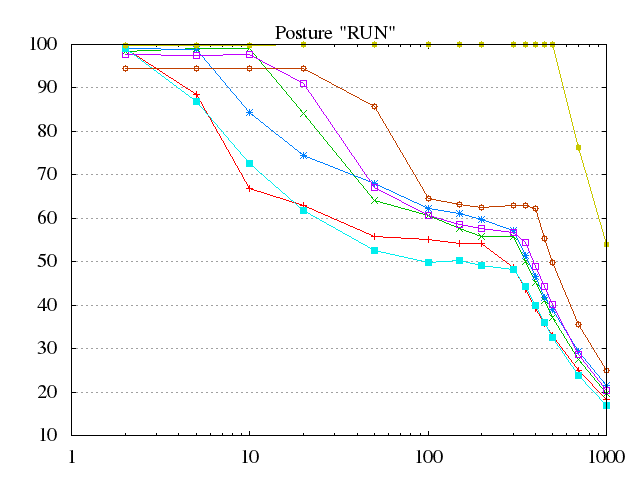
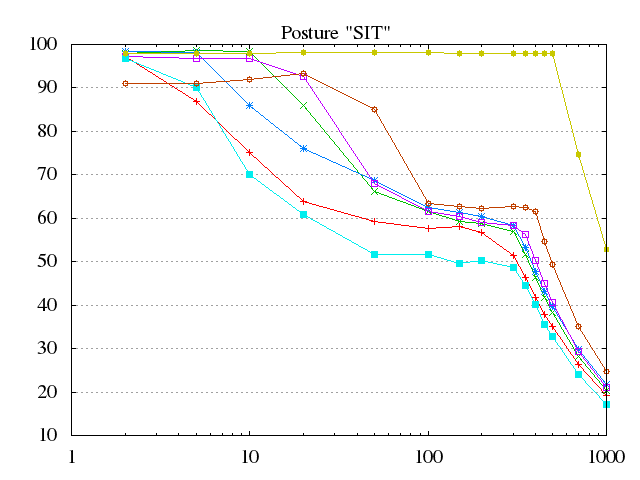
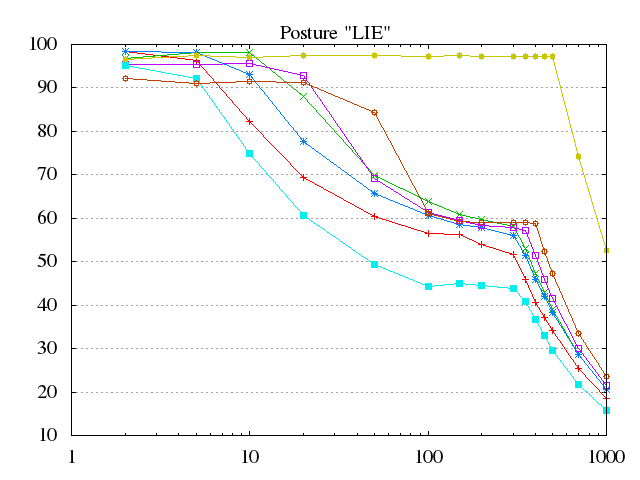
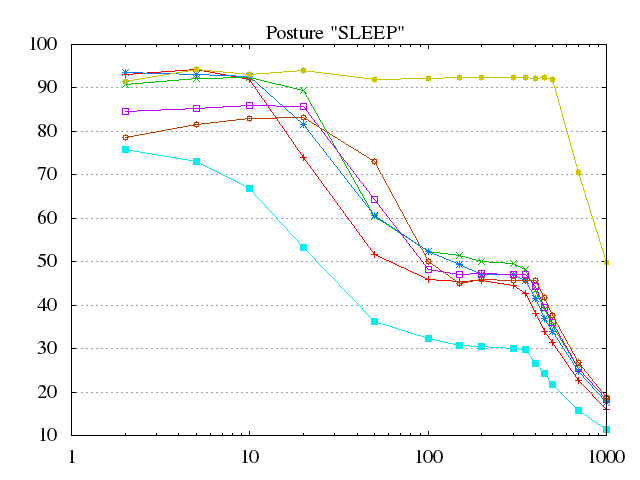
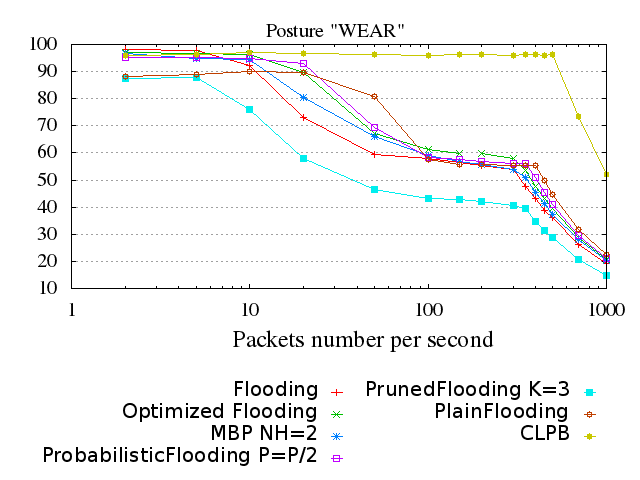
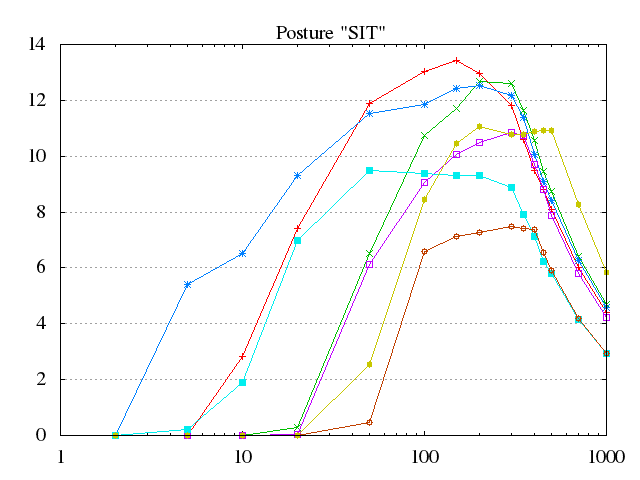
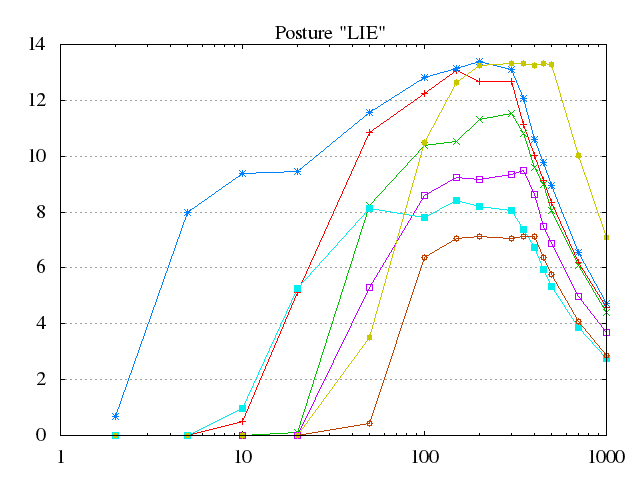
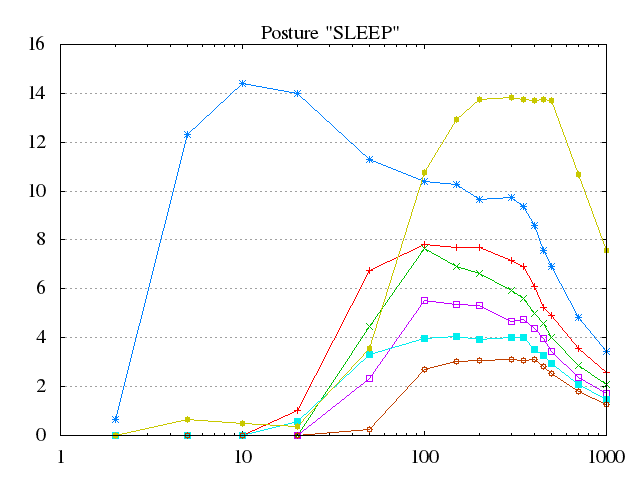
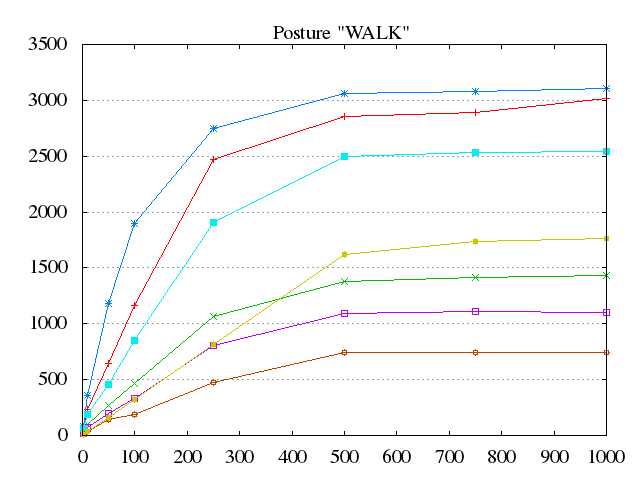
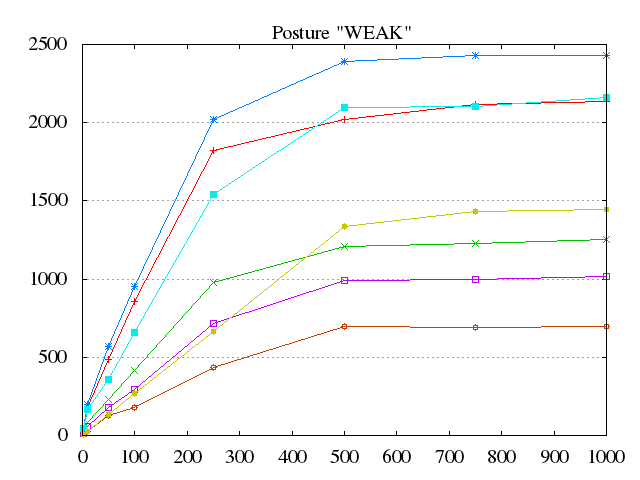
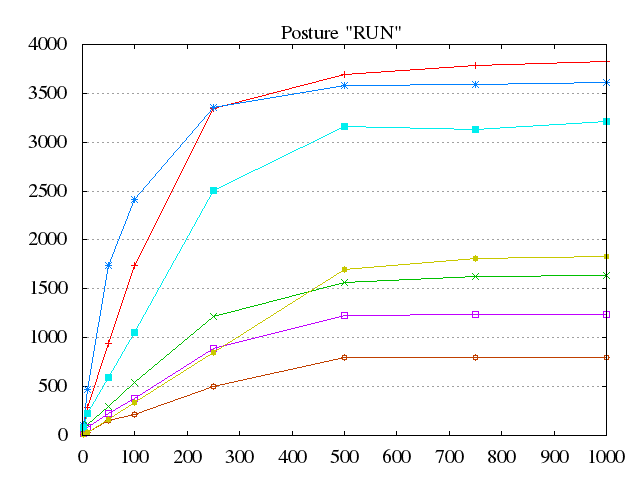
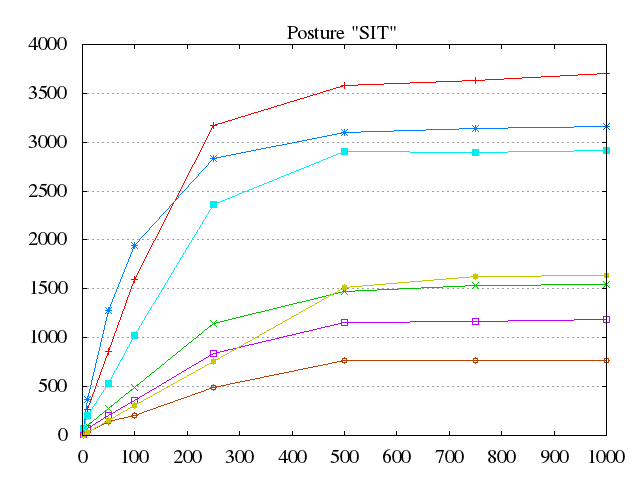
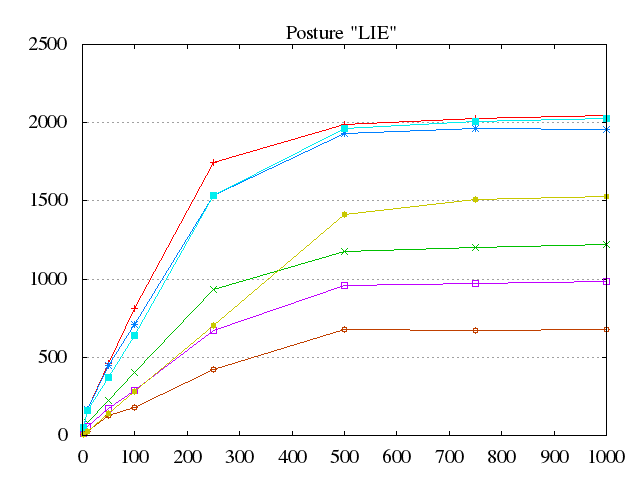
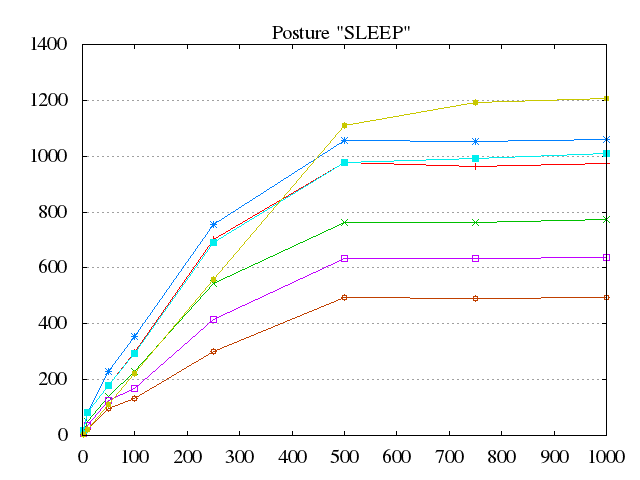
Figure 6 presents the percentage of covered nodes function of Sink transmission rate for all postures. This rate is presented as the number of packets per second.
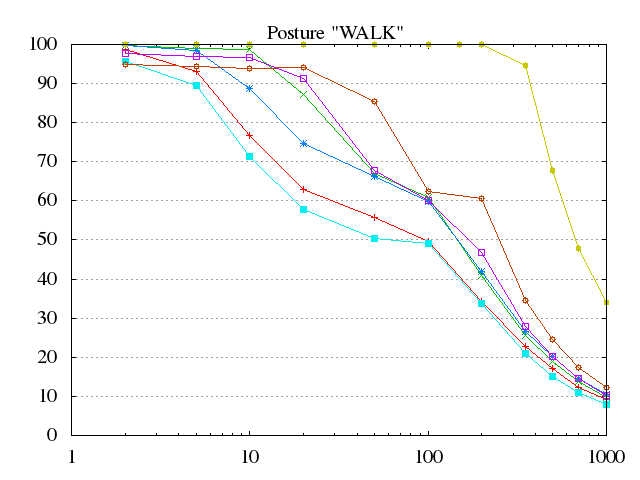
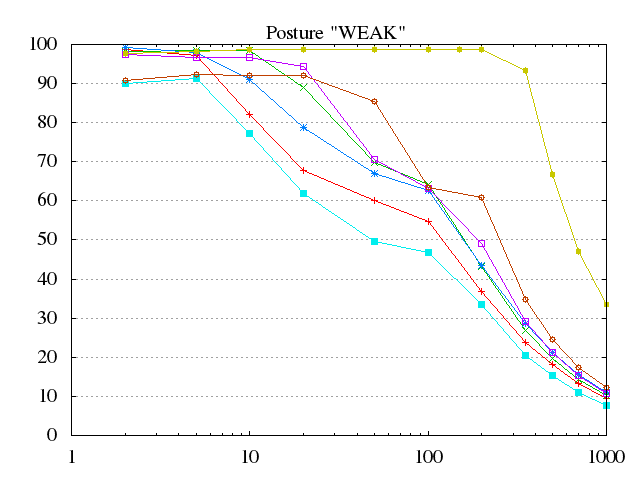
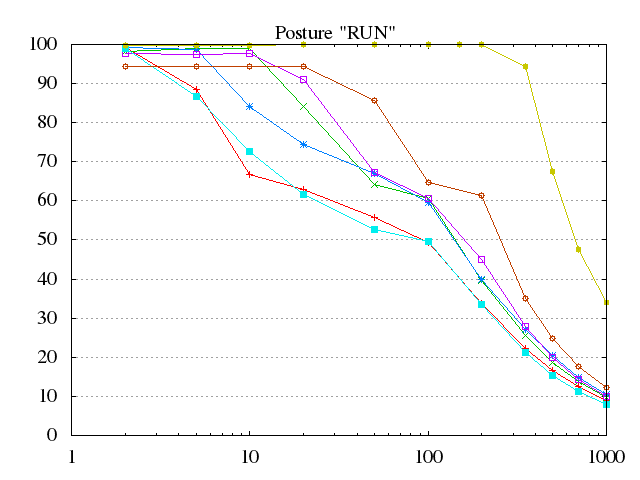
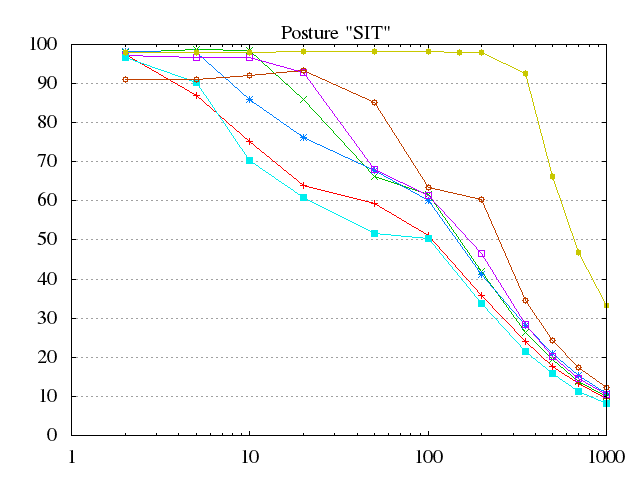
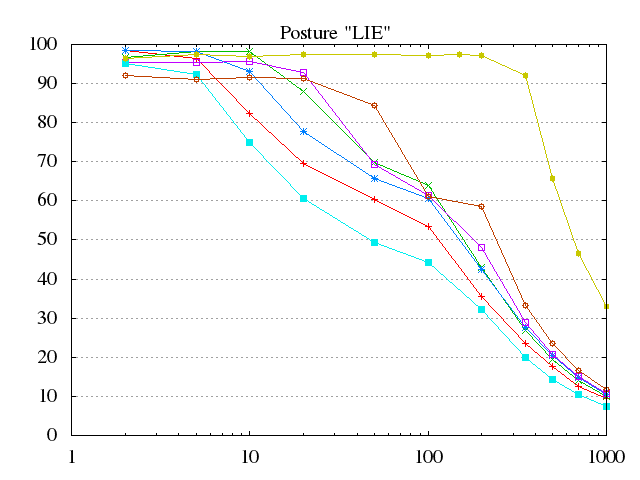
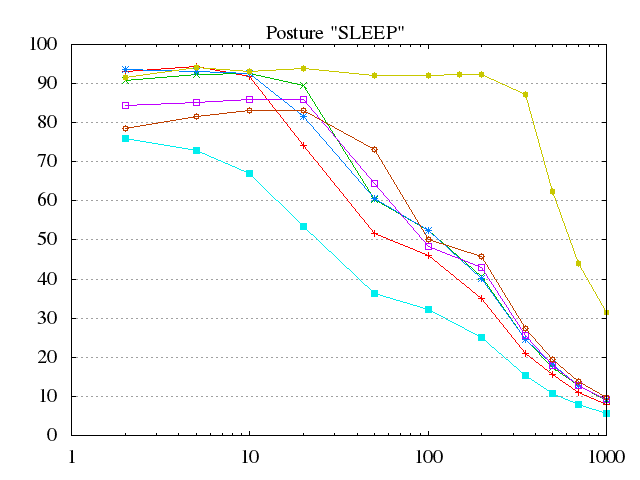
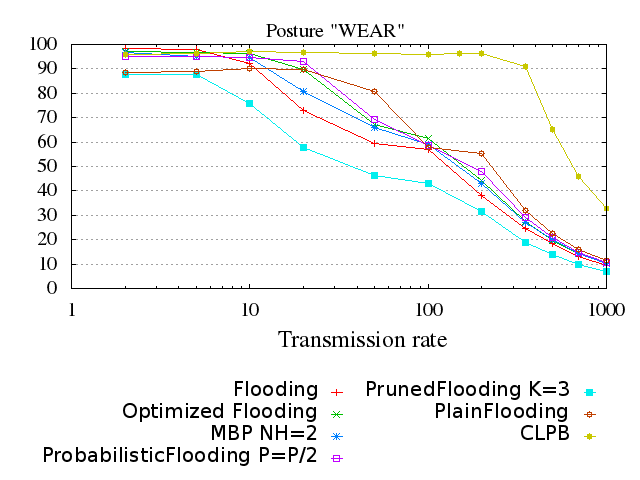
All broadcast strategies behave similarly: Going to packets/s, the percentage of covered nodes almost linearly decreases to reach %. At packets/s, percentage of covered nodes is, in average, equal to %.
With Flooding strategy, percentage decreases starting from packets/s. Nodes broadcast without restrictions received packets which overloads the network, creates collisions and so packets loss. Pruned Flooding and MBP percentage decreases starting from packets/s too. With Pruned Flooding, even if nodes are restricted to broadcast to only nodes, still, with many packets copies are generated and the network is overloaded. With MBP, broadcast is only delayed to give time for other nodes to receive and acknowledge correct reception. This technique allows MBP to give better percentage than Flooding and Pruned Flooding strategies because it limits collisions. In SLEEP posture, Flooding and MBP strategies are able to maintain a good percentage of covered nodes equal to up to packets/s. Due to low mobility and less available links, network is less overloaded so less collisions and less packets loss. However, in more mobile and dense postures, performance decreases, for example, in RUN posture, Flooding strategy shows of covered nodes up to packets/s and in SIT posture.
PrunedFlooding presents the lowest percentage. It is due to the important amount of packets generated in the network which creates collisions and packets loss. And also, for the random choice of next hops, some nodes are not qualified for forwarding. The results of the other strategies are close at the beginning then overlap and converge to the same point.
CLPB maintains a good percentage, greater than %, up to packets/s. With packets/s, Sink has one packet to send each s. Suppose a cycle lasts time slots with a time slot duration equal to s. At the end of the cycle, Sink node has packets waiting in buffer for broadcast. Or, with a bit rate equal to , Sink node can send up to Kbs during its time slot. A packet size is equal to bits then Sink node can send up to (Kbs / bits) packets equal to packets per time slot. Beyond packets/s, performance falls to % of covered nodes by packets/s. All nodes are enable to broadcast all waiting packets and empty the buffer.
5.2.2. Percentage of De-sequencing
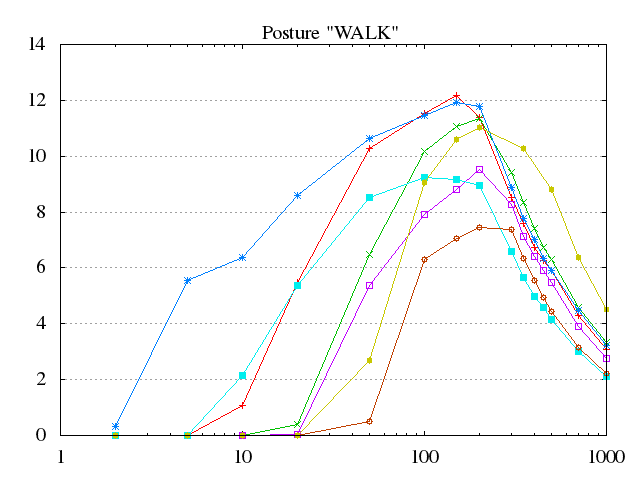
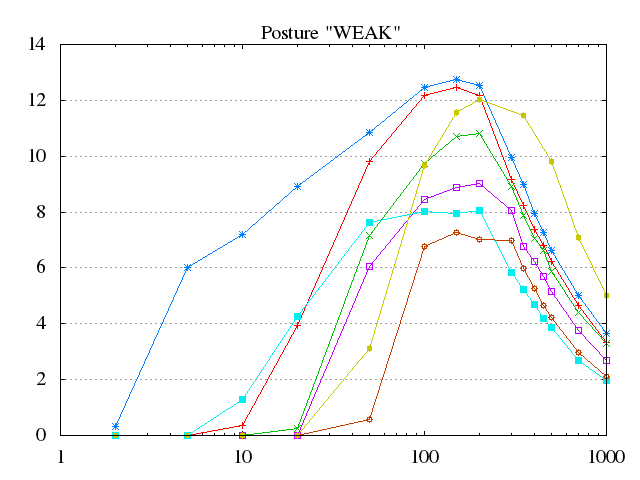
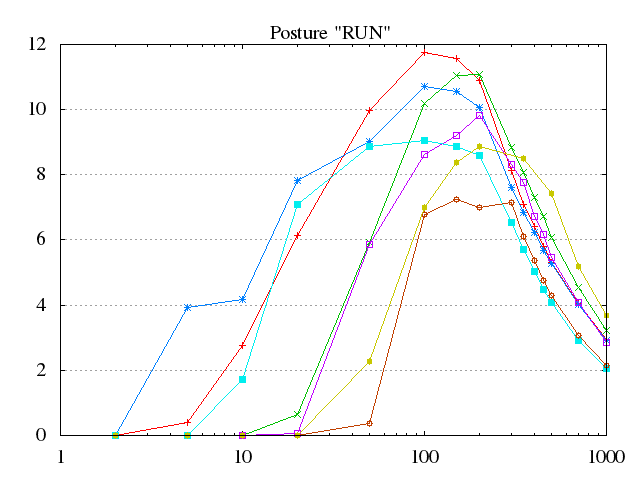
Figure 7 presents the percentage of de-sequencing for all postures in function of transmission rate.
Three phases can be observed:
-
•
At the beginning, all strategies present % of de-sequencing. At this point, strategies are able to handle more than one packet in the network.
-
•
Then, from a given rate (depending on the strategy), the percentage increases. Here, based on Figure 6, the percentage of covered nodes decreases due to collisions and packets loss. Therefore, sequencing is no longer ensured.
-
•
Finally, the percentage decreases to converge to 0% again due to the fact that few packets are received.
MBP strategy presents the highest percentage of de-sequencing for all postures, starting from packets/s. Nodes can broadcast immediately or delay received packet broadcasting. To take the decision, they compare each packet number of hops to a threshold NH. Thus, de-sequencing is more feasible.
Percentage of de-sequencing increases starting from packets/s for Flooding and Pruned Flooding and from packets/s for Optimized Flooding, PlainFlooding and Probabilistic Flooding for most postures. Flooding and Pruned Flooding have difficulties to handle transmission rate increase due to collisions and packets loss. An exception with SLEEP posture, where the percentage of de-sequencing is observed starting from packets/s due to the nature of the posture where few links are reliable.
Optimized Flooding strategy presents the lowest percentage of de-sequencing compared to Flooding and MBP strategies.
CLPB reacts as the other strategies and we observe a bit de-sequencing. This is due to the mobility model. That is, unreliable links may occur, thus allowing reception of one of several packets. The links then disappear and the complete sequence will be received through a more reliable and legitimate link.
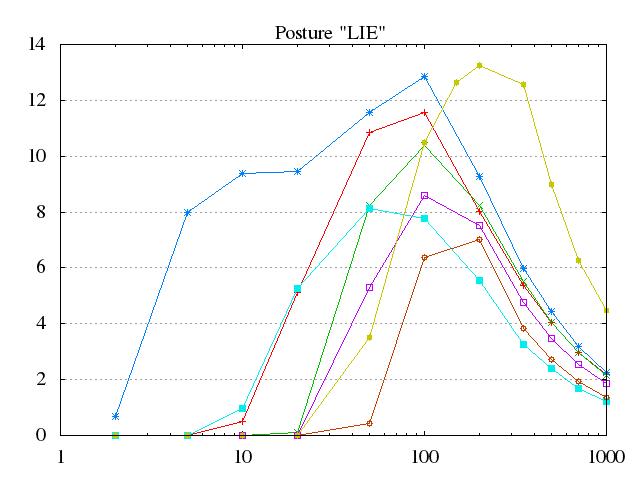
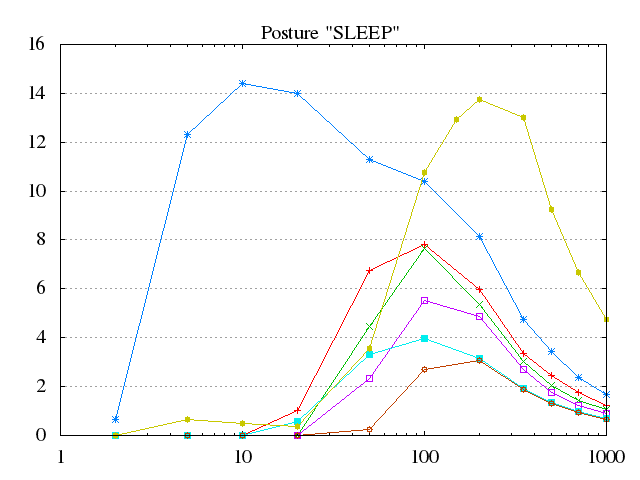
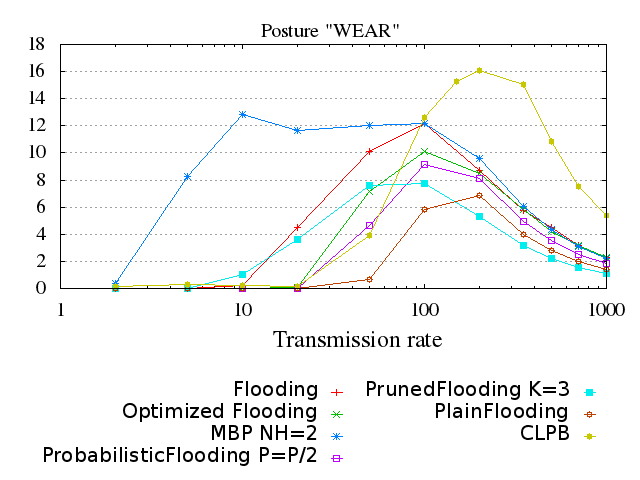
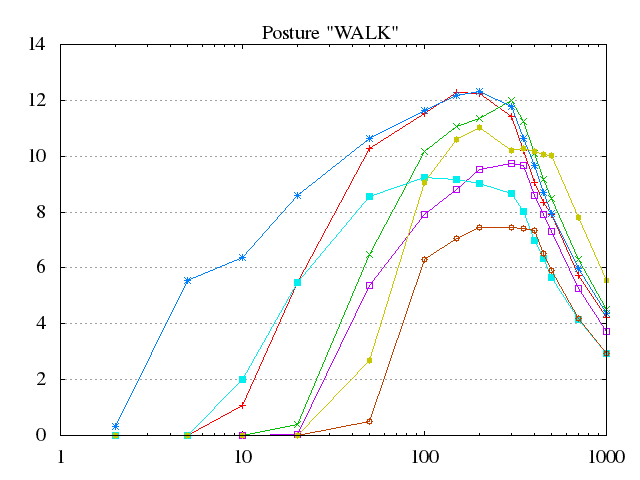
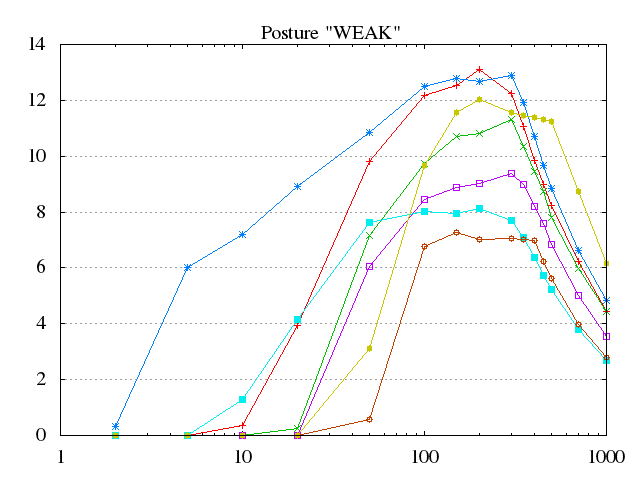
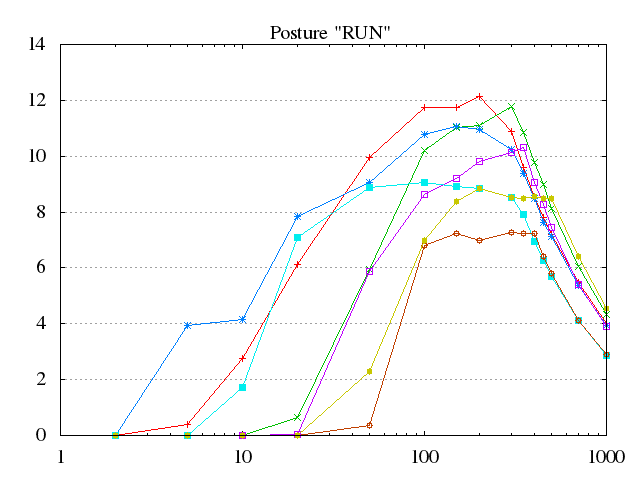
5.2.3. Average number of transmissions and receptions per node
Figure 8 shows the average number of transmissions and receptions per node.
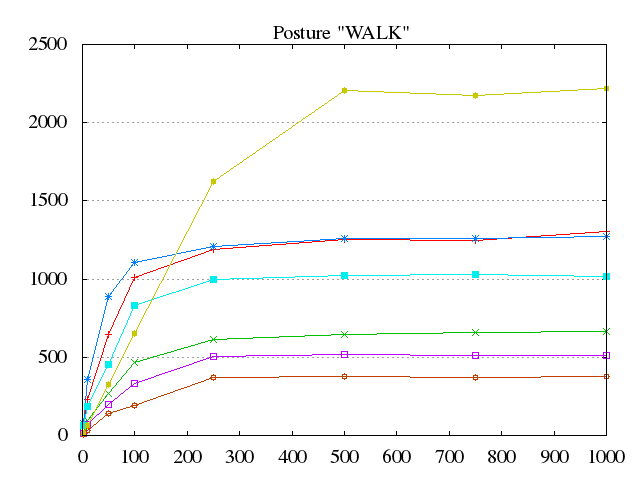
For all strategies, the number of transmissions and receptions starts increasing with transmission rate. However, and contrary to expectations, from a given rate, transmissions and receptions number stagnates and remains so even if transmission rate increases. For broadcast strategies, this explains the low percentage of covered nodes: transmission rate increases while nodes capacity to handle packets is reached. Due to a high mobility and appearance of several links, with RUN posture, nodes exchange three times more packets than in SLEEP posture and this for all strategies.
CLPB high transmissions and receptions number is due to a high percentage of covered nodes.
5.3. Broadcast rates up to 1000 packets/s and buffer size 200
MAC buffer size is set to packets. Now, more packets are able to be buffered waiting for broadcast.
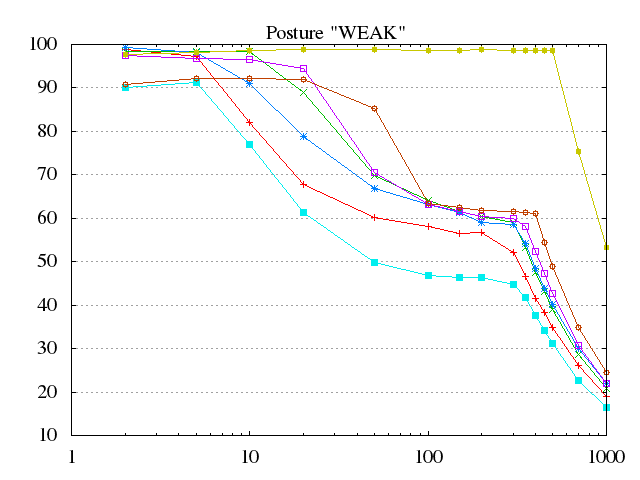
5.3.1. Percentage of covered Nodes:
Figure 9 presents the percentage of covered nodes in function of transmissions rate.
Network coverage is no longer assured with increased transmission rate. Flooding and Pruned Flooding strategies show the lowest percentage due to collisions for both and to the random choice of next hops for Pruned Flooding. Plain Flooding slightly exceeds the other strategies. In this strategy, nodes broadcast received packets only once, thus number of packets copies in the network is limited. This points out again the impact of collisions. Optimized Flooding and Probabilistic Flooding performance is close to each others. These two strategies restrict rebroadcasting that allow them to have a bit better results compared to other strategies. However, we can observe, that, to packets/s, Optimized Flooding slightly exceeds Probabilistic Flooding. This gap is more important in SLEEP posture than RUN and WALK postures. Because, Optimized Flooding strategy eliminates unnecessary retransmissions towards the end broadcasting process while Probabilistic Flooding restricts broadcasting from the beginning. CLPB outperforms the other strategies with a high percentage of covered. By packets/s, CLPB covers of nodes against an average of for broadcast strategies.
5.3.2. Percentage of De-sequencing:
Figure 10 presents the percentage of de-sequencing in function of packets number per second.
At first glance, results are quite similar to results for a buffer size equal to (section 5.2.2). Indeed, the percentage of de-sequencing is close for both values. However, in details, results show that the peak reached in percentage of de-sequencing is offset and around packets/s whereas it is around packets/s for the previous results. With CLPB, the peak reached is reached by packets/s, starting from which percentage of both covered nodes and de-sequencing decreases.
5.3.3. Number of transmissions and receptions
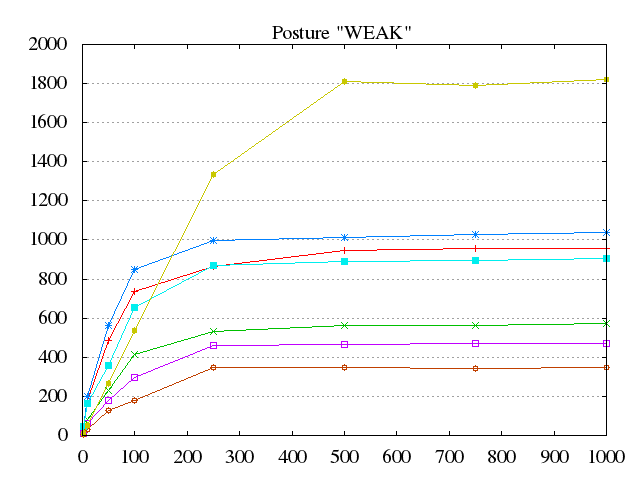
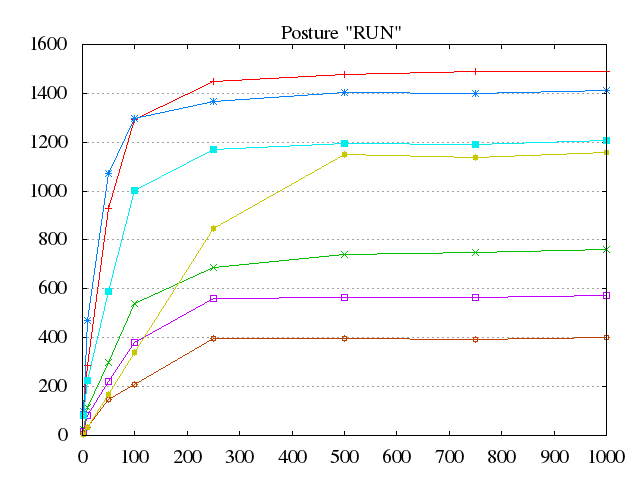
Figure 11 shows the average number of transmissions and receptions For WLAK and WEAK postures.
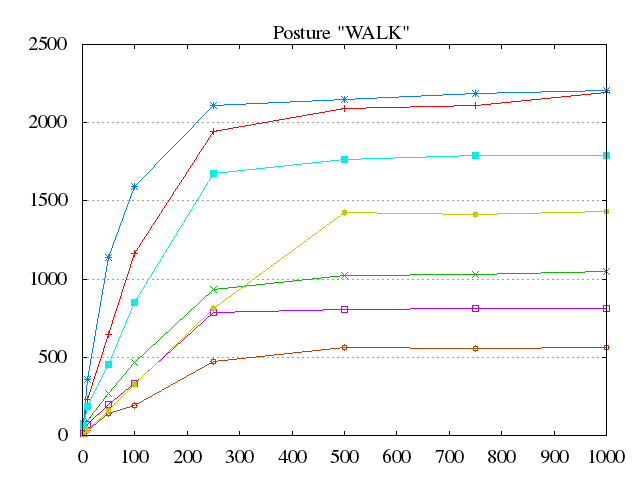
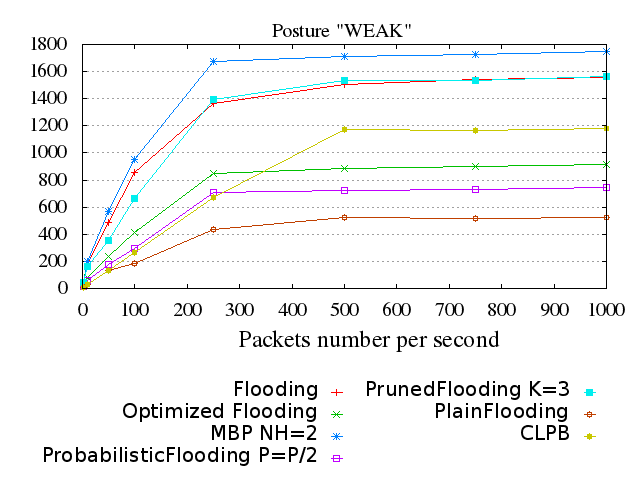
The number increases with transmission rate increase and stagnates by packets/s. This value is equal to MAC buffer size. It shows again the impact of buffer size on strategies performance. This stagnation shows that the nodes are unable to manage more packets in the network. This explains too percentage of covered nodes decrease: transmission rate increases while nodes capacity to handle packets is reached.
5.4. Broadcast rates up to 1000 packets/s and buffer size 300
In this section we advocate that, contrary to the expectations, the increase of the buffer size (three times greater than in the previous case) has little impact on the performances of both flat and cross-layer broadcast.
5.4.1. Percentage of covered Nodes
Figure 12 presents the percentage of covered nodes in function of transmission rate.
Flooding and Pruned Flooding strategies have the lowest percentage due to collisions. For Pruned Flooding, it is also due to the random choice of next hops. Plain Flooding slightly exceeds the other strategies in WALK and RUN postures. In this strategies, nodes broadcast received packets only once, thus number of packets copies in the network is limited. This behavior is once again due to collisions. However in SLEEP posture (which is a static posture) Plain Flooding maximum percentage is against in RUN and WEAK postures. Optimized Flooding and Probabilistic Flooding performances are close to each others. These two strategies restrict rebroadcasting which avoid unnecessary retransmissions and gives a better percentage compared to other strategies. However, in SLEEP posture, up to packets/s, Optimized Flooding exceeds Probabilistic Flooding. This is due to the fact that Optimized Flooding strategy eliminates unnecessary retransmissions towards the end of broadcasting process while Probabilistic Flooding restricts broadcasting from the beginning.
CLPB outperforms all broadcast strategies.It shows high percentage of covered nodes equal to for WALK and RUN postures and equal to for SLEEP posture up to packets/s. When the transmission rate is packets/s, CLPB covers of nodes (half the network) against an average of for flat broadcast strategies.
5.4.2. Percentage of De-sequencing
Figure 13 presents the percentage of de-sequencing function of transmission rate.
At first glance, results are quite similar to results for buffer size (paragraph 5.2.2). Indeed, the percentage of de-sequencing is close for both buffer size values in a range of []%. However, looking in details, results show that the curve is offset and the percentage of de-sequencing starts decreasing around packets/s whereas it is around packets/s for the previous results. Looking back to the percentage of covered nodes, it falls linearly by packets/s, at this point, packets from application layer are not even broadcasted due to MAC over-buffer.
5.4.3. Average number of transmissions and receptions per node
Figure 14 shows the average number of transmissions and receptions per node.
The number increases and stabilizes around packets/s. It shows again the impact of buffer size on strategies performance.
Interesting results for postures RUN and WALK points out that, up to packets/s, CLPB transmissions and receptions number is equal to half MBP and Flooding transmissions and receptions number. However, CLPB ensures of covered nodes while these two strategies only cover of the network.
These are important results that, contrary to expectations, show that, although the buffer size is three times greater, broadcast strategies performance are barely better than performance with buffer size set to (see Section 5.2). Percentage of covered nodes decreases to by instead of . As a result of this slight increase, percentage of de-sequencing increases. Also, the percentage of covered nodes falls when transmission rates exceed packets/s in average and no improvement is observed.
CLPB outperforms all broadcast strategies and maintains a higher percentage of covered nodes than with a buffer size set to up to packets/s.
5.5. Broadcast with transmission rates of 1 packet/s
The previous study (sections 5.2 and 5.4) showed that our new cross layer protocol, CLPB, outperforms flat broadcast strategies with a Sink transmission rate goes up to 1000 packets/s. The protocol offers a high percentage of covered nodes up to packets/s against packets/s for broadcast strategies (For buffer size ).
In the following, we zoom the case when Sink transmission rate equals one packet per second. In addition to the percentage of covered nodes and the number of transmissions and receptions we also evaluate the end-to-end delay per strategy.
5.5.1. Percentage of covered nodes
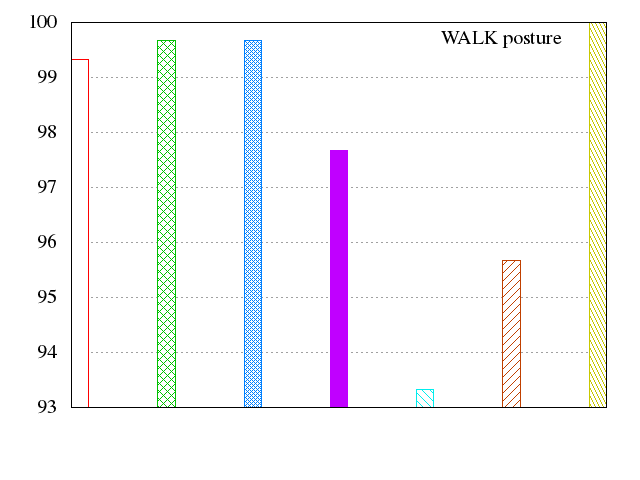
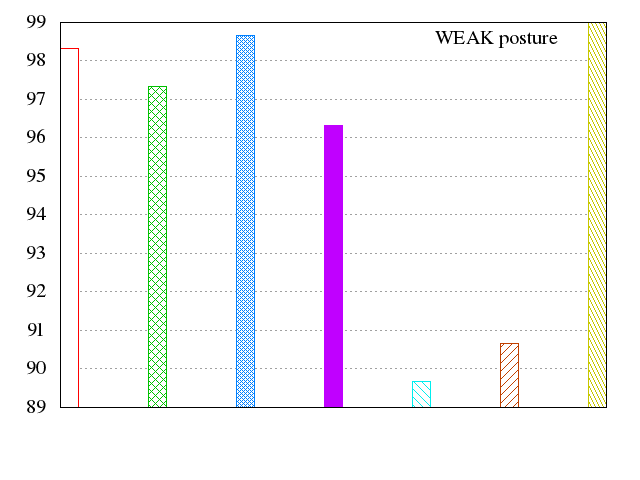
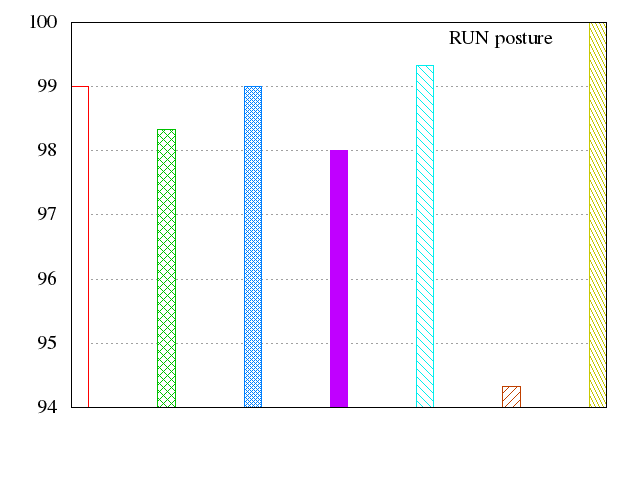
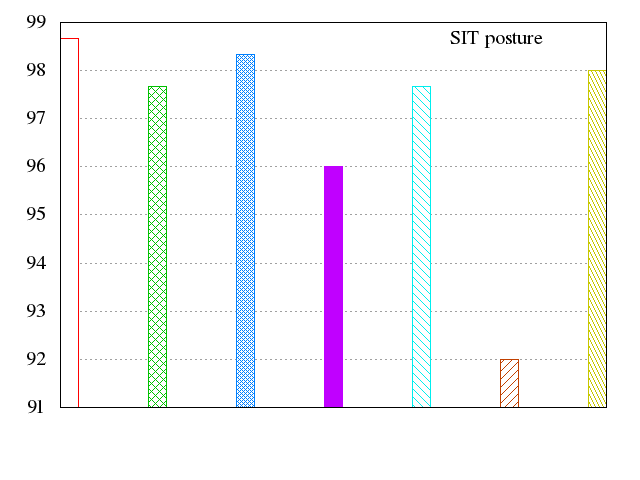
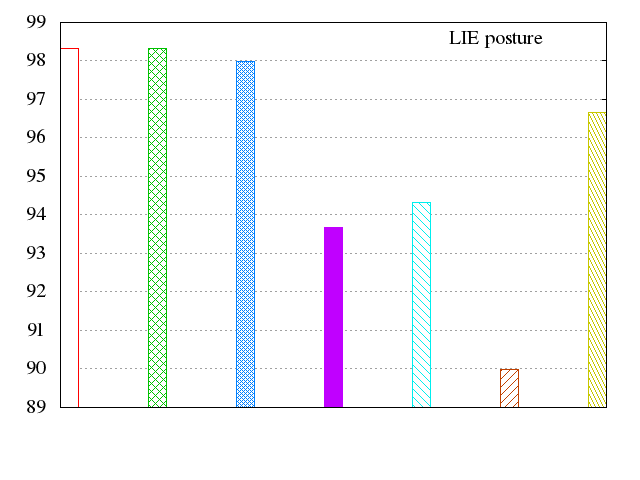
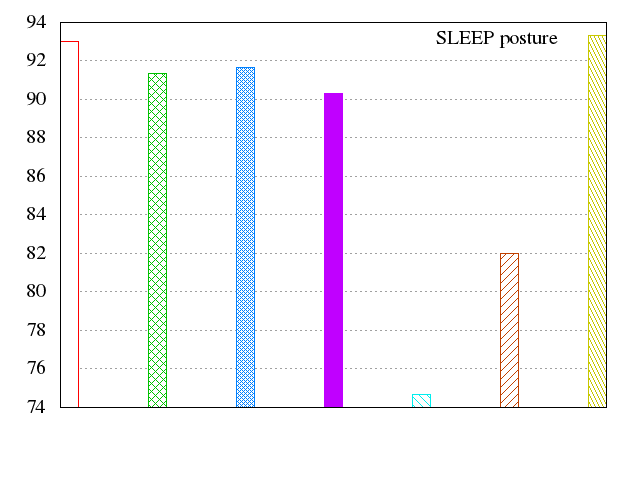
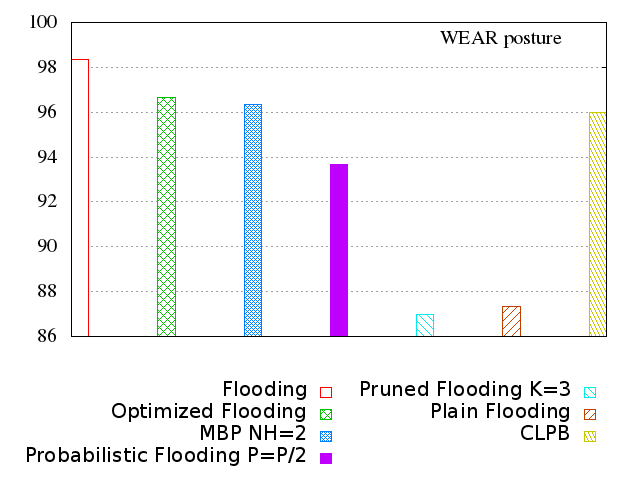
Figure 16 shows the average percentage of covered nodes for all strategies.
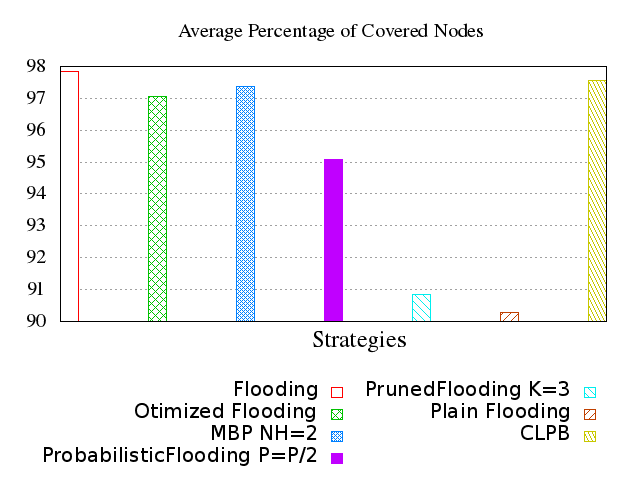
Results show, in average, a good percentage for all strategies greater than .
Flooding, Optimized Flooding and MBP show quite close percentages. As expected, with Flooding strategy, nodes rebroadcast each received copy of the packet which increases the probability of receiving the packet. Optimized Flooding is a Flooding strategy adaptation to meet Flooding strategy advantages with WBAN energy constraints. Thus, a slight decrease of the percentage (less than ) is observed due to discarding obsolete copies of the packet in order to reduce ping-pong effect. For MBP, nodes broadcast each received packet while the number of hops of this packet is less than the predefined threshold (in these simulations: threshold=NH=). If threshold is reached, nodes delay packet broadcasting for a moment. Thus, a packet is only discarded when a sender receives required acknowledgements otherwise it continues broadcasting waiting packets. This explains the good percentage shown by MBP.
Probabilistic Flooding and Pruned Flooding strategies use randomness in the broadcast process: Probabilistic Flooding in the choice of random variable to compare with the probability while Pruned Flooding in the choice of random nodes as next hops. Pruned Flooding is more affected by body postures than Probabilistic Flooding. It shows the lowest percentage of covered nodes in SLEEP posture equal to while Probabilistic Flooding percentage is equal to . This reveals the importance of forwarding nodes position on body to the number of packet copies in the network.
Plain Flooding shows the lowest percentage. Nodes broadcast a received packet only once, the first time it receives it. After that, all received copies are discarded. When a neighbor didn’t receive the packet at that time, it has less chances to receive it after.
CLPB shows a high percentage, higher than . Although nodes broadcast the packet only once, CLPB achieves good network cover.
End to end delay
Figure 17 shows the average end to end delay for all strategies.
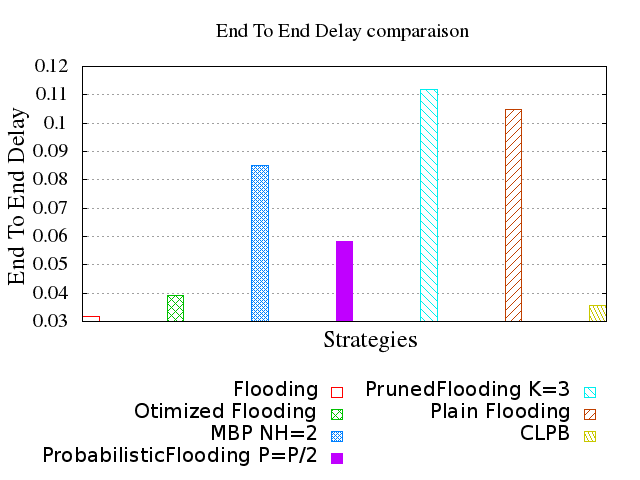
Flooding strategy has the lowest end to end delay and remains a reference regarding the delay to cover the hole network. Because no restrictions are imposed to broadcast, nodes automatically and immediately broadcast each received copy of the packet.
Optimized Flooding also ensures a good end to end delay. Although, nodes discards some received packets, the average end to end delay is quite close to Flooding delay.
In MBP nodes delay packet broadcasting in order to allow receivers to acknowledge received packets before overloading the network with unnecessary packet copies.
The highest end-to-end delay is observed with Plain Flooding and Pruned Flooding strategies. It is related to their low percentage of covered nodes. In fact, to each non covered node, a high end to end delay is automatically assigned to this node.
CLPB ensures the lowest end to end delay just after Flooding. Although, sender nodes have to wait for their time slot to broadcast a packet, delay is not affected. This is due to two factors: First, the choice of time slot duration, equal to s during these simulations. Second, CLPB scheduling mechanism avoids collisions, increases transmission success probability, decreases percentage on non-covered nodes and thus reduces end to end delay.
Figure 18 shows the average end to end delay per node for all strategies.
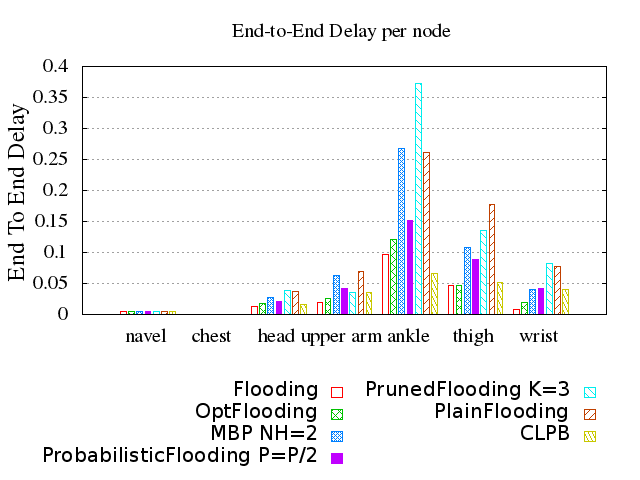
Strategies behave similarly considering nodes position. For nodes at navel and head, a low end to end delay is observed and it is almost equal for all strategies. In fact, these nodes are by a single hop from Sink node adding to that, they are almost motionless. A slit increase in delay with upper arm and wrist nodes because, for some postures, these two nodes are moving and signal attenuation become important. Thigh and wrist, are the farthest nodes to the Sink, thus packet needs to pass through intermediate nodes before reaching these two nodes which increases end to end delay. It is important to points out that, to reach ankle node, with our cross layer protocol a broadcasted packet takes half the time it takes with the other strategies even comparing with Flooding strategy.
Figure 19 shows the average end to end delay per posture.
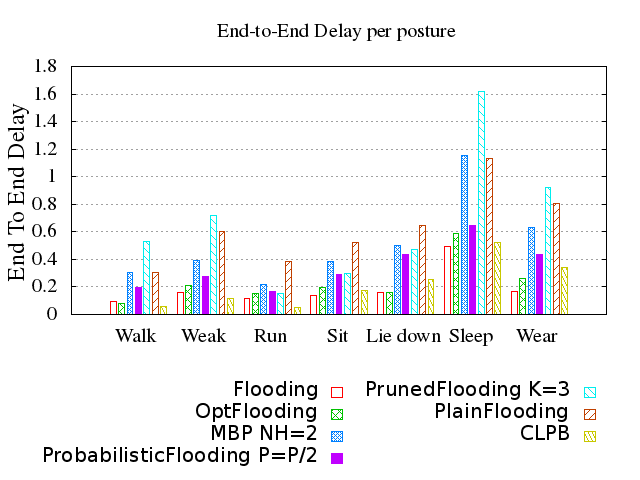
Our novel protocol CLPB outperforms Flooding in three postures: WALK, WEAK and RUN. These postures are variations of walking motions where links are reliable and signals attenuations are moderate. Even if it is considered as a reliable environment for communication, for Flooding, it causes more packets exchange, collisions, packets loss and retransmissions.
With SLEEP posture, all strategies require more time to cover the network. In this posture, some nodes are hidden by body parts and, due to a motionless posture, they are difficult to reach.
Total number of transmissions and receptions
Figure 20 shows transmissions and receptions number for all strategies.
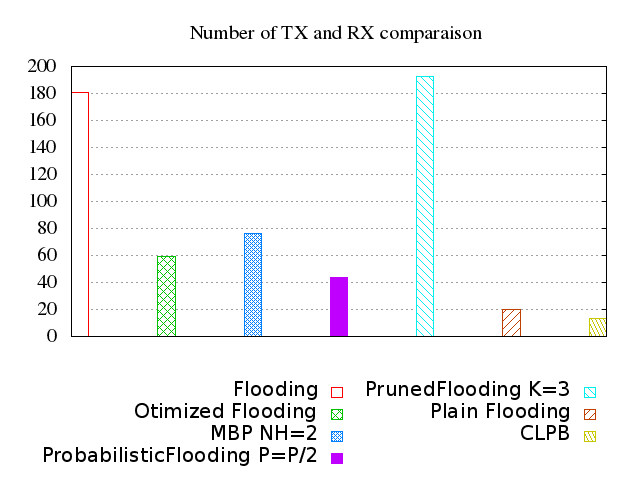
Flooding and Pruned Flooding strategies present the highest transmissions and receptions number. For Pruned Flooding, is the number of nodes to choose randomly. With , a node sends three packets which increases the number of packet copies in the network. For Flooding, no restrictions on broadcasting a packet, allows to generate many packet copies. Plain Flooding and CLPB have a low transmissions and receptions number. However, back to the end to end delay (Figure 17) and the percentage of covered nodes (Figure 16), CLPB performs better. For Plain Flooding, this low number is due to lack of communication, while with CLPB, this is thanks to scheduling restrictions.
Figure 21 shows transmissions and receptions number per node.
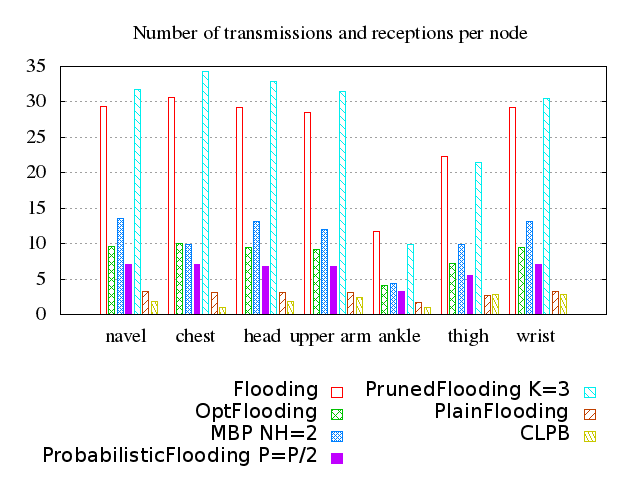
For all nodes, CLPB presents the lowest transmissions and receptions number. Nodes broadcast only once a received packet during their time slot. Thus, the number of transmissions is, at most, equal to for all nodes. The number of receptions depends on node positions and is at most equal to the number of senders if we suppose that a node is able to intercept all broadcasted packets. For Sink node, there is no receptions. When Sink broadcasts the packet in the network, it goes back to sleep and the overall number of transmissions and receptions is equal to .
Figure 22 shows the average number of transmissions and receptions per posture.
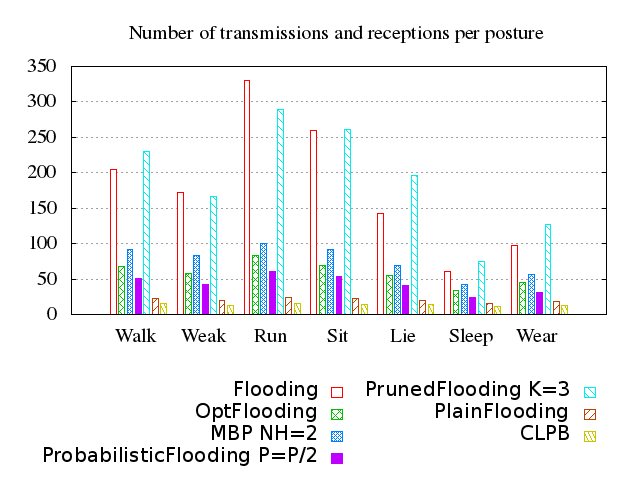
Results show that our new protocol is the less affected by body posture. Figure 22 shows an almost equal number of transmissions and receptions for all postures. This is explained by a number of transmissions bounded by at most and a number of receptions bounded by Number of time slots or in other words number of senders.
For the other strategies, the number of transmissions and receptions varies depending on the wearer posture. We can observe the lowest number is with SLEEP posture and the highest number is with RUN posture. We observe also that SIT posture present a high number of transmissions and receptions. This posture is a Up-Down motion variation and is characterized with a dense network where nodes are interconnected.
CLPB offers the best of two worlds: high percentage of covered nodes and an end-to-end delay similar to the best known flat strategy (i.e. Flooding). Simulations results also showed interferences and dropped frames with interference. Collisions between packets are reduced to since at each slot only one node is allowed to transmit. However, there are a number of dropped frames without interferences which is due to our mobility model characteristics.
6. Conclusion and future works
This paper is, to the best of our knowledge, the first that proposes a MAC-network cross-layer broadcast in WBAN. Our work was motivated by results obtained after an extensive set of simulations where we stressed the existing network layer broadcast strategies (Badreddine et al., 2015) against realistic human body mobility and various transmission rates. With no exception, the existing flat broadcast strategies register a dramatic drop of performances in terms of percentage of covered nodes, end-to-end delay and energy consumption when the transmission rates are superior to Kb/s. We therefore, propose a new MAC-network cross-layer broadcast that exploits the communication graph defined by the body posture in order to optimize the medium access and nodes synchronization. Our new protocol outperforms existing flat broadcast strategies in terms of percentage of covered nodes, energy consumption and native correct reception of causally-ordered packets (i.e. packets are received in the order of their sending). Furthermore, our protocol maintains its good performances up to Kb/s transmission rates.
Our work opens several research directions. In the following we discuss two of them. First, we plan to investigate the slot synchronization in WBAN.The cross-layer protocols designed so far for WBAN assume a strong slot synchronization. Efficiently synchronizing slots in WBAN with realistic human body postures and mobility is an open issue. Second, we intend to extend our study to cross-layer converge-cast protocols. Although, there are several proposals in the WBAN literature, none of them has been stressed with realistic human body mobility and peaks of transmission rates.
References
- (1)
- (2) The omnet home page. https://omnetpp.org/
- 32 (2015) 2015. Tractica.com. More than 78 Million Consumers Will Utilize Home Health Technologies by 2020 — Tractica. [online] Available at: https://www.tractica.com/newsroom/press-releases/more-than-78-million-consumers-will-utilize-home-health-technologies-by-2020. Tractica.com (2015). https://www.tractica.com/newsroom/press-releases/more-than-78-million-consumers-will-utilize-home-health-technologies-by-2020/
- Badreddine et al. (2015) Wafa Badreddine, Claude Chaudet, Federico Petruzzi, and Maria Potop-Butucaru. 2015. Broadcast Strategies in Wireless Body Area Networks. In Proceedings of the 18th ACM International Conference on Modeling, Analysis and Simulation of Wireless and Mobile Systems (MSWiM ’15). ACM, New York, NY, USA, 83–90. DOI:http://dx.doi.org/10.1145/2811587.2811611
- Badreddine et al. (2016) Wafa Badreddine, Claude Chaudet, Federico Petruzzi, and Maria Potop-Butucaru. 2016. Broadcast Strategies and Performance Evaluation of IEEE 802.15.4 in Wireless Body Area Networks WBAN. Research Report. LIP6 UMR 7606, UPMC Sorbonne Universités, France ; UPMC - Paris 6 Sorbonne Universités. https://hal.archives-ouvertes.fr/hal-01404848
- Braem et al. (2006) B. Braem, B. Latre, I. Moerman, C. Blondia, and P. Demeester. 2006. The Wireless Autonomous Spanning tree Protocol for Multihop Wireless Body Area Networks. In Mobile and Ubiquitous Systems - Workshops, 2006. 3rd Annual International Conference on. 1–8. DOI:http://dx.doi.org/10.1109/MOBIQW.2006.361753
- Correa et al. (2016) Chica Juan Camilo Correa, Juan Felipe Botero Vega, and Natalia Gaviria Gomez. 2016. Cross-layer Designs for Energy Efficient Wireless Body Area Networks: A Review. Revista Facultad De Ingenieria 79. DOI:http://dx.doi.org/10.17533/udea.redin.n79a10
- Evan P. C. Jones and Ward (2007) Jakub K. Schmidtke Evan P. C. Jones, Lily Li and Paul A. S. Ward. 2007. Practical Routing in Delay-Tolerant Networks. IEEE Trans. Mob. Comput. 6, 8 (2007), 943–959. DOI:http://dx.doi.org/10.1109/TMC.2007.1016
- Garg et al. (2010) Kamini Garg, Daniele Puccinelli, and Silvia Giordano. 2010. Implementation of the Wireless Autonomous Spanning Tree Protocol on Mote-Class Devices. In EMERGING 2010, The Second International Conference on Emerging Network Intelligence. 89–94.
- i. Naganawa et al. (2015) J. i. Naganawa, K. Wangchuk, M. Kim, T. Aoyagi, and J. i. Takada. 2015. Simulation-Based Scenario-Specific Channel Modeling for WBAN Cooperative Transmission Schemes. IEEE Journal of Biomedical and Health Informatics 19, 2 (March 2015), 559–570. DOI:http://dx.doi.org/10.1109/JBHI.2014.2326424
- Javaid et al. (2013) Nadeem Javaid, Naveed A. Khan, Mustafa Shakir, Mahmood Ashraf Khan, Safdar Hussain Bouk, and Z. A. Khan. 2013. Ubiquitous HealthCare in Wireless Body Area Networks - A Survey. CoRR abs/1303.2062 (2013). http://arxiv.org/abs/1303.2062
- Johny and Anpalagan (2014) B. Johny and A. Anpalagan. 2014. Body Area Sensor Networks: Requirements, Operations, and Challenges. IEEE Potentials 33, 2 (March 2014), 21–25. DOI:http://dx.doi.org/10.1109/MPOT.2013.2286692
- Köpke et al. (2008) Andreas Köpke, Michael Swigulski, Karl Wessel, Daniel Willkomm, P.T. Klein Haneveld, Tom Parker, Otto Visser, Hermann Simon Lichte, and Stefan Valentin. 2008. Simulating Wireless and Mobile Networks in OMNeT++ – The MiXiM Vision. In 1st International Workshop on OMNeT++ (hosted by SIMUTools 2008). Marseill, France.
- Latré et al. (2011) Benoît Latré, Bart Braem, Ingrid Moerman, Chris Blondia, and Piet Demeester. 2011. A Survey on Wireless Body Area Networks. Wirel. Netw. 17, 1 (Jan. 2011), 1–18. DOI:http://dx.doi.org/10.1007/s11276-010-0252-4
- Latre et al. (2007) B. Latre, B. Braem, I. Moerman, C. Blondia, E. Reusens, W. Joseph, and P. Demeester. 2007. A Low-delay Protocol for Multihop Wireless Body Area Networks. In 2007 Fourth Annual International Conference on Mobile and Ubiquitous Systems: Networking Services (MobiQuitous). 1–8. DOI:http://dx.doi.org/10.1109/MOBIQ.2007.4451060
- Laurie et al. (2012) Hughes Laurie, Wang Xinheng, and Chen Tao. 2012. A Review of Protocol Implementations and Energy Efficient Cross-Layer Design for Wireless Body Area Networks. Sensors 12, 11 (2012), 14730. DOI:http://dx.doi.org/10.3390/s121114730
- Movassaghi et al. (2014) S. Movassaghi, M. Abolhasan, J. Lipman, D. Smith, and A. Jamalipour. 2014. Wireless Body Area Networks: A Survey. IEEE Communications Surveys Tutorials 16, 3 (Third 2014), 1658–1686. DOI:http://dx.doi.org/10.1109/SURV.2013.121313.00064
- Ni et al. (1999) Sze-Yao Ni, Yu-Chee Tseng, Yuh-Shyan Chen, and Jang-Ping Sheu. 1999. The Broadcast Storm Problem in a Mobile Ad Hoc Network. In Proceedings of the 5th Annual ACM/IEEE International Conference on Mobile Computing and Networking (MobiCom ’99). ACM, New York, NY, USA, 151–162. DOI:http://dx.doi.org/10.1145/313451.313525
- Ullah et al. (2016) Fasee Ullah, Abdul Hanan Abdullah, Muhammad Zubair, Waqar Rauf, Junaid Junaid, and Kashif Naseer Qureshi. 2016. The Role of Cross-Layered Designs in Wireless Body Area Network. In EMERGING 2010, The Second International Conference on Emerging Network Intelligence. DOI:http://dx.doi.org/10.11113/jt.v78.8260
- Ullah et al. (2012) Sana Ullah, Henry Higgins, Bart Braem, Benoit Latre, Chris Blondia, Ingrid Moerman, Shahnaz Saleem, Ziaur Rahman, and Kyung Sup Kwak. 2012. A Comprehensive Survey of Wireless Body Area Networks. Journal of Medical Systems 36, 3 (2012), 1065–1094. DOI:http://dx.doi.org/10.1007/s10916-010-9571-3