Understanding International Migration using Tensor Factorization††thanks: Accepted as poster at WWW 2017
1 Introduction
Understanding human migration is of great interest to demographers and social scientists. User generated digital data has made it easier to study such patterns at a global scale. Geo coded Twitter data, in particular, has been shown to be a promising source to analyse large scale human migration. But given the scale of these datasets, a lot of manual effort has to be put into processing and getting actionable insights from this data.
In this paper, we explore feasibility of using a new tool, tensor decomposition, to understand trends in global human migration. We model human migration as a three mode tensor, consisting of (origin country, destination country, time of migration) and apply CP decomposition to get meaningful low dimensional factors. Our experiments on a large Twitter dataset spanning 5 years and over 100M tweets show that we can extract meaningful migration patterns.
2 Related Work
Understanding human mobility patterns at a global scale using digital data has been of great interest to demographers and social science researchers. In particular, geo-tagged Twitter data has been used extensively in the past to study global human mobility patterns [2, 5]. Tensors are higher dimensional extensions of matrices, which can be used to represent multi modal data. A comprehensive survey on tensors and applications of tensors can be found in [3]. Tensor factorization provides a principled way to analyse large scale multi-modal datasets. Recent progress on scalable implementations of tensor factorization [4] have lead to the application of tensors in a wide range of fields, including Criminology, Neuroscience, Socialscience, etc. See [1] for a detailed survey. Our paper complements existing work on using Twitter data by showing the applicability of a new tool (tensor factorization) to better understand large scale migration behavior.
3 Data
Using the Archive Twitter stream111https://archive.org/details/twitterstream (1% random sample) from 2011–2016, we obtained 138M geo-tagged tweets. We used the geo coordinates (lat,long) to obtain the country from which a user tweeted and filtered out users who had a geo tagged tweet in at least two countries from October 2011 to November 2016 giving us 428,000 users. Using the Twitter API, we obtained the 3,200 most recent tweets for all these 428k users, which gave us 109M geo tagged tweets. We preprocessed the data using simple heuristics, used in previous work [2] to remove noise and bot accounts. We defined a user’s monthly country of residence as the country where she produces most of the tweets in that month. If a user doesn’t tweet at all in a month, we assign that month with the most recently known country of residence. We define a migration at some month as a change of country of residence between windows of months before and after that month. This way, by simply adjusting the window size, we can analyse the migration patterns of different types, such as short-term migration (e.g. student’s one semester exchange) or long-term migration (e.g. permanent migration).
4 Methodology
An -way tensor is a generalization of a matrix (2-way tensor). After getting the migration history of the users, we aggregate the global migration flow as an 3-way tensor with the size , where is the number of countries and dependent territories in our dataset and is the number of time-steps (monthly from October 2010 to November 2016). The entry is the number of Twitter users migrating from the country to the country at the time-step .
A standard technique to decompose a matrix into its salient components (factors) is Singular Vector Decomposition (SVD). For tensors, a generalization of SVD, called CP decomposition [3], can be used to obtain the salient factors. Suppose is a 3-way tensor and is a positive integer. A CP decomposition decomposes into three latent , which are a sum of component rank-one tensors.
| (1) |
i.e., the tensor can be represented as the sum of components of the outer product of three vectors. Each vector () corresponds to one of the three dimensions of the tensor. Vector represents a factor corresponding to the origin country, the destination country and the time-step. For each of three dimensions, we can stack vectors (components) as columns of a matrix, which is called a . In our case, we have three factor matrices , and which have the size , and respectively. Each factor matrix is a -dimensional representation of the salient patterns in the migration counts. In this paper, we used Bayesian Poisson Tensor Factorization (BPTF) [4] for the CP decomposition, since it handles sparse tensors effectively.
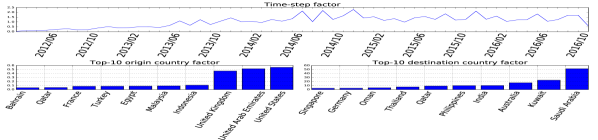
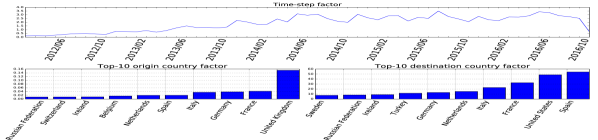
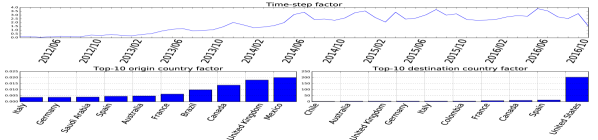
To obtain interesting insights from the factor matrices, we start with measuring the distribution of the components in the time-step factor (). The components having many uneven values in the time-step vector may represent interesting patterns such as sudden spikes in migration. To measure the uneven distribution in the time component, we compute the Gini Coefficient222https://en.wikipedia.org/wiki/Gini_coefficient of each of the components, and rank the top-10 components with highest Gini values along with the corresponding origin country and destination country factors and . In this way, we can analyse the top origin and destination countries countributing abnormally in the time-step factor. After that, we plot and examine the most deviant components in the order of the Gini coefficient rank.
5 Findings
Using the above methodology, we constructed a 3-mode tensor with = 1, 2, 3, 4 and 5 month windows, with low rank = 15 components and examined the results. We find some interesting observations. (i) Setting a low , say, 1 month, we are able to capture events related to tourist migration, see Figure 1, (ii) setting to around 3 months, we find patterns related to Erasmus student migration around Europe, as seen in Figure 2, and (iii) setting to 5 or more, we find patterns related to long term migration, see Figure 3.333Due to lack of space, we only show one component. The remaining components also contain meaningful information, and can be seen here https://www.dropbox.com/sh/9jyxddxzrd4kcwb/AADXvcBHMKk_HSosOyoUYknBa?dl=0.
Discussion Our paper shows the potential of the application of tensor decomposition methods to get insights from large scale human migration on Twitter. Our results show that this could be a useful tool to summarizing large volumes of complex interactions, which can be inspected by domain experts to take further action. We restricted ourself to three modes, for simplicity of presentation. We can easily incorporate more modes, like topics being discussed by the users tweets, to get an understanding on what the migrating users speak about.
References
- [1] H. Fanaee-T and J. Gama. Tensor-based anomaly detection: An interdisciplinary survey. Knowledge-Based Systems, 98:130–147, 2016.
- [2] B. Hawelka, I. Sitko, E. Beinat, S. Sobolevsky, P. Kazakopoulos, and C. Ratti. Geo-located twitter as proxy for global mobility patterns. Cartography and Geographic Information Science, 41(3):260–271, 2014. PMID: 27019645.
- [3] T. G. Kolda and B. W. Bader. Tensor decompositions and applications. SIAM review, 51(3):455–500, 2009.
- [4] A. Schein, J. Paisley, D. M. Blei, and H. Wallach. Bayesian poisson tensor factorization for inferring multilateral relations from sparse dyadic event counts. In Proceedings of the 21th ACM SIGKDD International Conference on Knowledge Discovery and Data Mining, KDD ’15, pages 1045–1054, New York, NY, USA, 2015. ACM.
- [5] E. Zagheni, V. R. K. Garimella, I. Weber, et al. Inferring international and internal migration patterns from twitter data. In Proceedings of the 23rd International Conference on World Wide Web, pages 439–444. ACM, 2014.