Plasmonic properties of refractory titanium nitride
Abstract
The development of plasmonic and metamaterial devices requires the research of high-performance materials, alternative to standard noble metals. Renewed as refractory stable compound for durable coatings, titanium nitride has been recently proposed as an efficient plasmonic material. Here, by using a first principles approach, we investigate the plasmon dispersion relations of TiN bulk and we predict the effect of pressure on its optoelectronic properties. Our results explain the main features of TiN in the visible range and prove a universal scaling law which relates its mechanical and plasmonic properties as a function of pressure. Finally, we address the formation and stability of surface-plasmon polaritons at different TiN/dielectric interfaces proposed by recent experiments. The unusual combination of plasmonics and refractory features paves the way for the realization of plasmonic devices able to work at conditions not sustainable by usual noble metals.
I Introduction
Plasmons, i.e. collective excitations of the electron density, control the high frequency electromagnetic response of materials as they affect their intrinsic dielectric and refractive properties, along with the screening and the amplification of the external fields at surface boundaries.Mai ; Andrew and Barnes (2007) Plasmonic resonances can couple with electromagnetic fields and either propagate along extended interfaces as Surface Plasmon Polaritons (SPPs) or being localized at nanoscale surfaces as Localized Surface Plasmon Resonances (LSPRs).Pitarke et al. (2006) The potential applications of these phenomena cover many interdisciplinary areas, including nanophotonics,Giannini et al. (2011); Delacour et al. (2013) electronics,Walters et al. (2010); Du et al. (2016) telecommunications,Kim et al. (2013); Lu et al. (2015) nanomechanics,Soavi et al. (2016); Wang et al. (2016) photochemistry,Gao et al. (2011); Nordlander (2014) energy conversion Li et al. (2015); Atwater and Polman (2010) and quantum technology,Gramotnev and Bozhevolnyi (2010); Pelton (2015) since they can be exploited as quantum emitters, nanoantennas, optical detectors, sensors, data storage, and energy harvesting devices. It is thus clear why the research of plasmonic materials active in the IR-visible range has fostered such a huge effort in the fields of physics and material science.
An ideal plasmonic material should have tunable plasma frequency, low energy loss, high chemical, mechanical and thermal stability, low cost and high integrability with existing CMOS (complementary metal-oxide semiconductor) technology. Obviously, gathering together all these properties in a single material is not trivial, and depending on the specific application specific features are preferred. For example, because of their plasmonic response in the visible range, the high chemical stability, and biocompatibility, noble metals (especially Au and Ag) are considered the plasmonic materials per excellence, and have been largely used for biological sensing, Zeng et al. (2014) waveguiding,Oulton et al. (2008) energy transfer processes,Cushing et al. (2012) light-harvesting.Linic et al. (2011) However, the high negative permittivity and high energy losses prevent their use as hyperbolic metamaterials in the visible range; moreover the chemical softness and the low melting points make noble metals unsuitable for applications in high temperature and strong light illumination regimes, such as thermophotovoltaicFan (2014) and photothermoelectricKraemer et al. (2011); Catellani et al. (2015), heat-assisted magnetic recordingChallener et al. (2009) systems. Thus, while the tunability of the plasma frequency of noble metals can be partially improved by changing the geometry, the size and the intermetallic composition of the samples, other properties related to the thermal and mechanical stability or to the growth conditions impose to find alternative materials.Naik et al. (2013)
In order to overcome these problems, a new class of refractory ceramics (e.g. TiN, TiC, ZnN) has been proposed as promising plasmonic materials in the visible and infrared (IR) range.Naik et al. (2014a) Being refractory these compounds exhibit an extraordinary mechanical stability over a large range of temperatures (C) and pressures (3.5 Mbar), well above the melting point of standard noble metals (C). These materials are also resistant to corrosion and compatible to silicon technology. Among these, titanium nitride has optical and plasmonic properties (color, electron density, plasmon frequency) very similar to gold and has been exploited for the realization of waveguides,Naik et al. (2012) broadband absorbers,Li et al. (2014) local heaters,Guler et al. (2013) and hyperbolic metamaterials,Naik et al. (2014b); Saha et al. (2014) in connection with selected dielectric media (e.g. MgO, AlN, sapphire, etc).
Even though the fundamental mechanical and optoelectronic properties of TiN have been largely studied so far from experimental and theoretical point of view,pea ; exp very little is know about its plasmonic behaviour. Here, we present a fully first-principles investigation, based on time dependent density functional theory (TDDFT), of the plasmon properties of stoichiometric titanium nitride. The microscopic origin of plasmonic excitations in the different range of the electromagnetic spectrum are analyzed in terms of the fundamental collective and/or radiative excitation of TiN electronic structure. In particular, from the simulation of energy loss spectra at different momentum transfer we derivate the TiN plasmon dispersion relations that are a fingerprint of the material and are directly accessible by experimental measurements. Further, the comparison between simulated dispersion curves and ideal free-electron model allows us to investigate the origin of the dissipative behavior of the material, which is an unavoidable prerequisite for any realistic application. We further demonstrate the retention of TiN optical properties against the applied pressure and we prove a universal scaling law that relates the bulk modulus and the plasmonic properties of TiN. Finally, we present the analysis of the surface-plasmon polaritons of TiN when interfaced with dielectric materials as proposed for the realization of hyperbolic metamaterials and waveguides. The similarities and the differences with other noble metals, in particular with gold, are thoroughly discussed all along the paper.
II Computational Details
Electronic structure calculations were carried out by using a first principles total-energy and forces approach based on density functional theory (DFT), as implemented in the Quantum-Espresso suite of codes.Giannozzi et al. (2009) PBEPerdew et al. (1996) generalized gradient approximation was adopted for parameterisation of the exchange-correlation functional. Ionic potentials were described by ultrasolt pseudopotential of Vanderbilt type.Vanderbilt (1990) Ti() and Ti() electrons were explicitly included in the valence shell. Single particle wavefunctions (charge) were expanded in plane waves up to a kinetic energy cutoff of 30 Ry (300 Ry). A uniform mesh of k-points was used to sample the 3D Bruillouin zone of TiN bulk.
Low-index TiN surfaces were simulated through periodically repeated slabs, each including 21 layers of TiN, with different lateral periodicity and orientation (namely (100), (110), Ti- and N- terminated (111)), separated in the direction perpendicular to the surface by a 12 Å layer of vacuum, to avoid spurious interactions among replica. Preliminary tests with large supercells did not evidence any surface reconstruction, thus surface calculations were then performed in a 2D unit-cell for (001) and (110) surfaces, and in a 2D unit cell for the Ti- and N-(111) surfaces. Accordingly, uniform 2D meshes of , , and k-points were used for (100), (110), and (111) surfaces, respectively.
EELS spectra were calculated by using the turboEELS code,Timrov et al. (2015) included in the Quantum-Espresso distribution. turboEELS implements a Liouville-Lanczos approach to linearized time-dependent density-functional theory, designed to simulate electron energy loss and inelastic X-ray scattering spectra in periodic systems.Timrov et al. (2013) Within the linear response approximation, this approach allows one to simulate the loss function , where is the complex dielectric function, q is the transferred momentum and is the frequency. Crystal local field effects (CLFEs) and exchange-correlation local field effects (XCLFs) Weissker et al. (2010) are both explicitly taken into account in the turboEELS code. CLFEs are particularly relevant for large transmitted q and account for non-homogeneity of the system on the microscopic scale. The optical response function , is obtained in the limit . We carefully checked that for values of Å-1 the TDDFT spectra exactly reproduce the results obtained solving an independent-particle formulation of the frequency-dependent Drude-Lorentz model for the dielectric function D’Amico et al. (2016)
The electronic properties of selected dielectrics (MgO, AlN, GaN, CeO2), considered later in the text as prototypical TiN/dielectric interfaces, have been calculated ab initio by using a recent pseudohybrid Hubbard implementation of DFT+UAgapito et al. (2015) that profitably corrects the energy bandgapAgapito et al. (2015); Gopal et al. (2015) as well as the dielectric and vibrational properties of semiconductors.Calzolari and Nardelli (2013) A novel first principles tight-binding approachD’Amico et al. (2016) was used to simulate the optical properties of dielectrics through the solution of the generalized Drude-Lorentz expression of the macroscopic dielectric function where both intraband (Drude-like) and interband (Lorentz-like) contributions are explicitly taken into account.
The simulation of the color is based on the tristimulus colorimetry theory,col ; Malcioglu et al. (2011) which provides a red (R), green (G), and blue (B) representation of the perceived hue, starting from the knowledge of an illuminant source (tabulated), the retina matching functions (tabulated) and the calculated absorption coefficient .
III Results and discussion
III.1 TiN bulk - optoelectronic properties
As a preliminary step, we characterized the electronic and optical properties of stoichiometric TiN bulk at zero temperature and zero applied pressure. At standard conditions, the differences in electronegativity and atomic size between N and Ti give rise to a compound that although metallic still preserves a partial ionicity in the bonds. The commingling of these two effects is responsible for most of the peculiar features of TiN. As many ionic compounds, TiN crystallizes in a close-packed rocksalt structure, where nitrogen occupies octahedral interstitial sites in the (fcc) Ti sublattice. The simulated lattice parameter =4.244 Å and the bulk modulus =2.7 Mbar (Table 1) perfectly reproduce the experimental values =4.242 Å and = Mbar, respectively. pea ; exp
| phase | P(Mbar) | a0 (Å) | B0 (Mbar) | (eV) |
|---|---|---|---|---|
| B1 | 0.00 | 4.244 | 2.71 | 2.50 |
| 0.25 | 4.123 | 3.52 | 2.75 | |
| 0.50 | 4.045 | 4.38 | 2.88 | |
| 0.75 | 3.981 | 5.21 | 3.00 | |
| 1.00 | 3.928 | 6.04 | 3.09 | |
| 1.25 | 3.874 | 6.99 | 3.15 | |
| 1.50 | 3.837 | 7.61 | 3.24 | |
| 2.00 | 3.765 | 9.11 | 3.34 | |
| B2 | 3.50 | 2.229 | - | 1.90 |
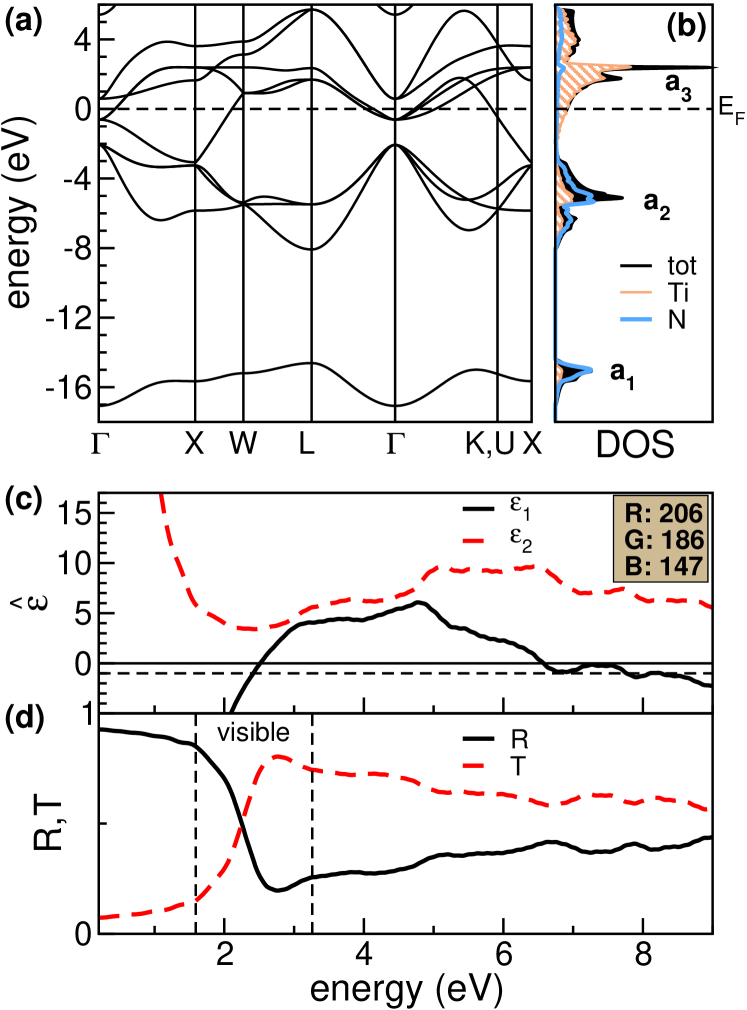
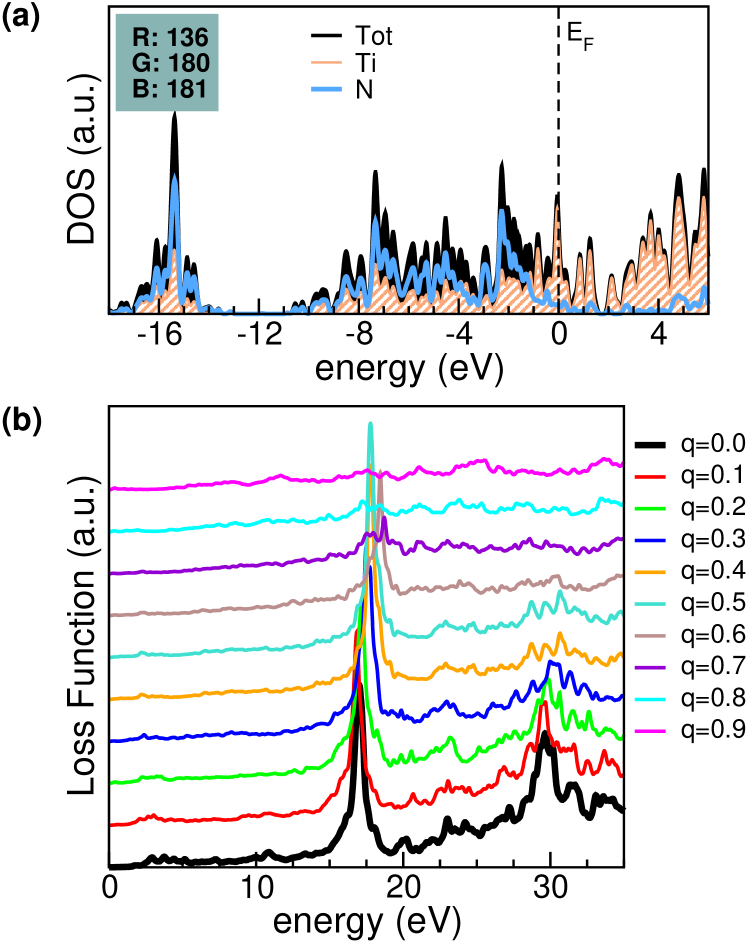
The electronic and optical properties of TiN are summarized in Figure 1. The mixed covalent-ionic character of TiN reflects in the bandstructure (panel a) where we identify 3 separate sets of bands, each with a predominant character deriving from a single constituent (ionic contribution) plus a minor contribution from the other element (covalent contribution), as evident from the total (black area) and projected (straight and dashed lines) density of states (DOS, panel b). At higher binding energies [-17.0,-14.5] eV we found a single band, with a primary N() character, marked as in Figure 1b. The energy range from -8.0 to -2.0 eV is characterized by a set of three dispersive bands (labeled ), degenerate at , which mostly derive from N() states only partially hybridized with Ti() orbitals. Finally, a bundle of five overlapping bands (labeled ) spans the energy range [-2.0, 4.0] eV, around the Fermi level (, set at zero energy). These bands are responsible for the metallicity of TiN and have a net Ti() character with a weak contribution from N() states. The three lowest-energy bands of the bundle, degenerate at , cross the Fermi level at several points of the Brillouin Zone (BZ), giving rise to a multi-pocket Fermi surface. The sharp peak in the DOS (panel b) at 2 eV above the Fermi level originates in one of these three bands that run almost flat for a large portion of the BZ (e.g X-W-L directions). Our results reproduce previous bandstructure calculations obtained with different techniques, such as tight-binding models Margine et al. (2011) or first principles full-potential linear muffin-tin orbital Delin et al. (1996); Ahuja et al. (1996) and full-potential linearized augmented plane wave Stampfl et al. (2001) density functional methods. Further, the present results perfectly agree with the experimental features from UV and X-ray photoemission and Auger spectroscopies,Hochst et al. (1982); Walker et al. (1997) which identify a nitrogen band at 16 eV binding energy, a double-peaked N()-Ti() contribution at [7.0, 3.0] eV binding energy and a metallic band arising at 2.5 eV binding energy up Fermi level.
The optical properties of TiN are characterized by the complex dielectric function at q=0, i.e. . The calculated real (, straight line) and immaginary (, dashed line) part of the dielectric function are shown in Figure 1c. The imaginary part diverges for , this corresponds to a finite dc conductivity of metals (), in agreement with experimental results.Patsalas and Logothetidis (2001) is generally negative up to =25.4 eV, which corresponds to the unscreened plasma () frequency of the system, and reflects the metallic nature of TiN. TiN, however, is not a simple free-electron metal like Na or Al, since the presence of inter-band transitions makes slightly positive in the ranges [2.5, 6.5] eV and [12.0, 18.0] eV (see discussion below). These features of the dielectric function have been observed in previous theoretical Kim et al. (2011) and experimental works, based on different techniques such as optical spectroscopic ellipsometry (SE), Wiemer et al. (1994); Patsalas and Logothetidis (2001); Langereis et al. (2009) optical reflectancePerry et al. (1988) and electron energy loss spectroscopy (EELS) with vanishing momentum transfer.Walker et al. (1997); Pflüger et al. (1984) In particular, Patsalas and coworkers Patsalas and Logothetidis (2001), on the basis of SE measurements, provided a one-to-one connection between interband contributions to and optical transitions at high symmetry points of the Brillouin Zone (, X, L), responsible for absorption peaks at 2.3, 3.9 and 5.6 eV, in perfect agreement with the multi-structured positive peak in the , shown in Figure 1c. In an alternative way, J. Pfluger et al. Pflüger et al. (1984) converged at the same results, interpreting these inter-band contributions in terms of a semiempirical model, where the low-energy tail of a Lorentz oscillator - centred at E=7 eV and associated to p-d transitions - is responsible to the positive values of in the range [2.5, 7.0] eV.
A positive along with a non-zero in the visible range implies that the compound can absorb light in the blue-region of the spectrum, imparting to TiN its characteristic gold-like color, as shown in the inset of panel 1c. The behaviour of the dielectric function affects also the reflectivity (R) and the transmittivity (T) of the sample. At normal incident conditions R and T are defined as:
| (1) | |||||
where
| (2) | |||||
are the real (n) and imaginary (k) part of the complex refractive index . From Figure 1d, R is almost 1 in the IR and in part of the visible region, then it decays abruptly in correspondence of the energy =2.5 eV, for which becomes positive. Thus, for light can pass through the material, which is no more perfectly reflecting. Experimental energy loss experiments Pflüger et al. (1984) confirm the high TiN reflectivity up to 2.5 eV. The fact that T does not tend to 1 but rather decreases at higher energies (e.g. 4-9 eV) indicates that the TiN is not fully transparent in the UV. This is a further indication that TiN is not a free-electron metal, but a partially lossy material where absorption processes take place over a large section of the electromagnetic spectrum.
III.2 TiN bulk - plasmonic properties
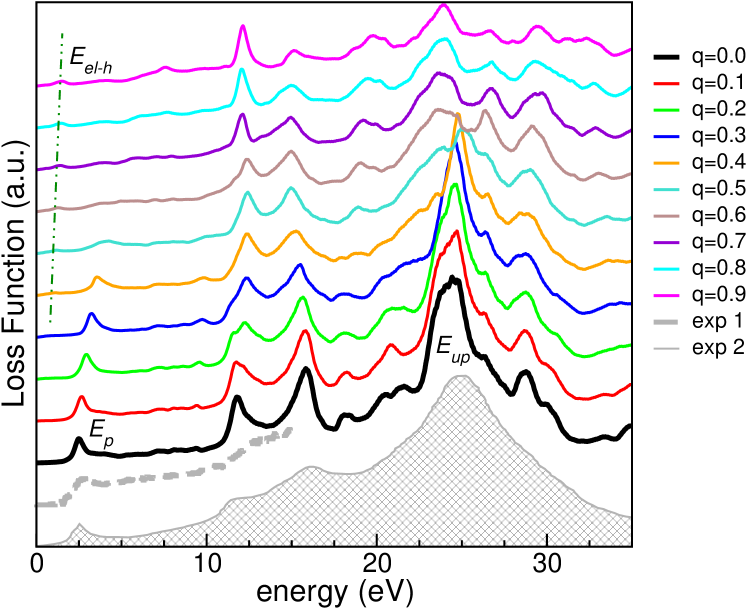
The simulated (TDDFT) energy loss functions for increasing momentum transfer q are shown in Figure 2, along with two independent sets of experimental data for q=0, collected with EELS-TEM apparatus in ultra high vacuum,Pflüger et al. (1984); Herzing et al. (2016) superimposed for a direct comparison. The dominant feature in loss function spectra for q=0 (black line= simulation, gray lines=experiments) is a broad peak at =25.4 eV, which corresponds to the volume plasmon. At this energy, the incident electric field is so high that the excited sample electrons behave as free (unscreened) electrons, no more screened by the crystal field. Thus, we can express Eup in terms of the Drude-like plasma frequency , where is the electron charge, the dielectric permittivity of vacuum and the electron mass. By inverting we can extract the total free-electron density e/cm3, in agreement with experimental values ( e/cm3).Pflüger et al. (1984)
Apart from this main peak, we identify other plasmonic features at lower energies. Particularly relevant for optoelectronic applications is the plasmon excitation in the visible range that we found at =2.5 eV, very close to the experimental one at 2.8 eV.Pflüger et al. (1984); Herzing et al. (2016) The origin of this resonance derives from the interplay between inter- and intra-band transitions that can be easily interpreted in terms of the electronic structure of Figure 1. For energies lower than 2.5-3.0 eV, the only possible excitations of the valence electrons are due to intra-band transitions through the Ti() bands that cross the Fermi level (bands ). A pure optical transition would be symmetry forbidden (i.e. vanishing ); in this case, the partial coupling with the N() states slightly relaxes the sum rule, but still gives very low contribution to optical absorption, i.e. not zero but still small . As the excitation energy is increased, inter-band transitions from N() to Ti() take place (). This creates a dielectric screening, which results in the zero cross-over from negative to positive of at =2.5 eV. At this energy and have a minimum (see Figure 1c), thus as a consequnce the loss function has a peak. This is interpreted as a screened plasmon, which involves the collective oscillation of a reduced charge density , since only a fraction of the total valence electrons can be considered as free, the rest being effectively screened.
At higher energy the inter-band transitions prevail, the imaginary part (i.e. the absorption coefficient) increases and the loss function rapidly decreases, in agreement with the trend of R and T in Figure 1d. Similar behavior of the dielectric and loss functions characterize the optical properties of other plasmonic materials, such as noble metals and gold in particular, as confirmed by the gold-like color of TiN. However, in the case of noble metals the intraband transitions are due to the -band that crosses the Fermi level, and the inter-band transitions are due excitations. In the present case the open shell of Ti and the coupling with N further complicates the scenario. In a similar way, the double peaked EELS feature in the [12.0-18.0] eV range, derives from multiple transitions from and valence bands to conduction bands.
Figure 2 furthermore shows the evolution of the loss function for different transferred momenta. All the plasmon resonances undergo a significant broadening and a positive dispersion as the modulus q is increased. As plasmons are longitudinal excitations of the electronic system, their eigenvalues can be derived from the zeros of the longitudinal dielectric function . The dispersion relation can be expressed as an expansion of as:
| (3) |
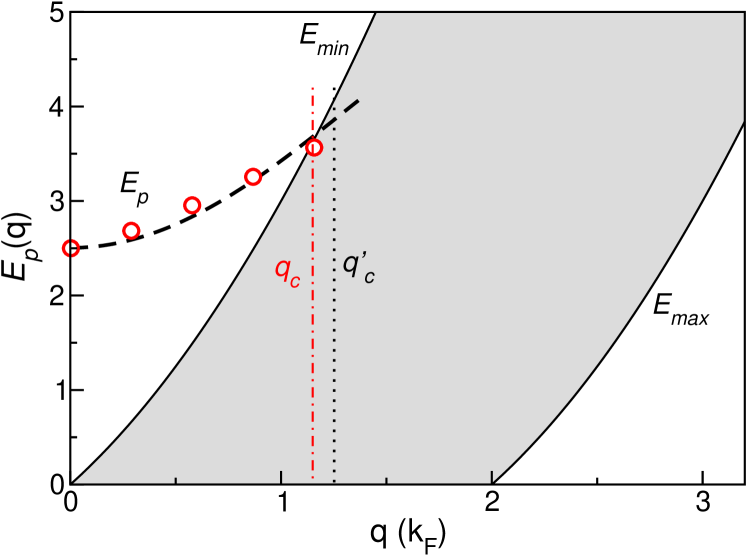
where is the plasmon energy for q=0. Depending on the model used to describe (such as Lindhard, jellium model, RPA, etc)Egerton (2011) the range of validity of Eq. 3 and the physical meaning/expression of coefficients and may be slightly different, since they include different amount of the kinetic and exchange-correlation contributions. Serra et al. (1991) For instance, in the free-electron approximation the dispersion relation is quadratic in the transferred momentum and the coefficient is proportional to electronic polarizability. Our TDDFT results also follow the theoretical trend of Eq. 3: from the fit of the lowest-energy plasmon resonances of Figure 2 we obtain =4.39 eVÅ2 and =-3.25 eVÅ4. However, even though the parabolic term is dominant (see dashed line in Figure 3), no good fit can be obtained for TiN without the inclusion of the fourth-order term. Moreover, in the case of TiN the quadratic term cannot be simply associated to the electron gas polarizability, as it includes a non-trivial screening normalization, which derives from the interband transitions.
The upward energy dispersion goes hand in hand with the broadening and the reduction of the intensity of the plasmonic peak. Figure 2 clearly shows that for values of momentum transfer larger than (0.59 Å-1, orange curve), the plasmon peak is quenched, while other features, such as the one marked as in Figure 2, arise in different regions of the spectrum. Indeed, low-intensity contributions are mostly due to single-particle interband transitions among bands, that are optically active only when mediated by an external momentum, while are dark for q=0.
More generally, above a certain critical momentum plasma oscillations are heavily damped because plasmons can transfer their energy to single electrons that dissipate energy undergoing electron transitions among the manyfold of bands crossing the Fermi level. In a free electron gas model the critical momentum is defined as , where and is the Fermi velocity of the system. For a real metal with a complex Fermi surface (such as TiN), does not have a trivial analytical expression. This prevents to predict a theoretical value of to be compared with the one extracted from Figure 2.
In order to overcome this point, we model TiN as a Drude-like system having the reduced screened charge density which is associated to the calculated , instead of the total charge density , responsible of the plasmonic peak at =25.4 eV. We remark that this is a crude approximation not justified a priori, since TiN is not actually an ideal free-electron system. However, this assumption allows us to interpret - in terms of simple parameters - the peculiar properties of the plasmon , which is the most interesting for plasmonic applications; albeit the same analysis can not be extended to the overall properties of the material. From this model, the simulated plasmon relation (red circles in Figure 3) can be discussed in relation to the ideal single-particle region, whose extrema and , can be derived from the momentum conservation rules, as described in many textbooks.woo Indeed, the plasmon decays rapidly into the electron-hole pair region, while it is stable outside; the intersection between the plasmon dispersion curve and the electron-hole region defines the critical momentum.
To pursue further this free-electron model, the Fermi surface reduces to a sphere of radius , the screened charge density is e/cm3 and the theoretical critical momentum results Å-1. Gray shaded area in Figure 3 covers the range of allowed single-particle excitations. The TDDFT plasmon dispersion matches quite well the model trend, even though the fact that indicates once more the relevance of dissipative effects of the interband transitions.
Summarizing, the present analysis confirms that under standard conditions TiN has optoelectronic properties to many extent similar to gold. In particular the low-energy plasmonic excitation and the low (although not zero) characterize TiN as a relatively low-loss plasmonic material, useful for application in the visible range. The overall plasmonic properties result from the complex balance between intraband and interband transitions that act as screening term of the global electron gas.
III.3 TiN bulk under pressure
One of the most attracting characteristics of refractory materials is their mechanical resistance along with the retention of the optical properties over a large range of applied pressures. From the experimental datapea ; exp we know that for pressures Mbar TiN crystallizes in a rocksalt structure ( phase), while at higher pressures TiN undergoes a phase transition to a CsCl-type structure ( phase). Phase transition is associated to drastic internal pressure reduction and a consequent volume collapse. Here, we do not investigate the phase transition process, which has been largely studied by many authors.Ahuja et al. (1996); Mishra et al. (2015); Yang et al. (2016) We focus, instead, on the modifications of the plasmon properties as a function of the applied pressure for and structure, separately.
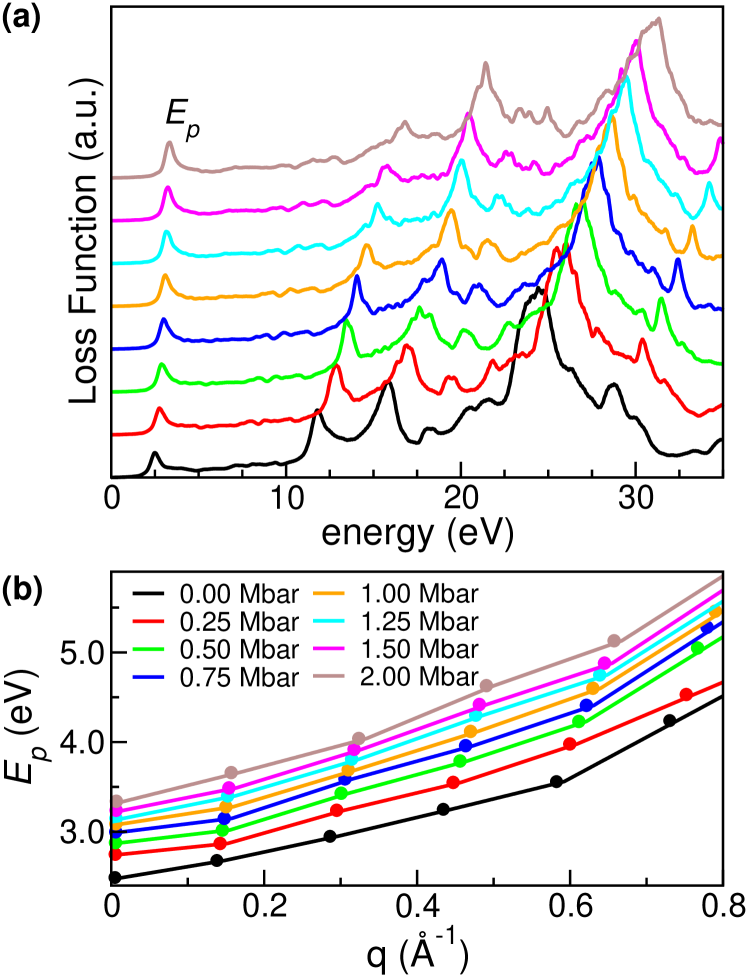
We first characterized the TiN plasmon dispersion for a set of increasing pressures below the transition one (namely 0.25, 0.50, 0.75, 1.00, 1.25, 1.50 and 2.00 Mbar), i.e. within the phase. The corresponding variation of structural parameters (a0 and B0) was then obtained from a set of self-consistent DFT calculations at different volumes. Results are summarized in Table 1. The increase of causes the progressive shrinking of the valence band width, while it does not affect the shape and the symmetry of the , and bands, discussed in Figure 1. The modifications of the electronic structure affect the loss function spectra, as shown in Figure 4a. For all the simulated values of , the loss spectra exhibit the same features, albeit shifted at higher energies. This is particularly evident for the volume plasmon in the UV, as the reduction of the crystal volume with pressure induces an enhancement of the total charge density and thus of the unscreened peak . The blue energy shift is, instead, less pronounced for the lowest energy plasmon , since the shrinking of the and bands partially compensate the increase of the charge density. The same trend is detected also for the plasmon energy dispersion at each applied pressure (Figure 4b), which maintains the quasi-parabolic behavior discussed above. This confirms that, except for minor details, TiN maintains its characteristic plasmonic properties over a wide range of applied pressures, opening the way for a large set of promising applications, for which standard plasmonic materials can not be used.
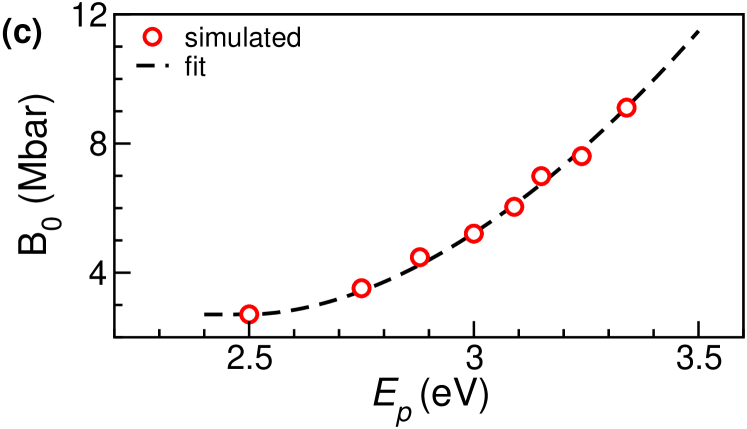
In their seminal paper, Oleshko and HoweOleshko and Howe (2007) demonstrated a universal scaling relationship that correlates the elastic properties of solid-state materials with (quasi) the square of the plasmon energy. Here we extend this relationship to the case of the bulk modulus at different applied pressures. The plot of bulk modulus B against the plasmon energy at zero momentum transfer is shown in Figure 4c. Red circles are the TDDFT simulated data, as reported in Table 1; the dashed line results from the fit of the same data with the power law expression:
| (4) |
where Mbar is the bulk modulus at zero applied pressure. The best fit is obtained for c=8.78 and =1.85, very close to the ideal value =2.0 and in perfect agreement with the experimental results by Oleshko and Howe ().Oleshko and Howe (2007) This is an important results as it can be used as an analytical tool to quantify the modifications of the mechanical properties via optical plasmon measurements, in particular in the case of defected and/or substoichiometric TiNx compounds.
Finally, we investigated the plasmon properties of TiN in the crystal structure at high pressure (3.5 Mbar). The results are summarized in Table 1 and Figure 5. The transition from NaCl to CsCl structure implies a reduction of the Ti-N length from 2.12Å to 1.93Å and an enhancement of the covalent contribution to bond. DOS spectra in panel 5a further exhibit remarkable modifications both in the shape and in the energy distribution: the previous peaks and now largely overlap to form a unique broad band that covers the range -11.0 to +5.0 eV. In particular, a sharp peak with a net Ti() character dominates the energy region across the Fermi level, while a prevalent N() peak arises at 2.0 eV below the Fermi energy. The close presence of these two peaks has a critical effect on the optical properties of the system as it drastically lowers the threshold of the inter-band transitions that now lies at the edge between the infrared and visible ranges. The system thus changes its color from goldish to cyanish (see inset of panel a). As the absorption spectrum has a maximum in the long-wavelength part of the visible spectrum, which corresponds to red, the perceived color is dominated by the reciprocal (less absorbed) light colors, i.e. green and blue, whose superposition is, indeed, cyan-like. The redshift of the absorption edge affects also the plasmonic properties of B2 phase under pressure. As a consequence of electron-hole transitions, the loss function at zero momentum transfer (black line, panel b) is generally broader with plasmonic features less defined than before. The lowest-energy plasmon is shifted downward at 1.90 eV and its intensity is strongly quenched with respect to B1 phase. This peak rapidly decays and it is almost totally quenched for values of q as small as Å-1 (red line in panel b). The reduction of the cell volume increases the total charge density of the system, which corresponds to a blue shift of the unscreened peak from 25.4 to 30.0 eV.
We conclude that the modifications induced by the pressure to the optoelectronic structure of the B2 phase, are detrimental for application of TiN as plasmonic material in the IR-vis range under as-high pressure conditions.
III.4 Surface Plasmons and Surface Plasmon Polaritons
The existence of surfaces and interfaces modify the optical response of materials. It is thus crucial the study of surface plasmons (SPs), which are collective oscillations bound to a metal surface. As they derive from the truncation of the bulk electron gas they are also known as 3D surface plasmons. The frequency of SP is a bulk property, while its dispersion is determined from the details of the surface electronic structure. In general, the energy of SP for a metal/dielectric (m/d) interface can be easily derived from classical electromagnetism, by imposing that the electrical and displacement field must be continuos at the interface.Pitarke et al. (2006) This leads to the nonradiative SP condition , where are the real parts of the dielectric function of the metal and dielectric bulk compounds that form the interface. In this limit, the surface plasmon does not propagate and does not decay radiatively, but appears as a charge fluctuation at the surface. In the case of open surfaces the dielectric is the air, whose dielectric constant is 1.0, and the condition for SP energy is .
For simple metals, for which the Drude-like expression for the plasma frequency is valid, the SP energy is reduced to . The energy difference between and usually corresponds to two well separate peaks in the energy loss spectra. However, for d-metals this simple relation does not hold anymore and the expression must be evaluated numerically. In the case of TiN, if we impose the condition that (dashed line in Figure 1c) we obtain eV, which fits well the experimental values from reflectivity measurements at low incident angles.Chen et al. (2011) However, such SP energy is so close to the bulk value (2.5 eV) to be actually indistinguishable in the experimental spectra. This is, again, one of the effects of interband transitions that make the slope of much more steep than the ideal (Drude-like) lorentzian one. A similar behavior is observed in the case of Ag surfaces, where a unique loss peak is superimposed to a structureless background due to interbad transitions.Rocca (1995)
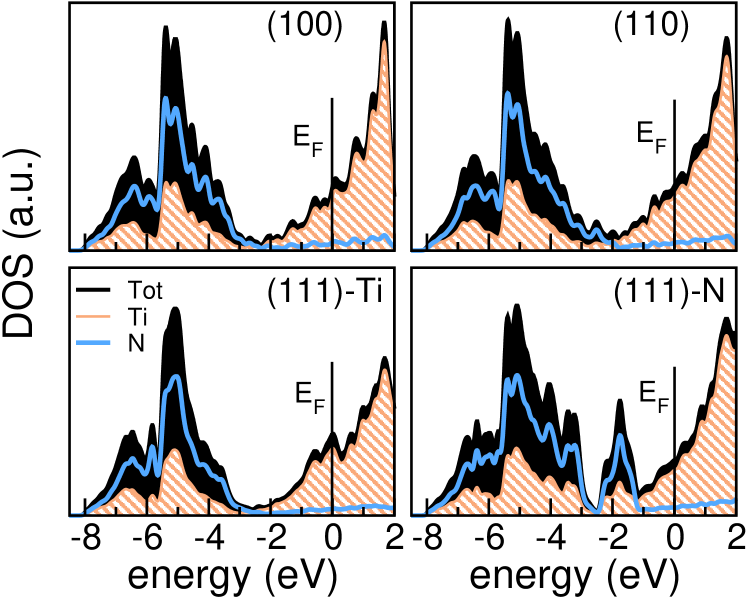
In order to elucidate this statement, we explicitly calculated the electronic structure for a set of low-Miller-index surfaces, namely (100), (110), and (111). (100) and (110) faces expose an equal number of Ti and N atoms, while (111) surfaces are terminated either with Ti or with N atoms at both slab ends; no mixed Ti/N terminations of simulated slab were considered, in order to avoid spurious electric fields in the vacuum region of the cell. After full atomic relaxation, all structures undergo only minor relaxations of the outermost layers, in agreement with previous theoretical calculations.Marlo and Milman (2000); Mehmood et al. (2015)
The corresponding electronic structures are collected in Figure 6, where the similarities with bulk are evident. eel The only notable differences regard the (111) surfaces: in the Ti-terminated case there is a net enhancement of the Ti() contribution at the Fermi level, while the N-terminated surface is characterized by N() peak at eV, not observed in the other systems. In the latter case, the absence of Ti in the outermost layers slightly reduces the spilling of charge on the surface. The analysis of the projected bandstructures (not shown) indicates the presence of surface states in restricted regions (lenses) across the edges of the 2D Brillouin zone, while no surface states are present in the proximity of the centre of the 2D Brillouin zone (). In addition, we do not identify any parabolic-like surface state at the Fermi level. This seems to exclude the formation of a 2D electron gas confined to the surface plane, eel and thus the possibility to excite 2D surface plasmons with acoustic linear dispersion.Diaconescu et al. (2007); Park and Palmer (2010); Pohl et al. (2010) Dedicated surface EELS experiments are requested to confirm this point. We can conclude that surface truncation does not substantially modify the main electronic properties of the bulk and in particular the energy position N() peak with respect to the Fermi level, which is the main responsible for dissipative interband transitions in TiN.
The dissipative contributions to TiN surfaces have also a critical effect on the stability and the spatial properties of surface-plasmon polaritons at the TIN/dielectric interfaces. SPPs are mixed oscillatory modes, generated by coupling between incident light radiation and surface charge fluctuations. SSP can propagate along a metal/dielectric interface when the condition:
| (5) |
is satisfied, where is the wavevector parallel to metal surface, along the propagation direction, are the complex dielectric functions of the metal and the dielectric bulks, and is the light velocity in vacuum. For non-dissipative materials is real and the SPP dispersion curve has the typical behavior with a divergence at and a forbidden gap for . Within this range is a purely imaginary number, prohibiting that the wave propagation exists. For (Brewster branch) the metal becomes transparent to the incoming radiation, and the excited wave is no more confined at the interface. For (bound SPP region) the polaron propagates with a wavevector larger than light in the dielectric at the same energy and the SPP can not decay radiatively emitting photons. At large wavevectors SPP yields the nonradiative SP limit.
| MgO | AlN | GaN | CeO2 | |
|---|---|---|---|---|
| Eg | 7.46 | 6.02 | 2.85 | 2.45 |
| 1.8 | 3.8 | 5.9 | 9.5 |
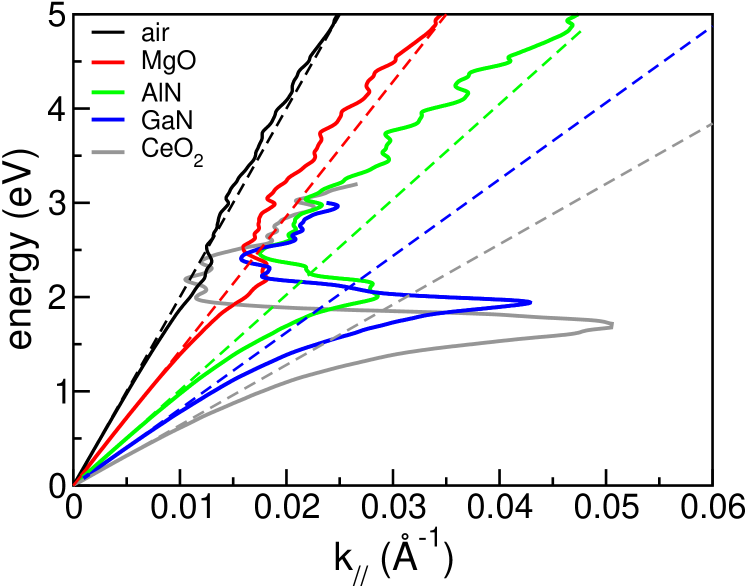
In the case of TiN the assumption that is real does not hold and the dissipative effects described by the imaginary part of the dielectric function must be taken into account. Figure 7 shows the dispersion relations of SPP (solid lines) for a set of TiN/dielectric interfaces, along with the dispersion relations of light in the corresponding dielectrics. We considered materials that have been eventually used to realize SPP and metamaterial interfaces with TiN,Herzing et al. (2016); Saha et al. (2014); Li et al. (2014); Naik et al. (2012, 2014b); Patsalas and Logothetidis (2003) namely MgO, AlN, GaN, and we compared the results with the limiting cases of air and CeO2 which have very low and very high dielectric constant, respectively. The simulated results of energy bandgap and dielectric constant for these compounds are summarized in Table 2. As the range of interest of TiN/dielectric interface is the Near-IR/visible range, we assumed as the high frequency dielectric constant of materials, i.e. without the inclusion of the LO-TO phonon contribution that is relevant in the far-IR and lowest energy part of the electromagnetic spectrum.
The inclusion of the dissipation term strongly changes the character of the dispersion relation. Although for very low energy, the SPP approaches the corresponding light line, as in the ideal case, in the vicinity of the surface plasmon energy the dispersion curve bends back toward the light line instead of increasing asymptotically to the surface plasmon energy at infinite momentum. This defines a maximum value () for the excitation of SPP. For energy slightly above the dispersion curve of the bound SPP, is no more purely imaginary and a quasi-bound SPP exists in place of the ideal plasmon-gap. In this energy range, the SPP has a backward group velocity and eventually evolves into the so-called radiative plasmon mode at low , where it crosses the photon dispersion line (transition energy).
The simulated dispersion relations of Figure 7 show an increase of the stability of SPP at TiN/dielectric interfaces, as the dielectric constant is increased. In the case of air, the SPP dispersion actually does not move away from the light line degrading in a radiative mode at very low , in agreement with the experimental results.Naik et al. (2012) Thus, air is not able to stabilize a SPP at the TiN surface, and the TiN/air interface is not suitable for realistic applications. However, as is increased, the SPP can be progressively stabilized, giving rise to oscillating waves that propagate along the metal surface, with a wavevector sensitively larger than light (i.e. non radiative mode). MgO and nitride compounds (AlN and GaN) in particular seem the best choices for the generation of SPP in TiN, in agreement with the recent experimental studies on these interfaces.Saha et al. (2014); Naik et al. (2014b); Patsalas and Logothetidis (2003) Indeed, even though highly dielectric materials such as CeO2 assure a very dispersive energy dispersion relation and large , the increase of the dielectric constant sensitively lowers the transition energy, over which the SPP decays radiatively. The dissipation becomes even more dramatic when the excitation energy overcomes the energy bandgap of the dielectric. In this case, the dielectric is no more transparent and it absorbs light through valence-to-conduction single particle transitions. This limits the application potential of interfaces of TiN with extreme high-k dielectrics, such as ceria.
IV Conclusions
We presented a comprehensive theoretical investigation of the plasmonic properties of refractory titanium nitride. Our ab initio results confirm that at standard conditions TiN exhibits plasmonic properties in the visible and near-IR regime, very close to gold, in agreement with the experimental data. However, in contrast with malleable noble metals, the hardness of refractory ceramics allows for the exploitation of plasmonic properties also at high temperature and under pressure. We have deeply investigated this latter characteristic also in relation to the crystal phase transition, experimentally observed at very high pressure. The microscopic origin of the plasmon resonances and their dispersions have been discussed on the basis of the analysis of the electronic structure and of the reciprocal interplay between collective and single-particle excitations, which determine the screening and dissipation effects of the electronic system. We furthermore propose a rule to optimize interfaces with dielectrics for metamaterial applications.
The characteristics of TiN, such as stability, reduced energy loss, and zero-cross over in the IR-visible range, promote refractory materials as a promising alternative for the realization of advanced optoelectronic applications, for which standard plasmonic materials cannot be used.
References
- (1) S. A. Maiern, Plasmonics: Fundamentals and Applications, 2007 Springer Science+Business Media LLC, New York, NY, USA.
- Andrew and Barnes (2007) W. A. Andrew and W. L. Barnes, Adv. Mater. 19, 3771 (2007).
- Pitarke et al. (2006) J. M. Pitarke, V. M. Silkin, E. V. Chulkov, and P. M. Echenique, Rep. Progr. Phys. 70, 1 (2006).
- Giannini et al. (2011) V. Giannini, A. I. Fernandez-Dominguez, S. C. Heck, and S. A. Maier, Chem. Rev. 111, 3888 (2011).
- Delacour et al. (2013) C. Delacour, S. Blaize, P. Grosse, J. M. Fedeli, A. Bruyant, R. Salas-Montiel, G. Lerondel, and A. Chelnokov, Nat. Phys. 9, 329 (2013).
- Walters et al. (2010) R. J. Walters, R. V. A. van Loon, I. Brunets, J. Schmitz, and A. Polman, Nature Mater. 9, 21 (2010).
- Du et al. (2016) W. Du, T. Wang, H.-S. Chu, L. Wu, R. Liu, S. Sun, W. K. Phua, L. Wang, N. Tomczak, and C. A. Nijhuis, Nat. Phot. 10, 274 (2016).
- Kim et al. (2013) H. Kim, M. Osofsky, S. M. Prokes, O. J. Glembocki, and A. Piqué, Applied Physics Letters 102, 171103 (2013).
- Lu et al. (2015) H. Lu, B. P. Cumming, and M. Gu, Opt. Lett. 40, 3647 (2015).
- Soavi et al. (2016) G. Soavi, I. Tempra, M. F. Pantano, A. Cattoni, S. Collin, P. Biagioni, N. M. Pugno, and G. Cerullo, ACS Nano 10, 2251 (2016).
- Wang et al. (2016) G. Wang, X. Chen, S. Liu, C. Wong, and S. Chu, ACS Nano 10, 1788 (2016).
- Gao et al. (2011) S. Gao, K. Ueno, and H. Misawa, Acc. Chem. Res. 44, 251 (2011).
- Nordlander (2014) P. Nordlander, Science 343, 1444 (2014).
- Li et al. (2015) J. Li, S. K. Cushing, F. Meng, T. R. Senty, A. D. Bristow, and N. Wu, Nat. Phot. 9, 601 (2015).
- Atwater and Polman (2010) H. A. Atwater and A. Polman, Nat. Mater. 9, 205 (2010).
- Gramotnev and Bozhevolnyi (2010) D. K. Gramotnev and S. I. Bozhevolnyi, Nat. Phot. 4, 83 (2010).
- Pelton (2015) M. Pelton, Nat. Phot. 9, 427 (2015).
- Zeng et al. (2014) S. Zeng, D. Baillargeat, H.-P. Ho, and K.-T. Yong, Chem. Soc. Rev. 43, 3426 (2014).
- Oulton et al. (2008) R. F. Oulton, V. J. Sorger, D. A. Genov, D. F. P. Pile, and X. Zhang, Nat. Phot. 2, 496 (2008).
- Cushing et al. (2012) S. K. Cushing, J. Li, F. Meng, T. R. Senty, S. Suri, M. Zhi, M. Li, A. D. Bristow, and N. Wu, J. Am. Che. Soc. 134, 15033 (2012).
- Linic et al. (2011) S. Linic, P. Christopher, and D. B. Ingram, Nat. Mater. 10, 911 (2011).
- Fan (2014) S. Fan, Nat. Nanotechnol. 9, 92 (2014).
- Kraemer et al. (2011) D. Kraemer, B. Poudel, H.-P. Feng, J. C. Caylor, B. Yu, X. Yan, Y. Ma, X. Wang, D. Wang, A. Muto, K. McEnaney, M. Chiesa, Z. Ren, and G. Chen, Nat. Mater. 3, 532 (2011).
- Catellani et al. (2015) A. Catellani, A. Ruini, M. B. Nardelli, and A. Calzolari, RSC Adv. 5, 44865 (2015).
- Challener et al. (2009) W. A. Challener, C. Peng1, A. V. Itagi, D. Karns, W. Peng, Y. Peng, X. Yang, X. Zhu, N. J. Gokemeijer, Y.-T. Hsia, G. Ju, R. E. Rottmaye, M. A. Seigler, and E. C. Gage, Nat. Photonics 3, 220 (2009).
- Naik et al. (2013) G. V. Naik, V. M. Shalaev, and A. Boltasseva, Adv. Mater. 25, 3264 (2013).
- Naik et al. (2014a) G. V. Naik, V. M. Shalaev, and A. Boltasseva, Science 344, 263 (2014a).
- Naik et al. (2012) G. V. Naik, J. L. Schroeder, X. Ni, A. V. Kildishev, T. D. Sands, and A. Boltasseva, Opt. Mater. Express 2, 478 (2012).
- Li et al. (2014) W. Li, U. Guler, N. Kinsey, G. V. Naik, A. Boltasseva, J. Guan, V. M. Shalaev, and A. V. Kildishev, Adv. Mater. 26, 7959 (2014).
- Guler et al. (2013) U. Guler, J. C. Ndukaife, G. V. Naik, A. G. A. Nnanna, A. V. Kildishev, V. M. Shalaev, and A. Boltasseva, Nano Lett. 13, 6078 (2013).
- Naik et al. (2014b) G. V. Naik, B. Saha, J. Liu, S. M. Saber, E. A. Stach, J. M. K. Irudayaraj, T. D. Sands, V. M. Shalaev, and A. Boltasseva, Proc. Nat. Ac. Sci. 111, 7546 (2014b).
- Saha et al. (2014) B. Saha, G. V. Naik, S. Saber, C. Akatay, E. A. Stach, V. M. Shalaev, A. Boltasseva, and T. D. Sands, Phys. Rev. B 90, 125420 (2014).
- (33) W. B. Pearson, Structure reports: TiN, vol. 11, Oosthoek, Scheltema and Holkema for International Union of Crystallography, Utrecht (1993).
- (34) V. A. Gubanov, A. L. Ivanovsky and V. P. Zhukov. Electronic Structure of Refractory Carbides and Nitrides, Cambridge University Press, Cambridge (1994).
- Giannozzi et al. (2009) P. Giannozzi, S. Baroni, N. Bonini, M. Calandra, R. Car, C. Cavazzoni, D. Ceresoli, G. Chiarotti, M. Cococcioni, I. Dabo, A. Dal Corso, S. De Gironcoli, S. Fabris, G. Fratesi, R. Gebauer, U. Gerstmann, C. Gougoussis, A. Kokalj, M. Lazzeri, L. Martin-Samos, N. Marzari, F. Mauri, R. Mazzarello, S. Paolini, A. Pasquarello, L. Paulatto, C. Sbraccia, S. Scandolo, G. Sclauzero, A. P. Seitsonen, A. Smogunov, P. Umari, and R. M. Wentzcovitch, Journal of Physics: Condensed Matter 21, 395502 (2009).
- Perdew et al. (1996) J. P. Perdew, K. Burke, and M. Ernzerhof, Phys. Rev. Lett. 77, 3865 (1996).
- Vanderbilt (1990) D. Vanderbilt, Phys. Rev. B 41, R7892 (1990).
- Timrov et al. (2015) I. Timrov, N. Vast, R. Gebauer, and S. Baroni, Compt. Phys. Commun. 196, 460 (2015).
- Timrov et al. (2013) I. Timrov, N. Vast, R. Gebauer, and S. Baroni, Phys. Rev. Lett. 88, 064301 (2013).
- Weissker et al. (2010) H.-C. Weissker, J. Serrano, S. Huotari, E. Luppi, M. Cazzaniga, F. Bruneval, F. Sottile, G. Monaco, V. Olevano, and L. Reining, Phys. Rev. B 81, 085104 (2010).
- D’Amico et al. (2016) P. D’Amico, L. Agapito, A. Catellani, A. Ruini, S. Curtarolo, M. Fornari, M. B. Nardelli, and A. Calzolari, Phys. Rev. B 94, 165166 (2016).
- Agapito et al. (2015) L. A. Agapito, S. Curtarolo, and M. Buongiorno Nardelli, Phys. Rev. X 5, 011006 (2015).
- Gopal et al. (2015) P. Gopal, M. Fornari, S. Curtarolo, L. A. Agapito, L. S. I. Liyanage, and M. B. Nardelli, Physical Review B 91, 245202 (2015).
- Calzolari and Nardelli (2013) A. Calzolari and M. B. Nardelli, Scientific Reports 3, 2999 (2013).
- (45) N. Ohtha and A. R. Robertson, Colorimetry: Fundamentals and applications, John Wiley & Sons Ltd UK (2005).
- Malcioglu et al. (2011) O. B. Malcioglu, A. Calzolari, R. Gebauer, D. Varsano, and S. Baroni, J. Am. Chem. Soc. 133, 15425 (2011).
- Margine et al. (2011) E. R. Margine, A. N. Kolmogorov, M. Reese, M. Mrovec, C. Elsässer, B. Meyer, R. Drautz, and D. G. Pettifor, Phys. Rev. B 84, 155120 (2011).
- Delin et al. (1996) A. Delin, O. Eriksson, R. Ahuja, B. Johansson, M. S. S. Brooks, T. Gasche, S. Auluck, and J. M. Wills, Phys. Rev. B 54, 1673 (1996).
- Ahuja et al. (1996) R. Ahuja, O. Eriksson, J. M. Wills, and B. Johansson, Phys. Rev. B 53, 3072 (1996).
- Stampfl et al. (2001) C. Stampfl, W. Mannstadt, R. Asahi, and A. J. Freeman, Phys. Rev. B 63, 155106 (2001).
- Hochst et al. (1982) H. Hochst, R. D. Bringans, P. Steiner, and T. Wolf, Phys. Rev. B 25, 7183 (1982).
- Walker et al. (1997) C. G. H. Walker, C. A. Anderson, A. McKinley, N. M. D. Brown, and A. M. Joyce, Surf. Sci. 383, 248 (1997).
- Patsalas and Logothetidis (2001) P. Patsalas and S. Logothetidis, J. Appl. Phys. 90, 4725 (2001).
- Kim et al. (2011) J. Kim, S.-H. Jhi, and K. Ryeol Lee, J. Appl. Phys. 110, 083501 (2011).
- Wiemer et al. (1994) C. Wiemer, F. Lévy, and F. Bussy, Surf. and Coat. Technol. 68, 181 (1994).
- Langereis et al. (2009) E. Langereis, S. B. S. Heil, H. C. M. Knoops, W. Keuning, M. C. M. van de Sanden, and W. M. M. Kessels, J. Phys. D: Appl. Phys. 42, 073001 (2009).
- Perry et al. (1988) A. Perry, M. Georgson, and W. Sproul, Thin Sol. Films 157, 255 (1988).
- Pflüger et al. (1984) J. Pflüger, J. Fink, W. Weber, K. P. Bohnen, and G. Crecelius, Phys. Rev. B 30, 1155 (1984).
- Herzing et al. (2016) A. A. Herzing, U. Guler, X. Zhou, A. Boltasseva, V. Shalaev, and T. B. Norris, Appl. Phys. Lett. 108, 171107 (2016).
- Egerton (2011) R. F. Egerton, “Electron Energy-Loss Spectroscopy in the Electron Microscope,” Springer US, Boston, MA (2011).
- Serra et al. (1991) L. Serra, F. Garcias, M. Barranco, N. Barberan, and J. Navarro, Phys. Rev. B 44, 1492 (1991).
- (62) F. Wooten, Optical Properties of solids, 1972 Academic Press, Inc. San Diego CA, 9211 USA.
- Mishra et al. (2015) V. Mishra, S. Chaturvedi, V. Mishra, and S. Chaturvedi, Phase Tran. 89, 60 (2015).
- Yang et al. (2016) R. Yang, C. Zhu, Q. Wei, and Z. Du, J. Phys. Chem. Sol. 98, 10 (2016).
- Oleshko and Howe (2007) V. P. Oleshko and J. M. Howe, J. Appl. Phys. 101, 054308 (2007).
- Chen et al. (2011) N. C. Chen, W. C. Lien, C. R. Liu, Y. L. Huang, Y. R. Lin, C. Chou, S. Y. Chang, and C. W. Ho, J. Appl. Phys. 109 (2011).
- Rocca (1995) M. Rocca, Surf. Sci. Rep. 22, 1 (1995).
- Marlo and Milman (2000) M. Marlo and V. Milman, Phys. Rev. B 62, 2899 (2000).
- Mehmood et al. (2015) F. Mehmood, R. Pachter, N. R. Murphy, and W. E. Johnson, J. Appl. Phys. 118, 195302 (2015).
- (70) The similarities between bulk and surface DOSs, along with the absence of surface states at Fermi do not exclude a priori that specific surface-dependent features may arise in surface EELS spectra. The explicit simulation of these effect would require different simulation techniques, based, e.g., on surface response function g(q,), which contains the surface excitations which may be probed in energy loss experiments in grazing geometry. Details on g(q,) can be find in Ref. Pitarke et al. (2006).
- Diaconescu et al. (2007) B. Diaconescu, K. Pohl, L. Vattuone, L. Savio, P. Hofmann, V. M. Silkin, J. M. Pitarke, E. V. Chulkov, P. M. Echenique, and D. F. amd M. Rocca, Nature 448, 57 (2007).
- Park and Palmer (2010) S. J. Park and R. E. Palmer, Phys. Rev. Lett. 105, 016801 (2010).
- Pohl et al. (2010) K. Pohl, B. Diaconescu, G. Vercelli, L. Vattuone, V. M. Silkin, E. V. Chulkov, P. M. Echenique, and M. Rocca, EuroPhys. Lett) 90, 57006 (2010).
- Patsalas and Logothetidis (2003) P. Patsalas and S. Logothetidis, J. Appl. Phys. 93, 989 (2003).