Electron-nuclear coherent spin oscillations probed by spin dependent recombination
Abstract
We demonstrate the detection of coherent electron-nuclear spin oscillations related to the hyperfine interaction and revealed by the band-to-band photoluminescence (PL) in zero external magnetic field. On the base of a pump-probe PL experiment we measure, directly in the temporal domain, the hyperfine constant of an electron coupled to a gallium defect in GaAsN by tracing the dynamical behavior of the conduction electron spin-dependent recombination to the defect site. The hyperfine constants and the relative abundance of the nuclei isotopes involved can be determined without the need of electron spin resonance technique and in the absence of any magnetic field. Information on the nuclear and electron spin relaxation damping parameters can also be estimated from the oscillations damping and the long delay behavior.
Electron and nuclear spins of well-isolated point defects in semiconductors are excellent candidates for understanding fundamental spin-coupling mechanisms or to model quantum information processing. The coupling through hyperfine interaction (HFI) represents a key spin mechanism in semiconductor systems: responsible for creating mixed electron-nuclear spin states, it has been shown to be useful, e.g., for electron-nuclear spin transfer, in controlling electron spin coherence time of P donor sites in Si Kane (1998); Pla et al. (2012); Ladd et al. (2005); Laucht et al. (2014); Yao et al. (2006); Ivády et al. (2015) and the nitrogen-vacancy centers in diamond Rao et al. (2015); Zaiser et al. (2016); Auer and Burkard (2016); van der Sar et al. (2012); Mizuochi et al. (2009); Maze et al. (2008); Pla et al. (2014). The HFI is however also responsible for electron and nuclear spin relaxation and decoherence Urbaszek et al. (2013).
Similarly to nitrogen in diamond, on one side, and to shallow defects in silicon, on the other side,
interstitial Ga defects in dilute nitride GaAsN Kalevich et al. (2005); Wang et al. (2009a)
unite the characteristics of deep and well isolated paramagnetic centers to an electrically
and optically addressable semiconducting system leading, e.g., to the giant spin-dependent photocondctivity effect Lagarde et al. (2007); Zhao et al. (2009a); Kunold et al. (2011).
The incorporation of nitrogen in (In)GaAs to form (In)GaAsN alloys gives
rise to paramagnetic interstitial centers composed of a Ga atom and a single
resident electron Wang et al. (2009a).
These defect sites are at the origin of a very efficient spin-dependent recombination
of conduction band (CB) electrons. This has proven, for instance, to
be an effective tool for generating an exceptionally high spin polarization (up to 100%) of free and
bound electrons in these nonmagnetic dilute nitrides semiconductors at room
temperature Kalevich et al. (2007).
The nuclear spin states of these defect ensemble has been shown to be accessible via a
measurement of the the circular polarization degree of band-to-band PL, while the defect nuclear spin
polarization in this model system can be tuned with different excitation parameters such as pump power, the
circular polarization degree of the incident light and through a weak external
magnetic field Kalevich et al. (2012, 2013); Ivchenko et al. (2016).
Optically or electrically detected magnetic resonance techniques are consistently employed for manipulating and
probing the defect spins through the hyperfine interaction, or again to identify the defect chemical nature and related
spin dependent recombination pathways. Here, we demonstrate the experimental implementation of a new all-optical
detection scheme in zero external magnetic field based
on a PL pump-probe experiment leading to the measurement, in the temporal domain, of the hyperfine
constant of deep paramagnetic centers by directly tracing the hyperfine interaction dynamical features Ibarra-Sierra et al. (2016).
The hyperfine constants, defect configuration and the relative abundance of the isotopes involved can be
determined without the need of electron spin resonance techniques and in the absence of any magnetic field.
Information on the nuclear and electron spin relaxation damping parameters can also be estimated from the
oscillations damping and the long temporal delay behavior.
The sample under study consists of a 100 nm thick GaAs1-xNx epilayer (x=0.021) grown by molecular beam epitaxy on a (001) semi-insulating GaAs substrate and capped with 10 nm GaAs. The sample has been investigated at 4 K by the optical orientation technique which relies on the successive transfer of the angular momentum of the exciting photons, using circularly polarized light, to the photogenerated electrons Meier and Zakharchenya (1984) and finally to the Ga nuclei. The excitation source is a mode-locked Ti:Sapphire laser emitting at 850 nm split into pump and probe pulses of equal intensity and 1.2 ps duration. Although this configuration differs from a typical pump-probe experiments as the probe beam modifies on its turn the system similarly to the pump, this has proven to be the optimal experimental conditions to measure the HFI features. The sample is excited by focussing the pump and probe pulses to the same 50 m diameter spot. The two pulses relative delay is controlled by an optical delay line and their polarizations independently set by a system of polarization optics. In order to evidence the HFI features, we have measured the PL intensity induced by a circularly polarized probe pulse as a function of (i) the delay time between pump and probe pulses and (ii) the helicity of the pump pulse. In the following, we plot the influence of the pump pulse helicity on the probe pulse PL intensity by computing the ratio
| (1) |
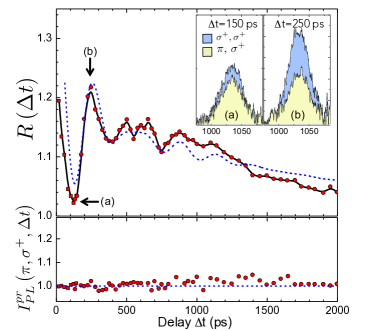
where the notation ( , , ) indicates, in arrival order, the polarization of the pump pulse, probe pulse and their respective delay. For the measurements at short delays (100 ps for which the PL intensities of the two pulses may partially overlap), the intensity of the probe pulse has been modulated by a mechanical chopper and the PL intensity of the probe pulse has been measured with a photodiode connected to a lock-in amplifier. For greater delays, a S1 photocathode streak camera coupled to an imaging spectrometer has been employed. Figure 1 (top, symbols) presents ) measured for an excitation power =4 mW. The trace presents an oscillating behaviour showing that can be periodically amplified by adjusting the delay time when the pump pulse is circularly polarized. For longer delay times the oscillations lose visibility and a monotonous decrease of the amplifying effect is observed. Insets in Figure 1 display the recorded data at two extreme points of the oscillations where the probe PL intensity is strongly increased (=250 ps) or only weakly modified (=150 ps). Figure 1, (bottom, symbols) presents the PL intensity of the probe pulse recorded after a linearly polarized pump pulse. In this case no significant variation of the PL intensity is measured. Below we will show that the oscillating and decay features of can be directly linked to the coherent oscillations of the electron-gallium system induced by the hyperfine-interaction.
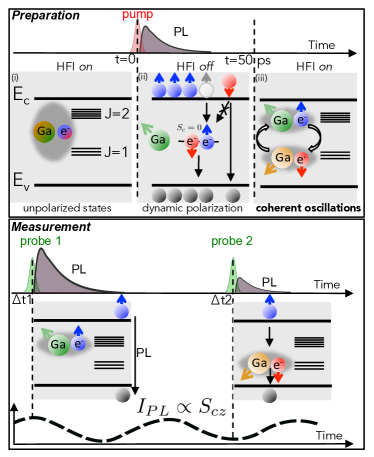
The principle of the observation is described in terms of the model depicted in Figure 2 and based on the following considerations. The HFI hamiltonian of gallium defects with spin =3/2 and a singly trapped electron of spin =1/2 (where is the hyperfine interaction constant) leads to split triplet-quintet eigenstates at zero magnetic field = , where are the Clebsch-Gordan coefficients ( 1/2, 3/2, 1/2 are the nuclear and electron spin projections on the axis, and ) with total spin . Before illumination by the pump pulse, the eight hyperfine states are statistically equi-populated in our experimental conditions. The preparation of the defect spin polarisation by the pump pulse proceeds as follows: A left-handed circularly polarized pumping above the band gap creates preferentially spin-up conduction band electrons (holes quickly lose their spin orientation, and are considered unpolarized Hilton and Tang (2002)). The conduction band electrons are very rapidly captured by the gallium interstitial defects ( 10 ps) forming a two-electron spin singlet Kalevich et al. (2009); Wang et al. (2009a): The hyperfine coupling is now off. It follows a fast recombination of one of the two defect electrons with an unpolarized hole. Due to the photogeneration of a CB electron spin polarization, the spin dependent recombination statistically drives the defect electrons to the same average spin orientation as the conduction band electrons Kalevich et al. (2005); Sandoval-Santana et al. (2014). The recombination of one of the center paired electron with an unpolarized hole is fast, typically occurring on a time scale 30 ps Kalevich et al. (2005); Lagarde et al. (2007); Wang et al. (2009a), and the HFI is re-enacted. At the re-establishment of the HFI the remaining electron spin state is projected onto the total spin eigenstates , leaving the defect system in a superposition of states between the and hyperfine levels as 1. Second, the time scale of the recombination ensures as well a relatively constant phase among the ensemble of the defect centers. At this point, the quantum system periodically oscillates between the and states which results in oscillations between the states. Being the hyperfine interaction energy 15 eV Wang et al. (2009b), the defect preparation time is sizeably shorter than the oscillation period 250 ps. The probe beam (Figure 2, bottom panel) can now encounter two extreme situations. In the first case (probe 1) the majority of defect electrons have the same average spin orientation as the CB ones, preventing the capture. The PL intensity is enhanced. In the second case (probe 2), the majority of defect electrons have the opposite average spin orientation than the CB electrons, favoring the capture: the PL is now reduced as the conduction band is depleted. In principle this process would result in a partially oscillating PL intensity in a spin polarized system with sufficiently long PL characteristic decay time in a single pulse experiment. Here, being the PL decay time shorter than the oscillation period T, a pump-probe PL technique, employing a second pulse, samples in time the coherent oscillation of the hyperfine system. It is important to note that longer PL decay times (as can be obtained by higher power excitation in this systems Zhao et al. (2009b)) are here not desirable as this will smear the initialization of the oscillation leading to faster dephasing. If however the pump pulse is linearly polarized, no dynamical polarization can occur and the probe pulse spin dependent recombination will be insensitive to the delay time. A key feature is that this all-optical approach does not require any external magnetic field which might modify the spin relaxation damping parameters. Let us now turn our attention to the kinetics of photoelectrons excited by the probe pulse in the conduction band. We can get a qualitative and analytical understanding of the oscillating behavior of according to the following argument. Neglecting the electron spin relaxation, the CB electron rate equations can be described by
| (2) | |||
where are the densities of the conduction photoelectrons with spin up () and down () excited by the probe pulse arriving with the time delay , is the constant of the conduction-electron trapping rate by paramagnetic centers, is the hole concentration (due to rapid spin relaxation the holes are unpolarized), is the bimolecular recombination constant, and are the concentrations of single-electron defects with the electron spin with . Due to the prior pump pulse and are different if the pump is circularly polarized and coincide for the linearly polarized pump excitation. Since (i) the electron capture is much more effective as compared to the interband recombination and (ii) vary slowly within the capture times , the time dependence of is described by , where are the electron densities injected by the probe pulse. For a sufficiently weak photoexcitation the measured ratio (1) is described by
| (3) |
For circularly polarized pump pulses the values consist of the oscillating and non-oscillating parts
| (4) |
where is the hyperfine splitting between the electron-nuclear spin quintet and triplet with the angular momenta and , respectively.
The oscillating time behaviour of can be understood in terms of the spin-density-matrix approach. In equilibrium the spin density of single-electron defects, , is diagonal with equally populated sublevels: . The pump pulse generates CB photoelectrons with densities which are immediately captured by single-electron defects according to Eqs. (2) and form the electron pair states with density . The remaining single-electron defects acquire spin polarization. Immediately after the pulse, i.e. at , one has , where is the total density of the deep paramagnetic centers. This equation can be rewritten as
in terms the spin-density matrix taken in the basis . In the basis this equation is rewritten as
| (5) |
where
and the Clebsch-Gordan coefficients relate the standard bases and . The components can be readily expressed via and , among them there are those with and . Neglecting the spin relaxation we have
Therefore, the oscillating part of Eq. (4) is contributed from the off-diagonal spin-matrix components with . A straightforward calculation gives
The last terms in the left-hand sides of Eqs. (2) describe the radiative recombination and the PL intensity. Retaining all the factors we can present Eq. (3) in the final form
| (6) |
where the coefficients and are respectively given by and with being the initial degree of the pump-induced spin polarization . In the presence of two isotopes, as is the case for gallium atoms, the cosine function in Eq. (6) should be replaced by a sum of two cosine functions with the frequencies and relative abundances . Allowance for the spin relaxation results in a multiplication of by and of by , where is the bound-electron spin relaxation time and is the decoherence time of electron-nuclear spin oscillation which is affected by both homogeneous relaxation processes and inhomogeneous broadening of the hyperfine splitting. Thus the experimentally determined can be quantitatively compared with
| (7) | |||
where the positive values and are normalized by the condition . According to the mechanism described, the circularly polarised probe pulse will sample the oscillating behaviour of the hyperfine coupling instantaneously and at different delays. We obtain a modulation of the probe beam PL intensity directly tracing the hyperfine interaction in the time domain. In the case of gallium atoms, the two stable isotopes 69Ga and 71Ga have the relative abundances =0.6018 and =0.3982 respectively, and their hyperfine constants differs by a factor =1.27. The hyperfine constant (Table I Wang et al. (2009b)) will however depend on the particular defect location which is determined mainly by growth and annealing conditions.
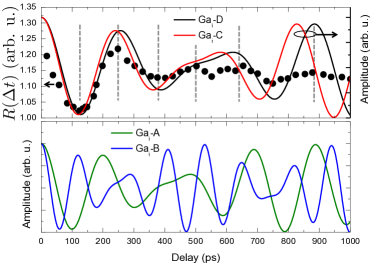
Figure 3 details for short delays superposed to a simple beating pattern
composed of a sum of simple cosines functions at the frequencies of the different gallium interstitial locations as reported in Table 1. The experimental data present a first
destructive interference pattern in the 500 ps to 600 ps range. This rules out the
occurrence of Gai-A and Gai-B as their higher oscillating frequencies are incompatible with the
experimental observation. Gai-C and Gai-D present very similar hyperfine constant which causes the beating pattern to dephase slightly. Nevertheless, the experimental data presented in Figure 3 (top) allow us to unambiguously identify Gai-D as the dominant interstitial configuration.
The dashed line in Figure 1 (top) represents a fit to the data using Eq. (7), the hyperfine constants of gallium D interstitial defects and setting the pump pulse polarization to circular. The best results are obtained with =1700 ps, =350 ps.
This proves that a precise determination of the defect nature and configuration
can be obtained by this PL pump and probe scheme.
The mechanisms responsible for the coherence loss can be multiple. First of all, the measurement maps the coherent oscillations of the ensemble of Ga centers present under the
excitation spot whose intensity strongly varies from the excitation spot center to the edge.
Second, the HFI sampling cannot be considered as strictly instantaneous but averaged over the CB electron lifetime , allowing us only to infer a minimum limit for the coherence time decay. Third, the stochastic nature of the the trapping and recombination can also be ascribed as a possible source of coherence loss. Finally, there might be some inhomogeneities from center to center
resulting in slight fluctuations of the hyperfine coupling constant.
| Gai location | A | B | C | D |
|---|---|---|---|---|
| (69Ga) (10-4 cm-1) | 745 | 1230 | 620 | 580 |
| (71Ga) (10-4 cm-1) | 968.5 | 1562 | 787.4 | 736.6 |
The dotted line in Figure 1 (bottom) reports the results of the simulation setting the first pulse polarization to linear. As expected from the previous discussion, and are now identical and no oscillations are observed.
In conclusion, we have demonstrated a possibility of measuring the electron-nuclear spin oscillations related to the hyperfine interaction in dilute nitride semiconductor paramagnetic centers by monitoring the band to band PL in the absence of any magnetic field. The hyperfine constants and the relative abundances of the nuclei involved can be unambiguously determined without the need of electron spin resonance techniques. Information on the nuclear and electron spin relaxation damping parameters of the paramagnetic center can also be estimated from the oscillations damping and the long time delay behavior. This zero magnetic field detection scheme based solely on the spin dependent recombination should be applicable to other materials besides GaAsN, like 2D crystals as, for instance, paramagnetic centers in h-BN Tran et al. (2016).
Acknowledgements.
We acknowledge funding from LIA CNRS-Ioffe RAS ILNACS. E.L.I. thanks the RFBR (Grant No. 17-02-00383). V.K.K. acknowledges the financial support of the Government of Russia (Project No. 14.Z50.31.0021). A.K. gratefully appreciates the financial support of Departamento de Ciencias Bàsicas UAM-A grant numbers 2232214 and 2232215. J.C.S.S. and V.G.I.S. would like to acknowledge the support received from the Becas de Posgrado UAM scholarship numbers 2151800745 and 2112800069. X.M. also thanks Institut Universitaire de France. This work was supported by Programme Investissements d’Avenir under the program ANR-11-IDEX-0002-02, reference ANR-10-LABX-0037-NEXT.References
- Kane (1998) B. E. Kane, Nature 393, 133 (1998).
- Pla et al. (2012) J. J. Pla, K. Y. Tan, J. P. Dehollain, W. H. Lim, J. J. L. Morton, D. N. Jamieson, A. S. Dzurak, and A. Morello, Nature 489, 541 (2012).
- Ladd et al. (2005) T. D. Ladd, D. Maryenko, Y. Yamamoto, E. Abe, and K. M. Itoh, Phys. Rev. B 71, 014401 (2005).
- Laucht et al. (2014) A. Laucht, R. Kalra, J. T. Muhonen, J. P. Dehollain, F. A. Mohiyaddin, F. Hudson, J. C. McCallum, D. N. Jamieson, A. S. Dzurak, and A. Morello, Appl. Phys. Lett. 104, 092115 (2014).
- Yao et al. (2006) W. Yao, R.-B. Liu, and L. J. Sham, Phys. Rev. B 74, 195301 (2006).
- Ivády et al. (2015) V. Ivády, K. Szász, A. L. Falk, P. V. Klimov, D. J. Christle, E. Janzén, I. A. Abrikosov, D. D. Awschalom, and A. Gali, Phys. Rev. B 92, 115206 (2015).
- Rao et al. (2015) D. D. B. Rao, S. Yang, and J. Wrachtrup, Phys. Rev. B 92, 081301 (2015).
- Zaiser et al. (2016) S. Zaiser, T. Rendler, I. Jakobi, T. Wolf, S.-Y. Lee, S. Wagner, V. Bergholm, T. Schulte-Herbrüggen, P. Neumann, and J. Wrachtrup, Nat. Comm. 7, 12279 (2016).
- Auer and Burkard (2016) A. Auer and G. Burkard, Phys. Rev. B 93, 035402 (2016).
- van der Sar et al. (2012) T. van der Sar, Z. H. Wang, M. S. Blok, H. Bernien, T. H. Taminiau, D. M. Toyli, D. A. Lidar, D. D. Awschalom, R. Hanson, and V. V. Dobrovitski, Nature 484, 82 (2012).
- Mizuochi et al. (2009) N. Mizuochi, P. Neumann, F. Rempp, J. Beck, V. Jacques, P. Siyushev, K. Nakamura, D. J. Twitchen, H. Watanabe, S. Yamasaki, F. Jelezko, and J. Wrachtrup, Phys. Rev. B 80, 041201 (2009).
- Maze et al. (2008) J. R. Maze, J. M. Taylor, and M. D. Lukin, Phys. Rev. B 78, 094303 (2008).
- Pla et al. (2014) J. J. Pla, F. A. Mohiyaddin, K. Y. Tan, J. P. Dehollain, R. Rahman, G. Klimeck, D. N. Jamieson, A. S. Dzurak, and A. Morello, Phys. Rev. Lett. 113, 246801 (2014).
- Urbaszek et al. (2013) B. Urbaszek, X. Marie, T. Amand, O. Krebs, P. Voisin, P. Maletinsky, A. Högele, and A. Imamoglu, Rev. Mod. Phys. 85, 79 (2013).
- Kalevich et al. (2005) V. K. Kalevich, E. L. Ivchenko, M. M. Afanasiev, A. Y. Shiryaev, A. Y. Egorov, V. M. Ustinov, B. Pal, and Y. Masumoto, JETP Lett. 82, 455 (2005).
- Wang et al. (2009a) X. J. Wang, I. A. Buyanova, F. Zhao, D. Lagarde, A. Balocchi, X. Marie, C. W. Tu, J. C. Harmand, and W. M. Chen, Nature Mat. 8, 198 (2009a).
- Lagarde et al. (2007) D. Lagarde, L. Lombez, X. Marie, A. Balocchi, T. Amand, V. K. Kalevich, A. Shiryaev, E. Ivchenko, and A. Egorov, Phys. Stat. Sol. (a) 204, 208 (2007).
- Zhao et al. (2009a) F. Zhao, A. Balocchi, A. Kunold, J. Carrey, H. Carrère, T. Amand, N. Ben Abdallah, J. C. Harmand, and X. Marie, Appl. Phys. Lett. 95, 241104 (2009a).
- Kunold et al. (2011) A. Kunold, A. Balocchi, F. Zhao, T. Amand, N. B. Abdallah, J. C. Harmand, and X. Marie, Phys. Rev. B 83, 165202 (2011).
- Kalevich et al. (2007) V. K. Kalevich, A. Y. Shiryaev, E. L. Ivchenko, A. Y. Egorov, L. Lombez, D. Lagarde, X. Marie, and T. Amand, JETP Lett. 85, 174 (2007).
- Kalevich et al. (2012) V. K. Kalevich, M. M. Afanasiev, A. Y. Shiryaev, and A. Y. Egorov, Phys. Rev. B 85, 035205 (2012).
- Kalevich et al. (2013) V. K. Kalevich, M. M. Afanasiev, A. Y. Shiryaev, and A. Y. Egorov, JETP Lett. 96, 567 (2013).
- Ivchenko et al. (2016) E. L. Ivchenko, L. A. Bakaleinikov, M. M. Afanasiev, and V. K. Kalevich, Phys. Sol. St. 58, 1539 (2016).
- Ibarra-Sierra et al. (2016) V. G. Ibarra-Sierra, J. C. Sandoval-Santana, S. Azaizia, H. Carr re, L. Bakaleinikov, V. K. Kalevich, E. L. Ivchenko, X. Marie, T. Amand, A. Balocchi, and A. Kunold, arXiv:1611.04200 (2016).
- Meier and Zakharchenya (1984) F. Meier and B. P. Zakharchenya, Optical Orientation (Elsevier Science Ltd, 1984).
- Hilton and Tang (2002) D. J. Hilton and C. L. Tang, Phys. Rev. Lett. 89, 146601 (2002).
- Kalevich et al. (2009) V. K. Kalevich, A. Y. Shiryaev, E. L. Ivchenko, M. M. Afanasiev, A. Y. Egorov, V. M. Ustinov, and Y. Masumoto, Phys. B 404, 4929 (2009).
- Sandoval-Santana et al. (2014) C. Sandoval-Santana, A. Balocchi, T. Amand, J. C. Harmand, A. Kunold, and X. Marie, Phys. Rev. B 90, 115205 (2014).
- Wang et al. (2009b) X. J. Wang, Y. Puttisong, C. W. Tu, A. J. Ptak, V. K. Kalevich, A. Y. Egorov, L. Geelhaar, H. Riechert, W. M. Chen, and I. A. Buyanova, Appl. Phys. Lett. 95, 24190 (2009b).
- Zhao et al. (2009b) F. Zhao, A. Balocchi, G. Truong, T. Amand, X. Marie, X. J. Wang, I. A. Buyanova, W. M. Chen, and J. C. Harmand, J. of Phys.: Cond. Mat. 21, 174211 (2009b).
- Tran et al. (2016) T. T. Tran, K. Bray, M. J. Ford, M. Toth, and I. Aharonovich, Nat. Nanotech. 11, 37 (2016).