Reentrant phases in electron-doped : spin glass and superconductivity
Abstract
We report evidence for a reentrant spin glass phase in electron-doped single crystals and first traces of the superconductivity re-entrance in optics. In the close-to-optimal doped and samples two magnetic transitions are observed below the superconducting critical temperature K: the canted -type antiferromagnetic order of the ions sets in around ; the spin glass behavior occurs another lower in temperature. In addition, strong evidence for an additional transition is found far below the spin glass temperature. Our extensive optical and magnetic investigations provide new insight into the interplay of local magnetism and superconductivity in these systems and elucidate the effect of the spin-glass phase on the reentrant superconducting state.
pacs:
74.70.Xa, 74.25.Gz, 74.25.Ha, 75.50.LkI Introduction
Quite some time passed since in 2008 Hosono et al. discovered superconductivity in fluorine-doped LaFeAsO with a of Hosono2008 and by now a large variety of different iron-based superconductors are found and studied BuchIP . Soon it was realized that in pnictides the interplay of magnetism and superconductivity is crucial for the understanding; the spin-density-wave phase has to be suppressed in order to develop the superconducting phase. Eu-based iron pnictides provide an even more interesting playground, as they allow to study the influence of strongly magnetic Eu2+ ions on the superconducting state SinaReview .
The parent compound EuFe2As2 develops not only the antiferromagnetic order of the itinerant iron electrons that is typical for iron pnictides ( K); at low temperatures, an additional magnetic order of the local rare earth moments sets in ( K) WuEu . This local magnetism is strong enough for a giant, indirect spin-lattice coupling that allows a structural detwinning of these compounds by small magnetic fields Zapf2014 . Nevertheless, superconductivity can be induced on the same temperature scale by chemical substitution or mechanical pressure. This leads to the emergence of interesting phenomena such as spin-glass behavior, reentrant superconductivity and probably spontaneous vortices.
In principle, the reentrant superconductivity is caused by a competition between superconductivity and magnetism. Such unusual behavior of resistivity was first predicted for superconductors exhibiting the Kondo effect by Müller-Hartmann et al. Kondo , but several rare earth compounds also show such a resistivity behavior borocarbide . In Eu-doped compounds, external magnetic fields affect the appearance of this feature ParamanikReentrantSC ; reentrantmagneticfield ; Jiao17 . Up to now it is not fully understood why some compositions exhibit reentrant superconductivity and others not.
Here, Eu-based 122 compounds with electron doping are investigated. Thereby, optical, dc and ac magnetization, and dc resistivity measurements are performed. From our study we conclude that reentrant superconductivity is widely present in electron-doped Eu-122 compounds. We can reveal important information on the intermediate regime, , where the reentrant spin-glass phase affects superconductivity until complete phase coherence is reached.
II Experimental Details
The single crystals used for this study were grown by the self-flux method Jiang09 ; Jiao11 and characterized by x-ray, dc transport and susceptibility measurements. Optical investigations are performed by normal-incidence reflection measurements in the frequency range between and . For the far-infrared range a Fourier-transform spectrometer Bruker IFS 113 v was utilized; the mid-infrared and near infrared data were taken by a Bruker VERTEX 80v. In the far-infrared range in-situ gold evaporation technique allows us to measure at very low frequencies. For mid- and near-infrared range an attached Bruker Hyperion 1000 microscope provides optimal results by using a small focus area on the sample. Temperature and field-dependent magnetization data are obtained in three different ways by employing a Quantum Design ac SQUID (superconducting quantum interference device). First, the sample is cooled down without a magnetic field applied and the data are recoreded during warming up (zero-field cooled, ZFC). The second way is to measure upon cooling with a field applied (field-cooled cooling curve FCC). The third procedure records the magnetization while warming up, after the sample was cooled down with the magnetic field present (field-cooled heating curve, FCH). The temperature-dependent dc resistivity is measured with the standard four-point probe technique.
In the following we focus on two electron-doped EuFe2As2 compounds, one with 7% iron replaced by rhodium and one with 9% iridium. Our magnetization measurements clearly identify the Eu2+ ordering at K WuEu ; SinaEu ; in addition all compounds show strong evidence of the reentrant spin-glass state, like it was reported for isovalent substituted SpinGlass . This immediately tells us that the spin glass phase is also present in electron-doped compounds and infers that the appearance of the reentrant spin glass phase is important for the formation of the superconducting state. Interestingly, while and Jiao17 exhibits reentrant superconductivity, no signs of it are found in . From the infrared results at temperatures below the onset of the superconducting state , we find distinct differences in the low-frequency optical behavior for the samples with and without reentrant superconductivity.
Besides of that, both samples show an untypical feature in the imaginary part of the magnetic susceptibility at very low temperatures. The origin of this feature could be either due to vortex dynamics or attributed to a ferromagnetic transition regarding to the results obtained in Ru-doped samples Ru . This would be consistent with recent publications of neutron diffraction measurements report indications of a ferromagnetic state in -direction for Co- JinCoFerro , Ir- AnandIrFerro ; Ir12Jin and P-doped NandiPFerro samples; however they cannot rule out a small canting of the spins which is enough to form a spin glass in the -plane. Hence it is reasonable to have a closer look at all features from the results out of the magnetization measurements.
III Transport Properties
Figure 1 displays the temperature-dependence of the in-plane resistivity for both alloys, Eu(Fe0.91Ir0.09)2As2 and Eu(Fe0.93Rh0.07)2As2. The corresponding residual resistivity ratios (RRR) are and , respectively. These values are comparable to those reported for other Ir- and Rh-doped samples optimaldopingIr ; Ir12Jin ; Jiao17 and confirm the high quality of our crystals.
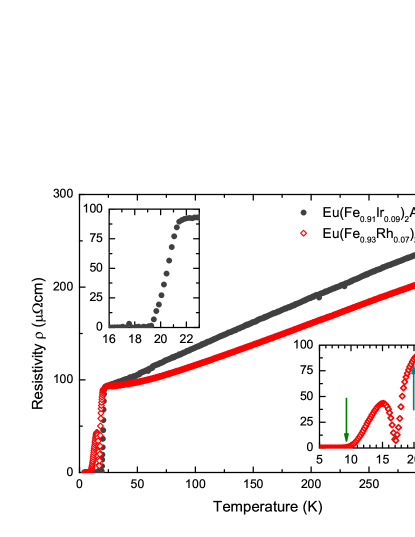
In case of , the normal state resistivity depends linearly on , which is typical for unconventional superconductors close to optimal doping level () optimaldopingIr . Such a behavior is often ascribed to the vicinity of a quantum critical point QCP , but could be also explained by spin fluctuations Kurita . In contrast, the resistivity of depends quadratically on temperature between 25 and , indicating Fermi liquid behavior. Therefore, this sample is probably slightly under- or overdoped. It is interesting to recall the behavior of BaFe2As2 doped with Co and Ni, where a similar distinction was observed Barisic10 . There it was concluded that two electronic subsystems are present with one following a behavior in up to elevated temperatures, indicating a hidden Fermi-liquid behavior. The superconducting state evolves out of this Fermi-liquid state.
Let us now turn to the superconducting state by looking at the insets of Fig. 1. For the optimally doped Ir sample, a sharp superconducting transition takes place between and . In contrast, exhibits a clear resistivity re-entrance: superconductivity sets in at . However, the resistivity does not directly drop to zero; it goes through a local minimum around , rises again to a maximum around and reaches zero only at . Although reentrant superconductivity for Eu-doped compounds was reported previously, most studies considered the effect of an external magnetic fields on this feature ParamanikReentrantSC ; reentrantmagneticfield . It is not yet fully understood why the reentrant behavior manifest itself in some compositions, while not detected in others. However, when or , in general reentrant superconductivity behavior is observed Tokiwa . This is also the reason why for samples near optimal doping, where , reentrant superconductivity is typically not present.
IV Optical Properties
IV.1 Normal state
IV.1.1 Eu(Fe0.91Ir0.09)2As2
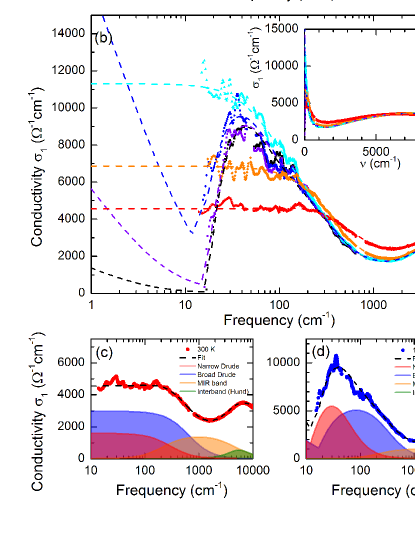
In Figure 2(a) we plot the optical reflectivity of the optimally doped Ir sample for selected temperatures. As typical for iron pnictides of the 122 family, no clear plasma edge can be detected WuEu ; ElScatteringEffects . In order to maximize the quality of our fits, reflectivity and optical conductivity are described simultaneously, because the complex components are linked by the Kramers-Kronig relations. Following our previous approach Wu10 ; Barisic10 , the normal state behavior is decomposed into two Drude components (one narrow, one broad), two mid-infrared Lorentzians, and Lorentzians located at high energies, as illustrated in Fig. 2(c). Since the latter ones are located out of the measured energy range, they are considered temperature-independent to avoid any artificial spectral weight transfer. The spectral weight of a certain conductivity term, , measures how many charge carriers contribute; it is calculated from the optical conductivity via DresselGruner02
| (1) |
Here is the real part of the conductivity in dependence of frequency ; the plasma frequency of this term is indicated by , is the elementary charge and the mass of a charge carriers. Similarly, the spectral weight can be calculated for the total optical spectrum. Here, it is interesting consider the spectral weight as a function of the upper integration limit – the cut-off frequency :
| (2) |
where is the real part of the (total) optical conductivity, and the lower integration limit emphasizes that in the superconducting state we do not include the zero-frequency -function. While calculating the total spectral weight hereafter, we always use obtained from the fits.
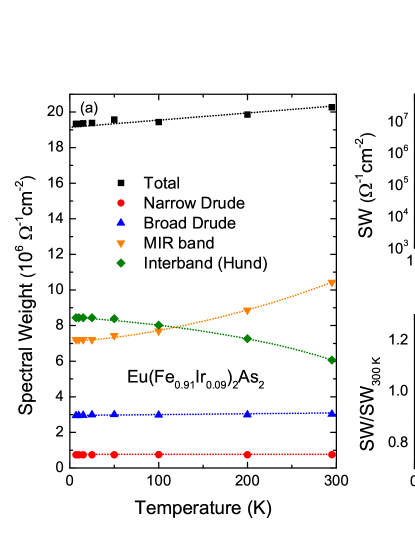
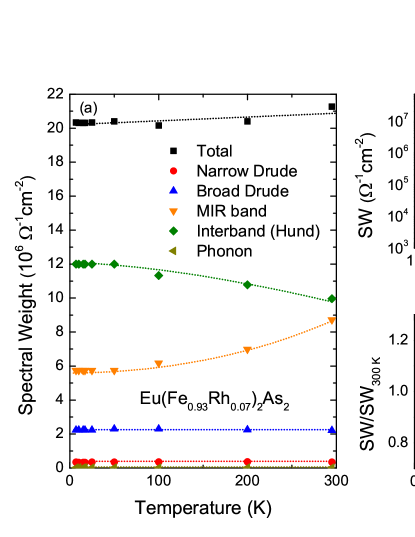
For each component of the fit, figure 3(a) presents the spectral weight as a function of . The spectral weight of the narrow Drude component, often linked to the electron bands, has the smallest contribution and stays constant with temperature. This implies that no charge carriers are redistributed to other components. The same holds for the broad Drude term, which possesses a nearly three times larger spectral weight. This ratio is surprising, on the first glance, since the broad Drude component is commonly linked to hole bands, but the sample under investigation is electron-doped. Therefore we should consider other possible interpretation of the two terms based on coherent and incoherent carriers Nakajima .
Already in the conductivity data displayed in Fig. 2(b) it becomes obvious that with decreasing temperature the mid-infrared band looses spectral weight to higher energies. Indeed, this transfer takes place up to surprisingly high energies, as can be best seen from Fig. 3(b-c), which present the spectral weight as a function of cut-off frequency [see Eq. (2)]. As typical for iron pnictides of the 122-family, the spectral weight (down to ) is not fully recovered at ElScatteringEffects ; Bing , with a discrepancy of remaining. Such a high-energy spectral-weight transfer can be ascribed to Hund’s rule coupling Hund . In this case, free electrons become polarized by localized carriers and thus do not contribute to the response of itinerant carriers anymore, resulting in a spectral-weight transfer of one Drude component to higher energies. As we have demonstrated for the isovalent substituted ElScatteringEffects , however, a fit of equal quality can also be obtained by the present approach. Here the scattering rate of the broad Drude term is not artificially high. The mid-infrared band corresponds to contributions by incoherent electrons that – as decreases – get even more localized by Hund’s rule coupling.
IV.1.2 Eu(Fe0.93Rh0.07)2As2
Figure 4 depicts the frequency- and temperature-dependent optical reflectivity and conductivity for the Rh-doped sample. In the normal state the overall behavior is very similar to the Ir-substituted crystal. Accordingly, we use the same approach to fit the data, leading to comparable results concerning the spectral weight transfer (see Fig. 5). Again, the spectral weight is not fully recovered up to , with a remaining discrepancy of .
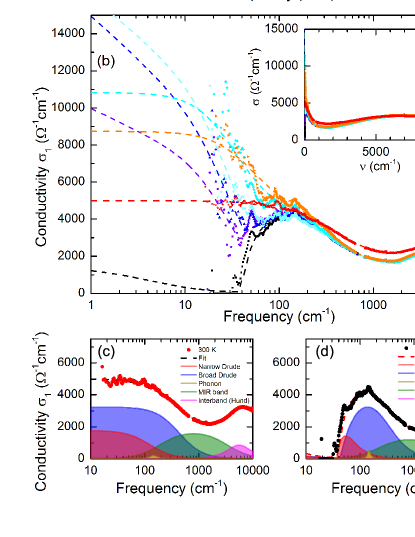
It is interesting to note the pronounced phonon at , most obvious in Fig. 4(c)(d). crystallizes in the tetragonal structure of space group I4/mmm (No.139). Torgashev calculated phonon modes at the -point Torgashev and obtained two vibrations, which are infrared-active for . The one at is frequently observed in infrared experiments WuEu ; ElScatteringEffects and also seen in related 122 iron pnictides Akrap09 . By completely substituting Rh for Fe, this -mode should shift by a factor of and is expected around ; significantly higher than the observed feature. Thus we believe that we do observe the second -vibration, which is predicted between and and has not be reported so far. The doping by Rh probably causes slight structural distortions and changes in the electron concentration leading to an enhanced intensity compared to the parent compound.
IV.2 Superconducting state
At K and K, respectively, superconductivity sets in for the Ir and Rh-doped EuFe2As2 crystals, as depicted in Fig. 1. While in the metallic phase both compounds exhibit rather similar optical properties, their behavior in the superconducting state is distinctively different and shall be discussed in full detail in the following.
IV.2.1 Eu(Fe0.91Ir0.09)2As2
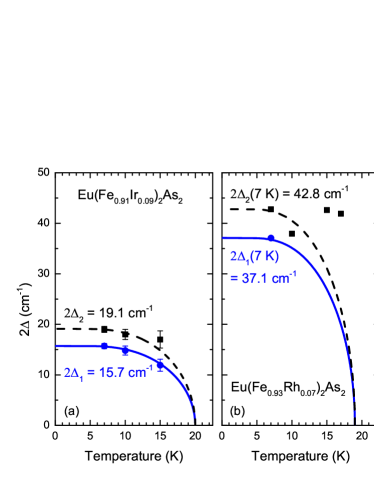
For the Ir-doped sample we find a clear upturn in reflectivity around towards unity; the common hallmark of a superconductor with a complete energy gap at the Fermi surface DresselGruner02 ; Dressel13 . In order to describe the electrodynamic behavior below , the two Drude terms are replaced by two BCS contributions [Fig. 2(d)], following the extended Mattis-Bardeen equations Wu10 ; Pracht13 . We assume that both contributions remain independent and simply add up. Since we are close to the limit what can be measured by gold-evaporation technique, we restrain from applying more advanced models Maksimov11 . As demonstrated in Fig. 3(b), the spectral weight is significantly reduced for and transferred to the -peak at . From the BCS fit of the optical data, the temperature-dependent gaps are extracted and displayed in Fig. 6(a). As expected, both energy gaps start to open simultaneously around 20 K, increase with decreasing , and basically follow the BCS temperature dependence. The zero-temperature extrapolation yields and . These absolute values are about a factor of 2.5 to 3 smaller than one would expect from weak-coupling mean-field theory with a ; and also smaller than reported for other iron-based superconductors of the 122 family Dressel11 ; BuchIP . It is interesting to compare our findings with one on P-substituted EuFe2As2 compounds where no gap was recognized in the optical response, because the samples are clean-limit superconductors David .
Recently, the coexistence of clean- and dirty-limit superconductivity was proposed to account for the optical properties of LiFeAs Dai16 . This approach might also be relevant for Eu(Fe0.91Ir0.09)2As2, as we do observe a clear signature of a small gap but there could be another gap present at higher frequencies. The gap feature is not detected in optical conductivity simply because its position is above the characteristic scattering rates, i.e. the clean-limit situation is realized for this larger gap. By applying these considerations we could explain that the gap observed is three times below the BCS value remark1 .
IV.2.2 Eu(Fe0.93Rh0.07)2As2
The Rh-doped crystals do not only exhibit pronounced reentrant superconductivity in the dc resistivity, as demonstrated in Fig. 1, but also distinct optical properties for . In a close inspection of the frequency-dependent reflectivity, plotted in Fig. 4(a), clear fingerprints of the re-entrance phase can be resolved below . At , the onset of superconductivity, the low-frequency reflectivity rises strongly; for instance, the changes between and are much bigger than the one observed between and . In principle this behavior is typical for a superconducting transition, however, the reflectivity does not shoot up to unity immediately. Only at , i.e. below the zero-resistance temperature , the reflectivity is finally reached. A similar observation is made on the spectral-weight transfer to the zero-frequency peak that can only be observed at the lowest temperature.
The temperature and frequency behavior of the optical conductivity displayed in Fig. 4(b) basically leads to similar conclusions. Only the curves below exhibit a drop similar to the Ir-analogue, but then increases again for decreasing frequencies due to a strong in-gap absorption. Since there are no explicit models for the frequency-dependence of a re-entrance superconductor, we follow the procedure described above and fit the data by replacing the Drude with a BCS term as the superconducting state is entered. While the larger gap around is present already below K, it does not change much as is lowered. Only at the narrow term exhibits an energy gap, with ; see Fig. 6(b).
Similar temperature-independent optical gaps – i.e. gap-related features seen in optical experiments – were previously reported in single crystals LoboGap and thin films XiGap .
Up to now, the origin of such behavior in pnictides is not fully clarified, though for the films it was explained as being due to an interplay of the BCS-gap optical feature and an absorption mode situated at frequencies just slightly above the gap XiGap . A similar, but even more counterintuitive dependence of the apparent optical gap was reported in PimenovGap : there the minimum in decreased as . This behavior was explained by the multiband nature of : the smaller gap dominates the optical response at the lowest temperature and the higher-frequency feature due to the larger gap is not well pronounced in the conductivity spectra. As increases, the transition across the smaller gap becomes thermally saturated and the conductivity minimum gradually shifts to higher frequencies, revealing the optical feature related to the larger gap PimenovGap . It seems plausible that multiband effects also affect the temperature dependence of the optical gaps in pnictides.
The first observation of a superconducting energy gap in the reentrant phase enables us to go one step further, as it provides important information on the intermediate phase. The condensate forms right below , although the density of superconducting electrons is very low. Since there is no superconducting path formed through the sample, the dc resistivity is not zero. Only below , when phase coherence is fully reached, vanishes and a gap opens in the narrow conductivity term.
Our observations might be explained by scattering processes. Defects created by irradiation are known to quickly close the small superconducting gap with only minor effect on Schilling16 . Contrary to that Li et al. splusminus suggested that in case of symmetry, magnetic impurities act as interband scatterers, which hardly affect the transition temperature and do not break Cooper pairs. However, intraband magnetic scattering leads to pair breaking splusminus . Accordingly, superconductivity is not destroyed as long as . We suggest that the different transitions lead to dominant intraband scattering at high , but favor interband scattering in the superconducting phase at low temperatures. When , Cooper pairs begin to condense, as evident in optics, but intraband magnetic scattering destroys the phase coherence causing a finite resistivity. When the spin-glass transition sets in, interband magnetic scattering prevails, permitting phase coherence and a fully developed superconducting state. Obviously the resistivity does not vanish immediately at the spin-glass transition; this can be simply explained by the inherent nature of a glass-like transition, which develops smoothly over a certain temperature range and does not appear abruptly.
While for the intermediate regime the presented scenario seems to be the most likely explanation of our findings, we recall that an increase in the low-frequency conductivity was previously taken as indication of pseudogap formation in iron-based superconductors Moon12 . Moreover, in cuprates the crossover between pseudogap and superconducting gap is known to take place at similar energy scale. Since we are very close to the limit of our resolvable measurement range, we cannot to rule out that our observations are caused by a pseudogap-like formation, where the complex interaction of different magnetic transitions have an impact on the condensate of the Cooper pairs.
V Magnetic properties
In the parent compound , the magnetic moments order below in an A-type antiferromagnetic structure; i.e. while the spins are aligned ferromagnetically within the -plane, neighboring layers are coupled antiferromagnetically ShuaiAFM . For , the isovalent substitution of As with P leads to a canting of the spins out of the -plane, and therefore to a ferromagnetic net component along the -direction SinaEu . As the canting increases with further P substitution, also the competition between ferromagnetism and antiferromagnetic Ruderman-Kittel-Kasuya-Yoshida (RKKY) exchange increases. Therefore, an additional magnetic phase – the reentrant spin glass phase – sets in at a certain amount of phosphorous with SpinGlass . As this phase might be the key in understanding how superconductivity coexists with the local magnetism in Eu-based iron pnictides, we carried out extensive magnetic investigations on our electron-doped EuFe2As2 compounds, Eu(Fe0.91Ir0.09)2As2 and Eu(Fe0.93Rh0.07)2As2.
V.1 Evidence for a spin glass
The most prominent feature identifying a spin-glass phase is the time dependence of the dc magnetization, together with a distinct frequency dependence of the ac-susceptibility known as Vogel-Fulcher behavior Binder . However, in superconductors also vortex dynamics leads to a time-dependent magnetization, hence complicating the analysis Zhou . Nevertheless, as demonstrated previously for SpinGlass , both phases can be separated by their opposite signs in the time-dependent behavior (for instance in the FCH-FCC curve, the difference between field-cooled heating and field-cooled cooling curves). Following the procedure developed for the isovalent substitution, in the following we will provide evidence that these phases are present in electron-doped samples, too.
V.1.1
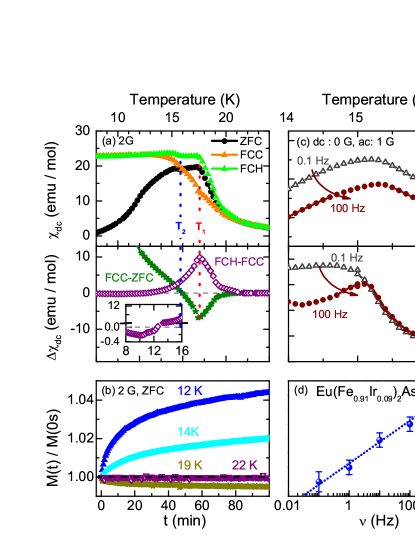
For the Ir-doped sample, the characteristic magnetization data are presented in Fig. 7. The dc susceptibility [panel (a)] looks quite similar to the one obtained in Ref. SpinGlass, : the double hump-like feature in the ZFC and FCH curve already indicates both magnetic transitions: the Eu-ordering corresponding to the first hump at , and the spin-glass phase indicated by the second hump at , with . The measurements are performed at very low magnetic field () since the spin-glass phase is already suppressed by .
Both, a thermal hysteresis (evidenced by the finite difference between field-cooled heating and zero-field cooled cooling curves: FCC-ZFC), and time-dependent processes (visible in FCH-FCC ) set in at the superconducting transition, which can be ascribed to vortex dynamics. At , a peak occurs in the FCH-FCC curve, and a dip in FCC-ZFC, meaning that the onset of Eu ordering influences the superconducting phase. At lower , both differential curves show a sign change, which is typical for the spin-glass phase SpinGlass . For the FCH-FCC curve, the sign change is not directly at , but at slightly lower temperatures, probably due to the dominant superconducting state which masks the negative contribution. Time dependent measurements in the ZFC run further prove two distinct contributions to the overall time dependence as plotted in Fig. 7(b). It is important to note that any time dependence disappears at , ruling out possible measurement artifact. For the normalized magnetization decreases with time, while for temperatures , increases significantly; we ascribe the stronger positive contribution to the spin-glass phase. Finally, the typical spin glass behavior can also be identified in ac susceptibility measurements with a very small amplitude of and without dc offset: here, a peak appears directly below in and [cf. Fig. 7(c)]. With increasing frequency, the peak shifts to higher temperatures. The peak position in follows a Vogel-Fulcher behavior, verifying the identification of this transition to the spin glass phase.
In the following we will discuss in more detail the imaginary part of the ac susceptibility, because it contains several different contributions, as best seen in a comparison between ac-, dc susceptibility and resistivity data [Fig. 8(a) and (b)]. The onset of superconductivity below leads to non-zero values in , corresponding to the ZFC-FCH splitting due to screening currents in the dc magnetization [Fig. 7(a)]. A narrow sharp peak in and a small dip in at are caused by a maximum in the critical current density, known as peak effect PeakEffect . Around , a minimum in coincides with the first peak in the ZFC-curve, marking the Eu2+ antiferromagnetic transition; it results from a destruction of the superconducting state by the local Eu-magnetism. Below , a peak in and can be ascribed to the spin-glass phase; it is almost suppressed by a dc magnetic offset of only .
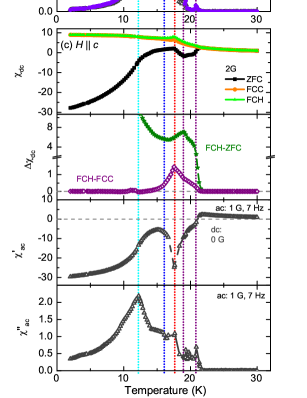
Additional information can be extracted from Fig. 8(c) where the magnetization results are displayed for applied fields along the -direction. The most prominent feature for this orientation is the strong negative values for the ZFC magnetization reached at low temperatures; this is well known to result from the anisotropy of iron pnictides SFdensity . In general, screening currents form in the superconducting plane when a magnetic field is applied along the perpendicular direction. In iron pnictides, the -plane shows much higher superfluid densities than along the -direction. Therefore, screening currents can develop much more efficiently within the -plane, visible as a negative magnetization for . Otherwise, for superconductivity manifests in a way very similar to the in-plane direction: a thermal hysteresis at , a peak at , and the peak effect is visible.
The spin-glass phase, in contrast, is barely visible along the -direction; for instance, in the ZFC, FCC, and FCH curves, only one hump can be detected, which corresponds to the antiferromagnetic transition at . A small hump is visible in the ac measurements, however, without any resolvable time- or frequency-dependence; therefore we ascribe it to a measurement artifact due to non-perfect alignment of the sample within the SQUID. For temperatures , the FCC and FCH curves are rather flat; this is typical for an -type antiferromagnet when the out-of-plane direction is probed. A small increase of these curves at lower temperatures, as well as a weak peak at probably results from canting of the Eu2+ moments along the -direction; similar observations have been reported for P-substituted samples SinaEu . Unfortunately, in the superconducting specimen its contribution is too weak for a clear identification.
V.1.2
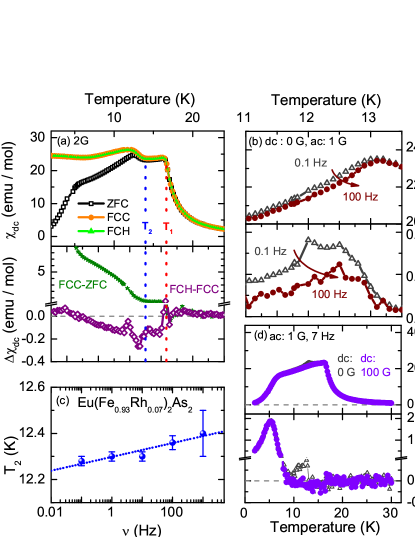
Figure 9 presents the results of the magnetization measurements for the Rh-doped sample. In this case, the sample mass was at the sensitivity limit of the SQUID leading to much noisier curves than for the Ir specimen. However, the main features are very similar, as we will discuss in the following. The onset of superconductivity is barely visible but leads to slightly non-zero, positive FCH-FCC values. A hump in at marks the antiferromagnetic order; it corresponds to a weak peak in the FCH-FCC curve. At lower the double hump-like feature in the ZFC, FCC and FCH curves, as well as negative values of FCH-FCC indicate the presence of the reentrant spin glass phase. In this case, as the superconducting state is weaker, the minimum of FCH-FCC appears much closer to than in the Ir sample. Again, the frequency-dependent ac susceptibility shows for increasing ac fields a shifting of the peaks in and to higher , shown in Fig. 9(b); the peak position (fitted with a Gaussian distribution) also follows Vogel-Fulcher behavior as demonstrated in Fig. 9 (c).
The poor signal-to-noise ratio does not allow us to extract here as much information from as for ; nevertheless, for the sake of completeness, we present the results in Fig. 9(d) for a large temperature range. In contrast to the Ir-doped sample, for does not reach negative values, indicating a stronger magnetism and/or a weaker superconductivity phase – which would be both consistent with speculations that this sample is actually underdoped. For an offset of , a peak is located below in both, and , corresponding to the spin-glass phase. For a constant magnetic-field offset of , it is already completely suppressed. Similar to the Ir sample, an additional pronounced peak appears in at lower temperatures.
V.2 Indications for an additional magnetic transition
From our ac susceptibility measurements over a broad temperature range, we could identify a very pronounced peak in , which also appears as an inflection point in and in the ZFC curve. This feature can be seen even better when the magnetic field is applied along the -direction. While a dc-offset of completely suppresses the spin-glass peak in , this additional feature is barely affected by this offset. For the feature appears around ; for the Rh-doped sample, at . There are two possibilities to explain the observation of this signal. A ferromagnetic canting or phase would lead to a signal in . In Ref. SinaReview, an extensive discussion is presented why the canting of the moments does not take place directly at , but develops with decreasing temperature. This would explain the observation of an additional phase in Ru-doped compounds Ru . Alternatively, the feature could originate due to complex vortex dynamics. In order to resolve this issue, further investigations on overdoped samples should be carried out, which do not show any traces of superconductivity.
VI Conclusion
Transport and magnetic investigations on electron-doped and single crystals revealed the presence of the reentrant spin-glass phase. The properties resemble the behavior observed in isovalent substituted compounds SpinGlass . Since the two materials contain different dopants, we suggest that the reentrant spin-glass phase is present in all electron-doped compounds. For the Ir-doped sample, a very strong feature in the imaginary part of the ac susceptibility was found, which might be explained by vortex dynamics; however, future investigations on different doping levels are necessary to clarify its origin.
Optical measurements revealed that at low-frequencies the normal-state optical response of each compound is dominated by two Drude-like components with different scattering rates. At the lowest temperatures, in the superconducting state, the Drude components become gapped and the optical spectra can be best described by two full-gap dirty-limit BCS terms, with the gap values being close to each other for both the terms in each system. In , the traces of reentrant superconductivity are seen in the optical spectra: in the reentrant phase only one basically temperature-independent gap can be resolved, while a second superconducting gap gets merely visible at the lowest temperatures when zero-resistivity is finally reached. We explain this behavior as the effect of magnetism: the superconducting state can fully develop only when the spin-glass phase is formed.
VII Acknowledgment
We thank U. S. Pracht for fruitful discussions and G. Untereiner for expert experimental support. This work was supported by the Deutsche Forschungsgemeinschaft (DFG SPP 1458, DR228/42-1 and DR228/44-1).
References
- (1) Y. Kamihara, T. Watanabe, M. Hirano, and H. Hosono, J. Am. Chem. Soc. 130 (11), 3296 (2008).
- (2) N. L. Wang, H. Hosono, and P. Dai, Iron-based Superconductors - Materials, Properties and Mechanisms, (Pan Stanford Publishing Pte. Ltd., 2013).
- (3) S. Zapf, and M. Dressel, Rep. Progr. Phys. 80, 016501 (2017).
- (4) D. Wu, N. Barišić, N. Drichko, S. Kaiser, A. Faridian, M. Dressel, S. Jiang, Z. Ren, L.-J. Li, G.-H. Cao, Z.-A. Xu, H.-S. Jeevan, and P. Gegenwart, Phys. Rev. B. 79, 155103 (2009).
- (5) S. Zapf, C. Stingl, K. W. Post, J. Maiwald, N. Bach, I. Pietsch, D. Neubauer, A. Löhle, C. Clauss, S. Jiang, H. S. Jeevan, D. N. Basov, P. Gegenwart, and M. Dressel, Phys. Rev. Lett. 113, 227001 (2014).
- (6) E. Müller-Hartmann, and J. Zittartz, Phys. Rev. Lett. 26, 428 (1971).
- (7) K-H. Müller, and V. N. Narozhnyi, Rep. Prog. Phys. 64, 943 (2001).
- (8) U. B. Paramanik, Debarchan Das, R. Prasad, and Z. Hossain, J. Phys.: Condens. Matter 25, 26 (2013).
- (9) C. F. Miclea, M. Nicklas, H. S. Jeevan, D. Kasinathan, Z. Hossain, H. Rosner, P. Gegenwart, C. Geibel, and F. Steglich, Phys. Rev. B 79, 212509 (2009).
- (10) W.-H. Jiao, Y. Liu, Z.-T. Tang, Y.-K. Li, X.-F. Xu, Z. Ren, Z.-A. Xu, and G.-H. Cao, Supercond. Sci. Technol. 30, 025012 (2017).
- (11) S. Jiang, Y. K. Luo, Z. Ren, Z. W. Zhu, C. Wang, X. F. Xu, Q. Tao, G. H. Cao, and Z. A. Xu, New J. Phys. 11, 025007 (2009).
- (12) W. H. Jiao, Q. Tao, J. K. Bao, Y. L. Sun, C. M. Feng, Z. A. Xu, I. Nowik, I. Felner, and G. H. Cao, Europhys. Lett. 95, 67007 (2011).
- (13) S. Zapf, D. Wu, L. Bogani, H. S. Jeevan, P. Gegenwart, and M. Dressel, Phys. Rev. B. 84, 140503 (2011).
- (14) S. Zapf, H. S. Jeevan, T. Ivek, F. Pfister, F. Klingert, S. Jiang, D. Wu, P. Gegenwart, R. K. Kremer, and M. Dressel, Phys. Rev. Lett. 110, 237002 (2013).
- (15) W. H. Jiao, J. K. Bao, Q. Tao, H. Jiang, C. M. Feng, Z. A. Xu, and G. H. Cao, JPCS. 400, 022038 (2012).
- (16) W. T. Jin, S. Nandi, Y. Xiao, Y. Su, O. Zaharko, Z. Guguchia, Z. Bukowski, S. Price, W. H. Jiao, G. H. Cao, and Th. Brückel, Phys. Rev. B 88, 214516 (2013).
- (17) V. K. Anand, D. T. Adroja, A. Bhattacharyya, U. B. Paramanik, P. Manuel, A. D. Hillier, D. Khalyavin, and Z. Hossain, Phys. Rev. B 91, 094427 (2015).
- (18) W. T. Jin, W. Li, Y. Su, S. Nandi, Y. Xiao, W. H. Jiao, M. Meven, A. P. Sazonov, E. Feng, Y. Chen, C. S. Ting, G. H. Cao, and Th. Brückel, Phys. Rev. B. 91, 064506 (2015).
- (19) S. Nandi, W. T. Jin, Y. Xiao, Y. Su, S. Price, D. K. Shukla, J. Strempfer, H. S. Jeevan, P. Gegenwart, and Th. Brückel, Phys. Rev. B 89, 014512 (2014).
- (20) W. H. Jiao, H. F. Zhai, J. K. Bao, Y. K. Luo, Q. Tao, C. M. Feng, Z. A. Xu, and G. H. Cao, New. J. Phys. 15, 113002 (2013).
- (21) T. Shibauchi, A. Carrington, and Y. Matsuda, Ann. Rev. Condens. Matter Phys. 5, 113 (2014).
- (22) N. Kurita, M. Kimata, K. Kodama, A. Harada, M. Tomita, H.-S. Suzuki, T. Matsumoto, K. Murata, S. Uji, and T. Terashima, Phys. Rev. B 88, 224510 (2013).
- (23) N. Barišić, D. Wu, M. Dressel, L. J. Li, G. H. Cao, and Z. A. Xu, Phys. Rev. B. 82, 054518 (2010).
- (24) Y. Tokiwa, S. H. Hübner, O. Beck, H. S. Jeevan, and P. Gegenwart, Phys. Rev. B 86, 220505 (2012).
- (25) S. Zapf, D. Neubauer, K. W. Post, A. Kadau, J. Merz, C. Clauss, A. Löhle, H. S. Jeevan, P. Gegenwart, D. N. Basov, and M. Dressel, Compt. Ren. Phys. 17, 188 (2016).
- (26) D. Wu, N. Barišić, P. Kallina, A. Faridian, B. Gorshunov, N. Drichko, L. J. Li, X. Lin, G. H. Cao, Z. A. Xu, N. L. Wang, and M. Dressel, Phys. Rev. B 81, 100512 (2010).
- (27) M. Dressel and G. Grüner, Electrodynamics of Solids (Cambridge University Press, Cambridge, 2002).
- (28) M. Nakajima, T. Liang, S. Ishida, Y. Tomioka, K. Kihou, C. H. Lee, A. Iyo, H. Eisaki, T. Kakeshita, T. Ito, and S. Uchida, Proc. Nat. Acad. Sci. 108, 12238 (2011).
- (29) X. Bing, D. Yao-Min, X. Hong, R. P. S. M. Lobo, and Q. Xiang-Gang, Chinese Physics B 23, 087401 (2014).
- (30) A. A. Schafgans, S. J. Moon, B. C. Pursley, A. D. LaForge, M. M. Qazilbash, A. S. Sefat, D. Mandrus, K. Haule, G. Kotliar, and D. N. Basov, Phys. Rev. Lett. 108, 147002 (2012).
- (31) V.I. Torgashev, private communications (2009).
- (32) A. Akrap, J. J. Tu, L. J. Li, G. H. Cao, Z. A. Xu, and C. C. Homes, Phys. Rev. B 80, 180502 (2009).
- (33) M. Dressel, Adv. Condens. Matter Phys. 2013, 104379, (2013).
- (34) U. S. Pracht, E. Heintze, C. Clauss, D. Hafner, R. Bek, D. Werner, S. Gelhorn, M. Scheffler, M. Dressel, D. Sherman, B. Gorshunov, K. S. Il in, D. Henrich, M. Siegel IEEE Trans. THz Sci. Technol. 3, 269 (2013).
- (35) E. G. Maksimov, A. E. Karakozov, B. P. Gorshunov, A.S. Prokhorov, A. A. Voronkov, E. S. Zhukova, V. S. Nozdrin, S. S. Zhukov, D. Wu, M. Dressel, S. Haindl, K. Iida, and B. Holzapfel, Phys. Rev. B 83, 140502 (2011).
- (36) M. Dressel, D. Wu, N. Barišić, and B. P. Gorshunov, J. Phys. Chem. Solids 72, 514 (2011).
- (37) D. Neubauer, A. V. Pronin, S. Zapf, J. Merz, H. S. Jeevan, W. H. Jiao, P. Gegenwart, G. H. Cao and M. Dressel, Phys. Stat. Sol. B, 254, 1600148 (2017).
- (38) Y. M. Dai, H. Miao, L. Y. Xing, X. C. Wang, C. Q. Jin, H. Ding, and C. C. Homes, Phys. Rev. B 93, 054508 (2016).
- (39) We should note that it might not be appropriate to identify the narrow and broad Drude components with different bands. Also the clean and dirty limit superconductivity in Eu(Fe0.91Ir0.09)2As2, Eu(Fe0.93Rh0.07)2As2 and possibly in other pnictides should not simply be assigned to distinct bands as intra- and interband scattering processes might be of importance.
- (40) R. P. S. M. Lobo, Y. M. Dai, U. Nagel, T. Rõõm, J. P. Carbotte, T. Timusk, A. Forget, and D. Colson, Phys. Rev. B 82, 100506 (2010).
- (41) X. Xi, Y. M. Dai, C. C. Homes, M. Kidszun, S. Haindl, and G. L. Carr, Phys. Rev. B 87, 180509 (2013).
- (42) A. Pimenov, A. Loidl, and S. I. Krasnosvobodtsev, Phys. Rev. B 65, 172502 (2002).
- (43) M. B. Schilling, A. Baumgartner, B. Gorshunov, E.S Zhukova, V.A. Dravin, K.V. Mitsen, D. V. Efremov, O. V. Dolgov, K. Iida, M. Dressel, and S. Zapf, Phys. Rev. B 93, 174515 (2016).
- (44) J. Li, and Y. Wang, EPL (Europhys. Lett.) 88, 17009 (2009).
- (45) S. J. Moon, A. A. Schafgans, S. Kasahara, T. Shibauchi, T. Terashima, Y. Matsuda, M. A. Tanatar, R. Prozorov, A. Thaler, P. C. Canfield, A. S. Sefat, D. Mandrus, and D. N. Basov, Phys. Rev. Lett. 109, 027006 (2012).
- (46) S. Jiang, Y. Luo, Z. Ren, Z. Zhu, C. Wang, X. Xu, Q. Tao, G. Cao, and Z. Xu, New J. Phys. 11, 025007 (2009).
- (47) K. Binder, and A. P. Young, Rev. Mod. Phys. 58, 801 (1986).
- (48) W. Zhou, X. Xing, W. Wu, H. Zhao, and Z. Shi, Sci. Rep. 6, 22278 (2016).
- (49) S. J. Moon, A. A. Schafgans, M. A. Tanatar, R. Prozorov, A. Thaler, P. C. Canfield, A. S. Sefat, D. Mandrus, and D. N. Basov, Phys. Rev. Lett. 110, 097003 (2013).
- (50) J. Giapintzakis, R. L. Neiman, D. M. Ginsberg, and M. A. Kirk, Phys. Rev. B 50, 16001 (1994).