Molecular Environments of Three Large Supernova Remnants in the Third Galactic Quadrant: G205.50.5, G206.92.3, and G213.00.6
Abstract
We present CO observations toward three large supernova remnants (SNRs) in the third Galactic quadrant using the Purple Mountain Observatory Delingha 13.7 m millimeter-wavelength telescope. The observations are part of the high-resolution CO survey of the Galactic plane between Galactic longitudes to and latitudes to . CO emission was detected toward the three SNRs: G205.50.5 (Monoceros Nebula), G206.92.3 (PKS 064606), and G213.00.6. Both of SNRs G205.50.5 and G213.00.6 exhibit the morphological agreement (or spatial correspondences) between the remnant and the surrounding molecular clouds (MCs), as well as kinematic signatures of shock perturbation in the molecular gas. We confirm that the two SNRs are physically associated with their ambient MCs and the shock of SNRs is interacting with the dense, clumpy molecular gas. SNR G206.92.3, which is close to the northeastern edge of the Monoceros Nebula, displays the spatial coincidence with molecular partial shell structures at . While no significant line broadening has been detected within or near the remnant, the strong morphological correspondence between the SNR and the molecular cavity implies that SNR G206.92.3 is probably associated with the CO gas and is evolving in the low-density environment. The physical features of individual SNRs, together with the relationship between SNRs and their nearby objects, are also discussed.
1 INTRODUCTION
Most core-collapse supernovae (SNe) from high-mass stars may explode promptly and are thought to be associated with the molecular clouds (MCs) from which they were born. Therefore, the subsequent supernova remnants (SNRs) may evolve close to their parental MCs or the nearby molecular environment. So far, there are several signposts to show the physical contact/interaction between SNRs and their molecular environments, e.g., the presence of 1720 MHz OH maser emission, molecular line broadenings or asymmetric profiles, high molecular line ratios between different excitation states, detection of H2 and/or [Fe II] lines in near-infrared, specific infrared colors within an SNR, and often used morphological correspondence in multiwavelength with SNR features (see Jiang et al., 2010). It is also important to study the interplay of SNR–MC systems for investigating various physical and astrophysical processes therein (e.g., Chen et al., 2014; Dubner & Giacani, 2015; Slane et al., 2015).
There are currently 294 SNRs known in the Milky Way (Green, 2014) and about 70 of them are confirmed or suggested to be associated with MCs (refer to, e.g., Jiang et al., 2010; Chen et al., 2014). CO, as an indicator of H2, is the most widely used tracer of MCs and it is very common and useful when investigating the nature of the molecular ISM in galaxies. CO observations also play a key role in studying the molecular environment and physical characteristics of SNR–MC interacting systems. To date, three large-scale, systematic CO surveys were performed to investigate the SNR–MC association (Huang & Thaddeus, 1986; Jeong et al., 2012; Kilpatrick et al., 2016). Recently, several individual SNR–MC systems were also investigated using CO lines (Anderl et al., 2014, e.g., SNR W44 by; Kilpatrick et al., 2014, SNR Cassiopeia A by; Su et al., 2014a, SNR IC 443 by; Su et al., 2014b, SNR G22.70.2 by; Zhou et al., 2014, SNR G127.10.5 by; Paron et al., 2015, SNR G18.80.3 by; Rho et al., 2017, SNR G357.70.3 by; Sano et al., 2016, SNR RCW 86 by; Zhou et al., 2016a, SNR Tycho by and Chen et al., 2016; and Zhou et al., 2016b, SNR HB 3 by). Nevertheless, few studies have been conducted to investigate the SNRs’ molecular environment in the third Galactic quadrant.
The Milky Way Imaging Scroll Painting (MWISP) project111http://www.radioast.nsdc.cn/mwisp.php is a large 12CO (=1–0), 13CO (=1–0), and C18O (=1–0) survey of the northern Galactic plane. The systematic and unbiased CO survey, which has high spatial () and velocity () resolution, will provide the detailed distributions and fully sampled images of molecular gas from to and latitudes from to . The high-quality CO data also provide us with a good opportunity to study the molecular environment of extended SNRs from large scale to small scale. Especially for SNRs with large angular size, the unbiased CO survey can offer detailed molecular gas information on SNR–MC interactions.
In this paper, we aim to investigate the molecular environment of three large SNRs: G205.50.5 (Monoceros Nebula), G206.92.3 (PKS 064606), and G213.00.6 from our new CO survey. The three SNRs are all in the third Galactic quadrant and their angular sizes are . Benefiting from the large-scale spectroscopic mapping of the CO survey, we analyzed the correlation between these three remnants and their molecular environment mainly from SNR–MC’s morphological correspondences (e.g., molecular arc, shell, cavity, interface, and coincidence in multiwavelength emission, etc.), molecular line diagnostics (e.g., broad molecular line features or asymmetric line profiles), and special kinematic features (e.g., velocity gradient revealed in the positionvelocity (PV) diagram).
In Section 2, we describe the CO observation and the data reduction, and in Section 3 we present our results and discussions for individual SNRs. Finally, a summary is given in Section 4.
2 CO data from MWISP
The MWISP project, which started in 2011, is a large CO survey using the 13.7 m millimeter-wavelength telescope located at Delingha in China. The 12CO (=1–0), 13CO (=1–0), and C18O (=1–0) observations are performed simultaneously with the nine-beam Superconducting Spectroscopic Array Receiver (SSAR) system (Shan et al., 2012). A Fast Fourier Transform Spectrometer (FFTS) with a total bandwidth of 1 GHz provides 16,384 channels, resulting in a spectral resolution of 61 kHz, equivalent to a velocity resolution of at 110 GHz. The intermediate frequency (IF) band is 2.640.5 GHz so that three CO isotope lines (12CO line at 115.271 GHz, 13CO line at 110.201 GHz, and C18O line at 109.782 GHz) can be covered by the 1 GHz band when the local oscillator (LO) is at 112.6 GHz. We should specify that the FFTS is sideband separated and 12CO line is in the upper while 13CO and C18O are in the lower band. The half-power beamwidth (HPBW) of the telescope is about and the pointing accuracy is better than in all observing epochs. The main beam efficiency and other useful parameters can be found from the status report222http://www.radioast.nsdc.cn/mwisp.php.
All covered sky will be divided into 10,941 cells and each cell with a dimension of 30 is scanned along the Galactic longitude and the Galactic latitude to reduce the fluctuation of noise. Observations are conducted in position-switch On-The-Fly (OTF) mode, scanning each cell at a rate of (or ) per second with a dump time of 0.3 s (or 0.2 s). Before the observation, the background reference region () near the cell has been carefully checked (0.3 K in 12CO emission at any points) to ensure no or little emission from the off region. In addition, the water vapor in the terrestrial atmosphere contributes noise in our CO spectra. Our survey requires relatively dry and stable atmosphere conditions to guarantee the quality of the data. As a result, typical system temperatures are within 190–350 K at the upper sideband and 140–230 K at the lower sideband depending on weather conditions, cell’s elevations, and off positions.
All data were reduced using the GILDAS/CLASS package333http://www.iram.fr/IRAMFR/GILDAS. After the first order (linear) baseline fitting and mosaicing the image, the final three-dimensional (3D) cube data were obtained with a grid spacing of . The typical sensitivity (RMS) is about 0.5 K for 12CO (=1–0) at the channel width of 0.16 and 0.3 K for 13CO (=1–0) and C18O (=1–0) at 0.17. As of this writing the MWISP project has completed about half of its planned area of coverage and the three large SNRs G205.50.5, G206.92.3, and G213.00.6, including their nearby regions, were all mapped from 2012 January to 2016 April. Generally, C18O (=1–0) emission is too weak to give any further details toward these SNRs. Our discussions will focus primarily on 12CO and 13CO data.
3 RESULTS AND DISCUSSIONS
3.1 SNR G205.50.5 (Monoceros Nebula)
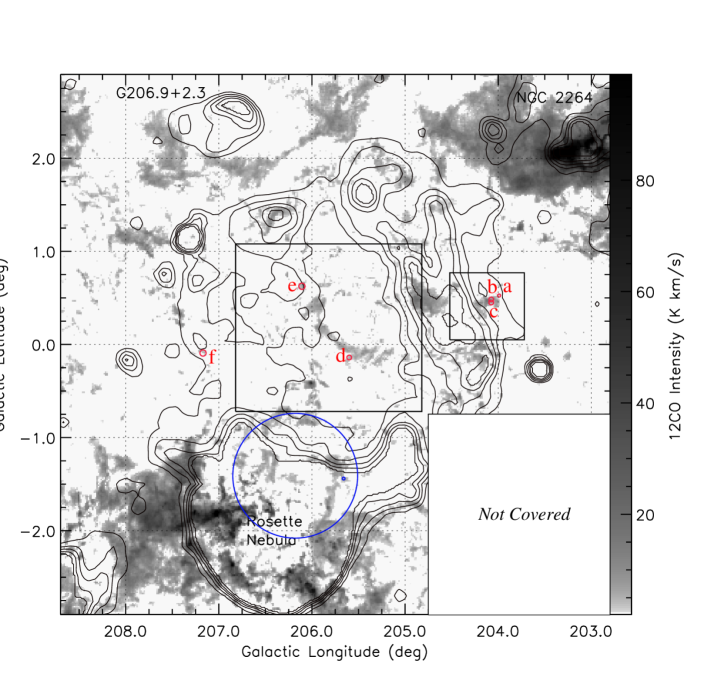
G205.50.5 (Monoceros Nebula) is a very large SNR with a size of . Xiao & Zhu (2012) showed that the radio spectral index () of the remnant is about , derived from 21 cm, 11 cm, and 6 cm radio continuum data, which is generally consistent with the result of previous works (Dickel & Denoyer, 1975; Graham et al., 1982). Throughout this paper, all directions are described in Galactic coordinates to match the MWISP CO survey. The bright Rosette Nebula (Sh 2-275) and open cluster NGC 2264 (Sh 2-273) are located near the southern and northwestern boundary of the remnant, respectively. Odegard (1986) suggested that the SNR is probably located behind the Rosette Nebula because of the absorption of the remnant’s nonthermal emission by the southern H ii region Sh 2-275. Xiao & Zhu (2012) also suggested that the SNR is probably associated with the Rosette Nebula because of the identified western partial shell structures at using the new Arecibo HI 21 cm data. The remnant displays contrasting optical filamentary structures mainly on its northwestern, western, and southwestern edges. These sharp optical filaments, especially toward the western boundary of the remnant, are well correlated with the bright radio shells (Davies et al., 1978) and the X-ray emission regions (Leahy et al., 1985, 1986). According to the Sino-German 6 cm survey, Gao et al. (2011) found that the magnetic field is mainly aligned with the western shell of the remnant.
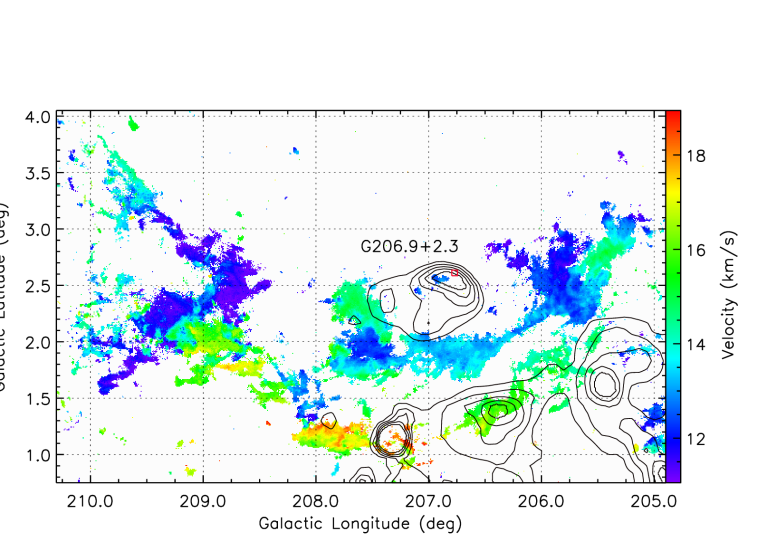
In our large CO survey with spatial resolution better than , we detected molecular gas over a wide velocity range from to 50 toward SNR G205.50.5 (Figure 1). Obviously, two large giant molecular cloud (GMC) complexes are associated with the southern Rosette Nebula (MCs in the lower-left corner of Figure 1, 3–18) and the northwestern NGC 2264 (MCs in the upper-right corner of Figure 1, 3–12), respectively. Our unbiased CO survey revealed huge amounts of molecular gas in the velocity range from 25 to 50. The 25–50 MCs, which have small sizes and weak CO emission, are distributed widely and separately over the field of view (FOV). The CO emission of the 25–50 components along the line of sight (LOS) is probably from the distant molecular gas (e.g., the Perseus and/or the Outer arm in the direction). We did not find any evidence of physical connection between the 25 molecular gas and the remnant. We will not discuss the MC components and we will mainly focus on the 25 MCs in this section.
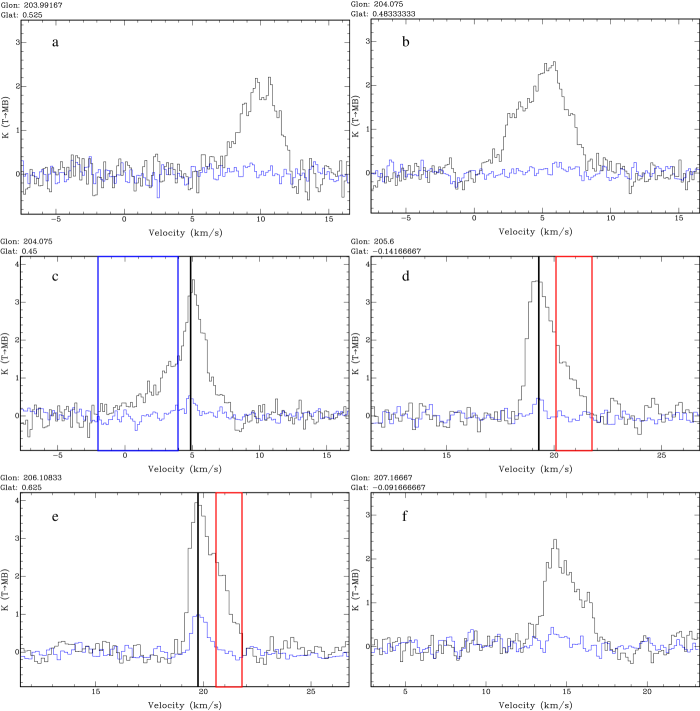
When the SNR’s shock is encountering a dense medium, the shock will compress, heat, accelerate, and even dissociate molecules, which will lead to a wide variety of observable effects. The material may carry enough momentum to accelerate the molecular gas to broad velocity width. Generally, the asymmetric line profiles from 12CO emission usually imply the turbulent molecular gas because such emission is more easily influenced by the shock. On the contrary, 13CO emission is optically thin, which is not heavily influenced by SNR’s shock. In another words, 12CO emission is from the enveloping layer of low-density gas and is readily perturbed by local turbulence while 13CO emission is not so. The line peak of 13CO emission is thus a good indicator of the LSR velocity of unperturbed clouds. As a result, the asymmetric line profiles of 12CO can be picked out from the LSR velocity range of the 13CO component (e.g., refer to the blue broadening from Figures 7 and 8 for shocked gas a; the red broadening from Figures 3 and 8 for shocked gas d–e).
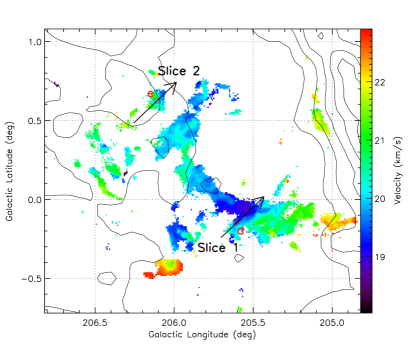
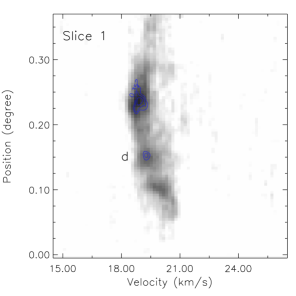
Actually, several signatures of SNR–MC interaction toward the remnant are revealed in our CO observations. First, the molecular gas at 19 (in the interval of 18–23) seems to be concentrated in the center region of SNR G205.50.5 (Figure 2) and this molecular gas exhibits weak redshifted broadening in 12CO emission (e.g., the typical spectra of d and e in Figure 8). The broadening of the two positions is not very large (2–3 from the 13CO peak) but can be easily discerned from the asymmetric 12CO profile. It is worth noting that the weak emission in 12CO is systematic redshifted with respect to the unperturbed clouds traced by 13CO (Figure 3), which indicates the 12CO wing component in the velocity interval of 19–22 and the 13CO component at a slightly low LSR velocity of 19 are apparently connected. Therefore, the weak emission seen in the redshifted 12CO wing (d–f in Figure 8) and the 13CO emission is from the coherent molecular gas, but not from the separated source with slightly different distances along the LOS. Generally, the redshifted broadening of d–f is not very large. High J CO lines (e.g., 2–1 and/or 3–2) may be useful for investigating these regions in the future.
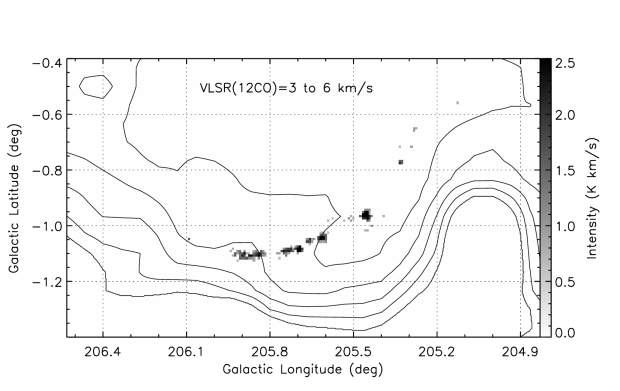
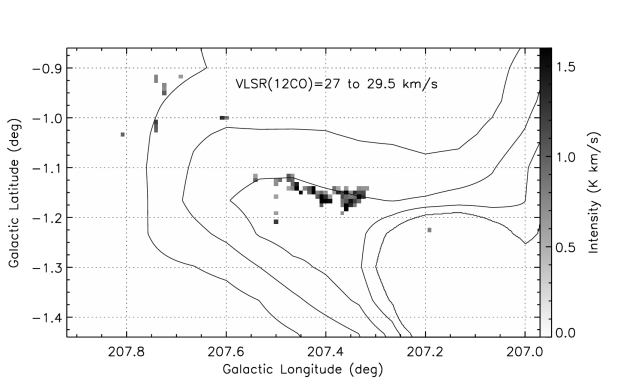
Second, two partial shell structures traced by 12CO in =3–6 and =27–29.5 seem to be correlated with the southwestern (Figure 4) and the southeastern (Figure 5) radio emission, respectively. Especially, the partial shell structure revealed by the 3–6 molecular component is as long as 52′, or 24 pc at a distance of 1.6 kpc (see below). We suggest that the molecular structures are probably related to the remnant; nevertheless, the CO emission of the two shells is too weak to be studied in detail.
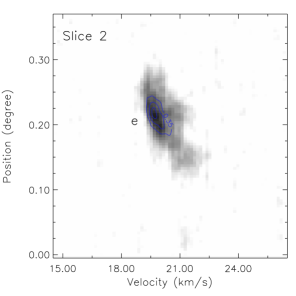
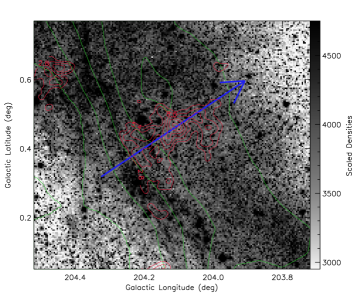
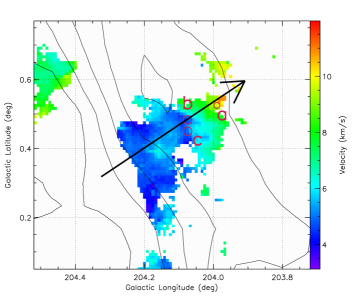
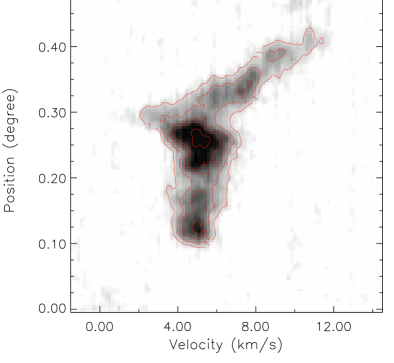
Third, in the western edge of the SNR, an interesting MC structure is found to be physically associated with the remnant (see the right rectangle in Figure 1). Figure 6 displays striking spatial coincidence between the 5 MC structure (in the interval of 3–12) and the remnant’s shell in the west boundary of the SNR. In the left panel of this figure, a bright optical filament, as well as the radio ridge seen in 21 cm data, is elongated along the northeast–southwest direction. Note that both of the 11 cm (the Effelsberg 11 cm survey, see Furst et al., 1990) and the 6 cm (the Parkes-MIT-NRAO (PMN) 4850 MHz survey, see Condon et al., 1993) radio emission also can be discerned from the ambient background emission in such a region with higher resolution and sensitivity. The southeastern boundary of the MC is very sharp and follows exactly the remnant’s shell and resembles the outline of the bright optical filaments and the radio ridge. That is, the molecular gas forms a wall facing the bright optical filaments or the SNR’s shell. We found line-broadening features in such molecular gas (e.g., see a–c in Figure 8). Especially, a narrow component centered at 5 in the 13CO line, together with a blue wing component down to in 12CO line, is clearly recognized at position c, which can also be confirmed from Figure 7. It seems that the shocked gas traced by the line broadening is near the region of the 12CO intensity maximum (see the red contours in the left panel of Figure 6). Furthermore, a substantial velocity gradient of the molecular gas (Figure 7), is found to be mostly orthogonal to the shell of the SNR (refer to the direction denoted by the arrow in Figure 6). The velocity gradient of arcmin-1 (or pc-1 at 1.6 kpc) is very likely related to the SNR’s shock.
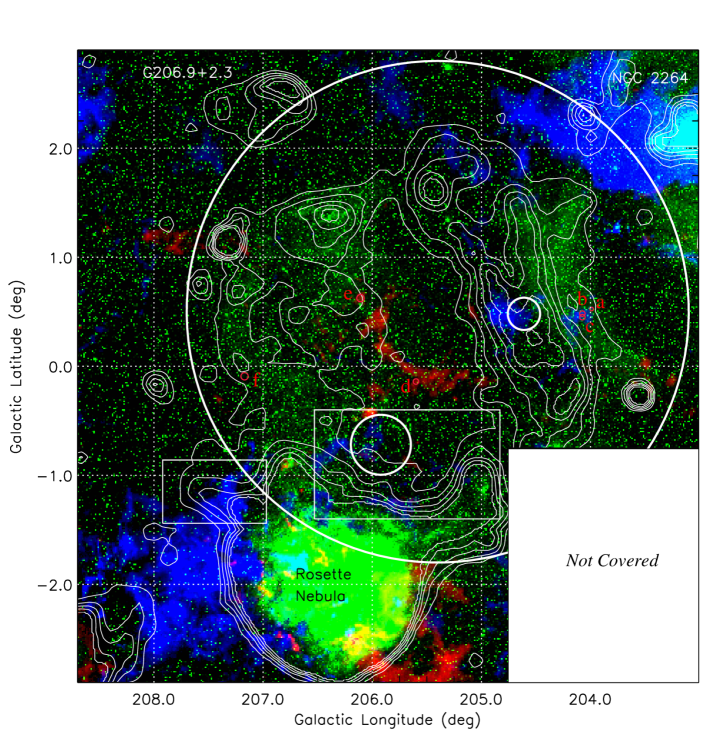
We thus suggest that the MCs at and are both associated with the remnant. Figure 9 shows the gas distribution of the two components. The 5 molecular gas (blue) lies in front of the remnant and has been accelerated toward us, which can be confirmed from the high optical obscuration (the left panel of Figure 6) and the molecular gas’s blueshifted profile in the direction (e.g., position c in Figure 8). The 19 gas (red), however, is probably on the farside of the remnant because of their little evidence of associated LOS obscuration and the redshifted profiles (see asymmetric line-broadening features at positions d–f in Figure 8). It is worth mentioning that not all molecular gas in Figure 9 is interacting with SNR G205.50.5. For example, the bule part in the upper-right corner of Figure 9, which belongs to the NGC 2264 GMC complex and is located at a distance of –900 pc (e.g., Sung et al., 1997; Baxter et al., 2009; Kamezaki et al., 2014) is probably not related to the SNR.
The excellent spatial correlation between the ionized gas traced by optical data and the molecular gas traced by CO data, as well as broad wings of line profiles in some regions, suggests that SNR G205.50.5 is interacting with the ambient molecular gas. We note that the nearby Rosette Nebula is also interacting with the same CO component, which is consistent with the result of other studies (e.g., Schneider et al., 1998; Dent et al., 2009). In Figure 9, the Rosette Nebula is found to be surrounded by the 3–12 and 18–23 MCs, indicating a connection between them. A detailed study between the Rosette Nebula and its ambient MCs will be presented in a forthcoming paper (C. Li et al. 2017, in preparation).
Furthermore, based on the 3D extinction map from Green et al. (2015), we can estimate the distance toward the molecular gas associated with SNR G205.50.5 to constrain the distance of the SNR. We select a region centered at (204107, 0471), which is just located at the CO emission peak of the 5 MCs (see the maximum of red contours in the left panel of Figure 6). We find a rapid increase for this region at a distance modulus (DM) of 11 (1.6 kpc). On the other hand, several regions are selected for the 19 MCs, which are at DM11–11.5 (1.6–2 kpc). Since the 5 and 19 MCs are both physically associated with the SNR, it indicates that SNR G205.5+0.5 is very likely located at a distance of 1.6 kpc. This value is coincident within the errors with a distance of 1.6 kpc according to the association between the SNR and the Rosette Nebula (refer to works of distance estimate of the Nebula; e.g., Hensberge et al., 2000; Park & Sung, 2002).
In combination with the above analysis, we suggest that SNR G205.50.5 and the nearby Rosette Nebula are associated and both of the two extended sources are at a similar distance of 1.6 kpc. Our new CO analysis confirms the speculation that SNR G205.50.5 is probably associated with the nearby Rosette Nebula (e.g., Oliver et al., 1996). Using the CfA 1.2 m millimeter-wavelength telescope, Oliver et al. (1996) found that MCs 18-24 (see Tables 1 and 2, Figures 2 and 6 in their paper) lie toward the two extended sources and are probably related to their nearby bright optical and radio emission. They estimated the emission-weighted average kinematic distance of 1.6 kpc for these MCs, which is in agreement with the photometric distance to the Rosette Nebula. Recently, Xiao & Zhu (2012) revealed partial neutral hydrogen shell structures outside the western boundary of the remnant. The interesting HI shell in the velocity interval of 5–25 seems to relate to SNR G205.50.5 and the Rosette Nebula, which strengthens the association between them.
Using the relation of initial total energy and the ambient gas density (e.g., erg, Equation 26 in Chevalier, 1974), the ambient density of the remnant is cm-3 for a remnant’s radius of 51 pc (e.g., size of at a distance of 1.6 kpc) and an expansion velocity of (Wallerstein & Jacobsen, 1976; Welsh et al., 2001; Dirks & Meyer, 2016), where is the initial total energy of the remnant in units of 1051 ergs. The low shock velocity of is consistent with the result that the remnant has weak [O iii] emission (Fesen et al., 1985). If the remnant is expanding into the ambient gas with such velocity, its age is estimated to be years based on the radiative-phase solution (e.g., , Equation 25 in Chevalier, 1974).
An extended or confused source, 3EG J06340521 (Hartman et al., 1999; Casandjian & Grenier, 2008), and a TeV source, HESS J0632057 (Aharonian et al., 2007), seem to be located close to the interface between SNR G205.50.5 and the Rosette Nebula (see blue circles in Figure 1). However, there is no further evidence to show the association between the two high-energy sources and the SNR. On the other hand, 2FGL sources of J0636.00554 and J0637.80737 (Nolan et al., 2012) are located close to the molecular gas revealed by our new CO survey (two little circles in Figure 9). Very recently, extended gamma-ray emission from /LAT observations was found inside the remnant (see Figures 3 and 4 in Katagiri et al., 2016). According to our study, the MC concentration in the velocity intervals of 3–12 and 18–23, which is shown to be associated with the remnant, is consistent well with the distribution of the background-subtracted gamma-ray emission. The confirmation of SNR–MC interaction toward SNR G205.50.5, as well as the spatial coincidences between the shocked molecular gas and the gamma-ray emission, indicates that the extended gamma-ray emission inside the remnant is very likely from the hadronic scenario. In the scenario, the high-energy emission near the old SNR can be naturally explained by the decay of neutral pions produced in interactions between hadrons accelerated by the remnant’s shock and its ambient dense molecular gas, which is also consistent with the theoretical analysis (e.g., Yamazaki et al., 2006; Fujita et al., 2009).
3.2 SNR G206.92.3 (PKS 064606)
SNR G206.92.3, which is also known as PKS 064606, is a faint and extended nonthermal radio source near the Monoceros Nebula (Figures 1 and 10). The radio spectral index of the SNR is about (Graham et al., 1982), which was recently confirmed by Gao et al. (2011, i.e., ). The remnant, which has relatively strong radio emission in its northwestern region, roughly shows an elliptical shape in radio emission (see contours in Figure 10). Near the northwestern radio peak, the optical data reveals a bright thin filament with a relatively high density (e.g., cm-3, position 1 at 20677 and 261 in Fesen et al., 1985). The enhanced X-ray emission from Einstein observations, which is close to the northwestern radio peak of the remnant, is suggested to be associated with SNR G206.92.3 (Leahy, 1986). Both of the X-ray and optical studies indicate that the SNR is probably evolving in low-density environment (Leahy, 1986; Ambrocio-Cruz et al., 2014) except for the relatively high density region near the radio peak (e.g., position 1 mentioned above).
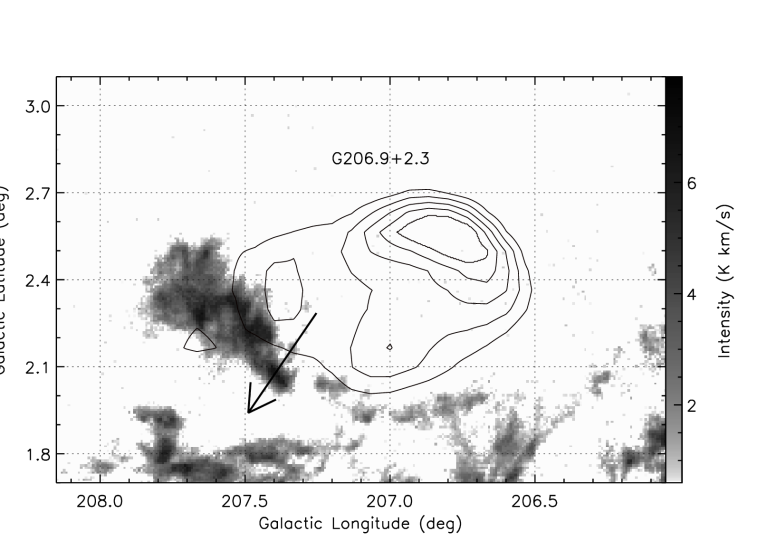
We covered a large CO map toward SNR G206.92.3 and the nearby regions with high sensitivity and resolution. CO emission is very weak in the direction of the remnant except for the nearby MC complex at 15 (in the velocity interval of 11–19, see Figure 10). The main body of the MC complex, which has weak 13CO emission over the FOV (see green parts in the figure), displays curved partial shell structures and extends over 5 degrees in longitude from 2049 to 2103. We find that the MC complex has a complicated velocity structure (Figure 11). The 13–15 molecular gas, together with the outside large-scale partial shell structures at 15–17, seems to form a molecular void toward the SNR. The curvature of the partial shell structures points in the direction from the SNR to the outside shell-like MCs. It is interesting to note that SNR G206.92.3 roughly lies in the geometrical center of the MC’s void, which agrees well with the low extinction values in the direction (see the case of G206.92.3 in Table 2 of Fesen et al., 1985). Some patches of molecular gas at an LSR velocity of 13 are found to coincide with the northwestern radio peak of the remnant (e.g., 20685 and 255, near the red box shown in Figure 11), which is consistent with the fact of the relatively high density there based on optical observation (refer to position 1 of SNR G206.92.3 in Fesen et al., 1985).
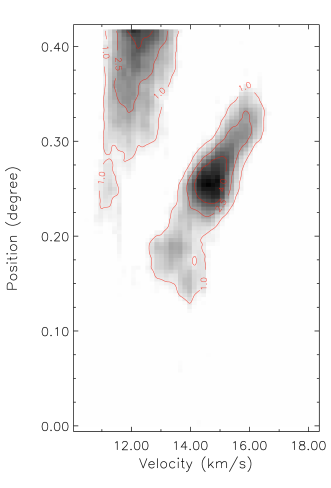
In particular, the 13–15 molecular gas is well along the southeastern boundary of the SNR. The close-up partial shell structure in the velocity interval of 14–15 is presented in Figure 12, in which the SNR is clearly surrounded by molecular shell from the east to the south. Moreover, a velocity gradient of arcmin-1 (or pc-1 at 1.6 kpc, see the PV diagram in Figure 13) is detected to be perpendicular to (see the arrow in Figure 12) the shell structure, which probably indicates that the molecular gas is expanding outward at several kilometers per second.
If SNR G206.92.3 is associated with the 15 molecular gas cavity, the kinematic distance of the remnant is estimated to be 1.6 kpc based on the A5 rotation curve model of Reid et al. (2014). The remnant’s angular size of thus corresponds to a physical radius of pc. Using the relation of the blast-wave energy and the cloud parameters and (e.g., erg, Equation 26 in McKee & Cowie, 1975), we can roughly estimate the shock velocity of the remnant. Adopting the numerical factor =1, explosion energy =1051 ergs, and the density n0.1 cm-3 (the upper limit, see discussions in Leahy, 1986), the shock velocity of the remnant is greater than . Therefore, SNR G206.92.3 is probably in the Sedov-Taylor phase and the age of the remnant is estimated to be less than 4000 years.
Finally, it should be noted that, although the above morphological correspondences may indicate an association between the SNR and the 15 molecular gas, there are few kinematic signatures to suggest an interaction scenario directly (e.g., no significant line broadening is detected within or near the remnant). It probably indicates that the SNR is evolving in the molecular cavity, which is in agreement with the low density there and the surrounding molecular shell structures. Further observations and analysis of the remnant are required to draw any firm conclusions.
3.3 SNR G213.00.6
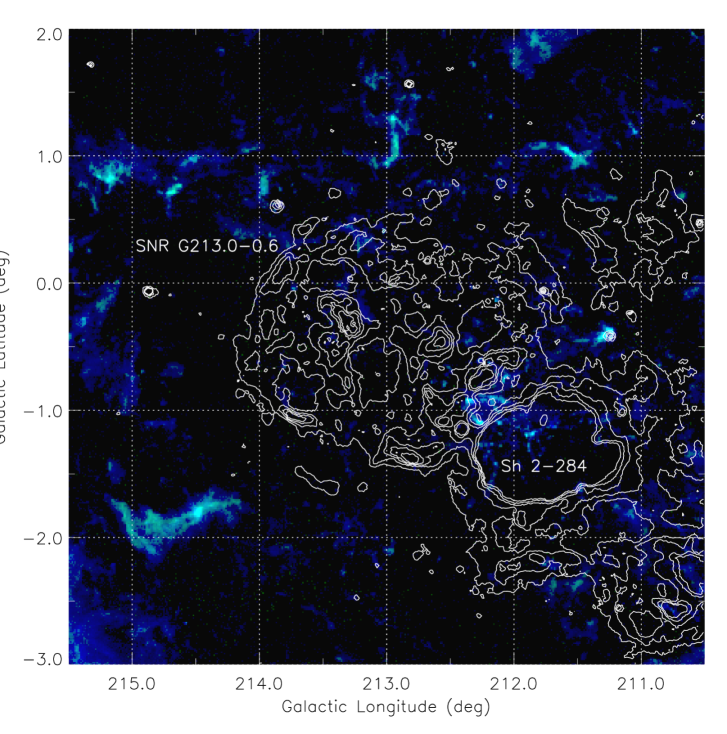
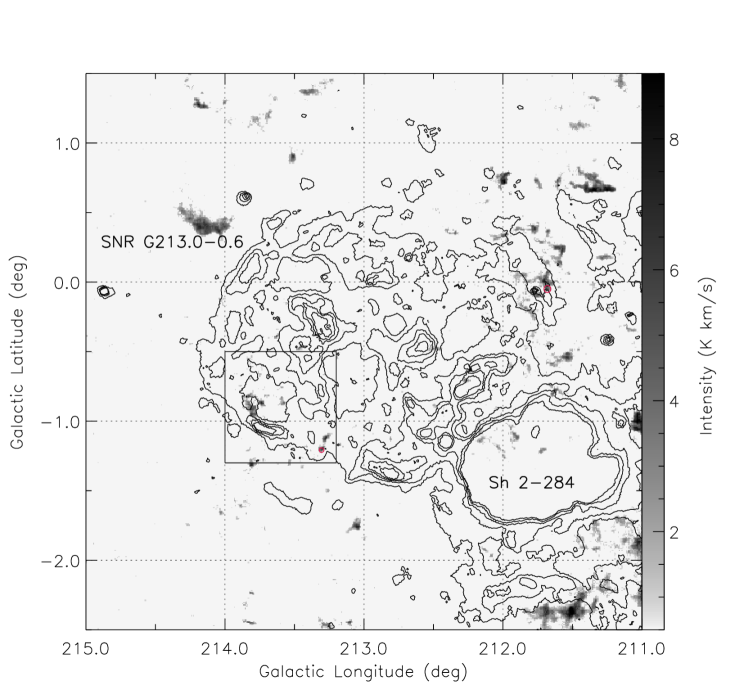
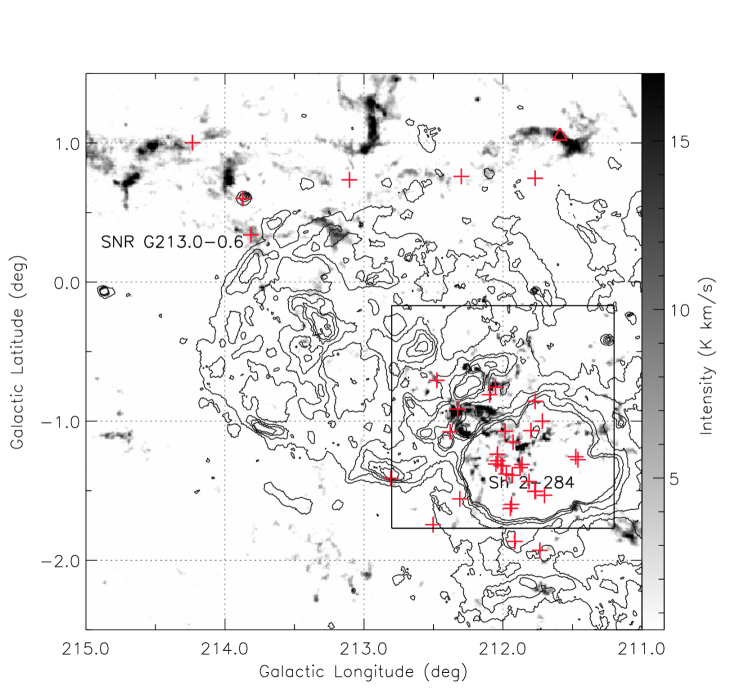
Using the 863 MHz data and the 2.695 GHz data from the Effelsberg survey, Reich et al. (2003) firstly identified G213.00.6 as an old SNR with . The remnant displays partial shell-like structures on a large scale and it has low radio surface brightness. On the other hand, a large complex of H ii region Sh 2-284, which has bright optical, infrared, and radio emission, is located to the southwestern boundary of the remnant. The remnant was also named as G213.30.4 according to the new optical H imaging and relatively high-resolution radio observations from the PMN survey at 4.85 GHz and NRAO/VLA Sky Survey (NVSS) at 1.4 GHz (Stupar & Parker, 2012). Following Green’s SNR catalog (Green, 2014), we use SNR G213.00.6 as its name throughout this paper. Generally speaking, the SNR is less studied because of its large angular size and low radio surface brightness.
Figure 14 shows the distribution of the molecular gas toward SNR G213.00.6. Given the very fragmented structures of the SNR in radio emission, optical contours from the Southern H Sky Survey (Parker et al., 2005) have been made to trace the SNR and the southwestern H ii region Sh 2-284. In the direction of SNR G213.00.6, molecular gas is mainly concentrated in the velocity range of 0–60. CO emission is very weak toward SNR G213.00.6, while the emission outside the remnant is relatively strong. This fact probably corresponds to the faint radio emission on a large scale because the density of the SNR’s environment is relatively low. In Figure 14, the southwestern molecular gas is obviously related to H ii region Sh 2-284. The relationship between the SNR and its southwestern extended source Sh 2-284 is also investigated.
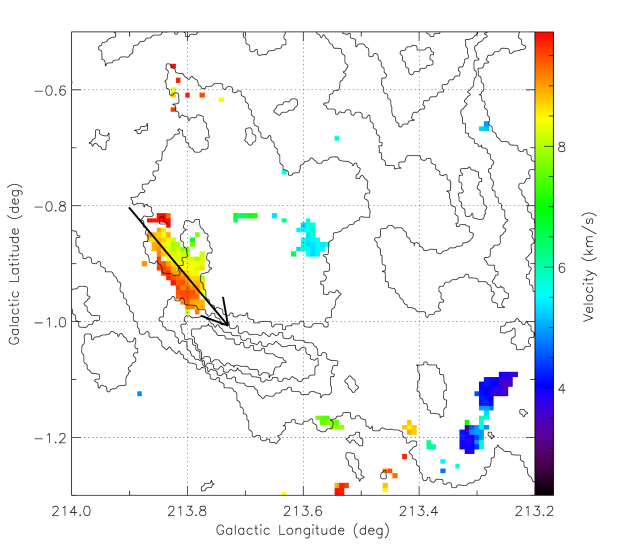
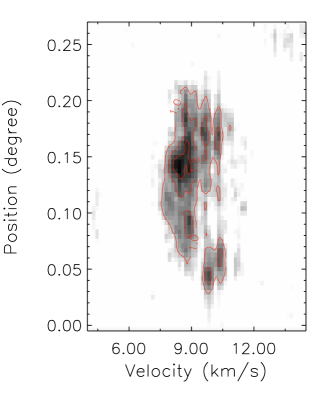
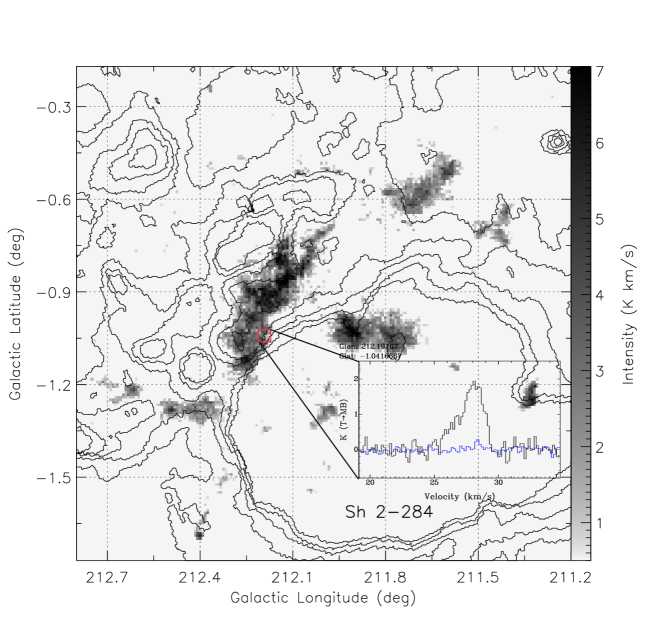
We find that molecular gas at systemic velocity of 8–11 seems to be located around the boundary of SNR G213.00.6, especially to the southeast and northwest (Figure 15). In projection, the H and radio emission is enhanced toward the southeastern boundary of the remnant (see the box region in Figure 15) coincident with an MC with a velocity interval of 6.5–12. The MC, which is found to be along the boundary of the remnant from the northeast to the southwest, displays a prominent velocity gradient (arcmin-1, or pc-1 at 1.0 kpc, see below) perpendicular to the main axis of the 12CO emission (see the arrow in Figure 16). The PV diagram of the molecular gas (Figure 17) reveals the detailed velocity structure along the MC, as well as an interesting arc structure seen in the map. We suggest that this feature is probably related to the remnant’s shock. Stupar & Parker (2012) found that the density in the region of the H peak is relatively high based on optical observations ( cm-3, refer to Table 2 in their paper). This result suggests that SNR G213.00.6 is interacting with a clumpy interstellar medium, which agrees with the CO emission near the H peak using our CO data (Figure 16). Assuming a constant value of = cm-2K-1km-1s (Bolatto et al., 2013), the MC’s thickness of 4′, and a distance of 1 kpc (see below), the density of the MC is about 300 cm-3, which is consistent with the result of the optical study (Stupar & Parker, 2012). The interesting MC, as well as its velocity structure, suggests that the molecular gas with LSR velocity 8–11 is probably interacting with SNR G213.00.6.
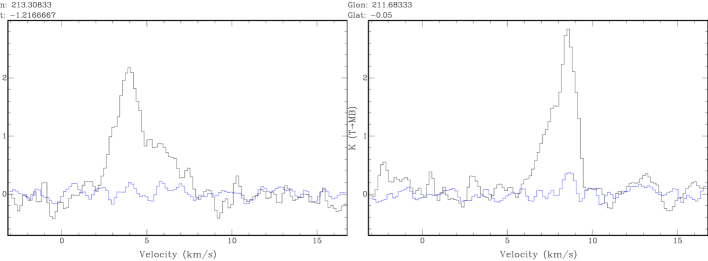
CO emission of this molecular component is also concentrated in the northwest of the remnant, in which the H and radio emission displays blow-out structure (see the northwestern region in Figure 15). An MC with line broadening (several , see the right panel of Figure 18) is revealed in the region (see the relatively large red circle in the northwest of Figure 15). The H emission, together with the PMN 4850 MHz radio emission, appears to be locally enhanced in such a region.
In combination with the morphological correspondence and the broadening of CO profiles, we suggest that molecular gas at 9 is physically associated with the remnant. Accordingly, the kinematic distance of the remnant is about 0.7–1.0 kpc (e.g., 8–11 from Figure 17) based on the A5 rotation curve model of Reid et al. (2014). The estimated kinematic distance of the remnant is consistent well with that of the empirical radio surface-brightness-to-diameter (–) relation. Using the updated – relation for SNRs and the probability-density-function-based method (Pavlovic et al., 2014), the distance of the SNR is estimated to be 1.0 kpc. We also estimate that the 8–11 molecular gas (e.g., at position (213798, 0949), see Figure 16 ) is at DM10 (or 1.0 kpc) according to the 3D extinction map (Green et al., 2015). The estimated distance is in good agreement with the result from the above – and kinematic methods. We thus adopt 1 kpc as the distance to SNR G213.00.6.
The angular size (34 23, accounting for the blow-out structure in the northwestern region) of the remnant corresponds to a physical size of 59 pc 40 pc at about 1 kpc distance. The large physical size, the low radio surface brightness, and the relatively high density near the boundary of the remnant indicates that SNR G213.00.6 probably exploded in a low-density cavity and now is interacting with the surrounding clumpy interstellar medium. Assuming the mean density of 0.1 cm and the SNR’s explosion energy of erg , the remnant’s equivalent radius of 24.3 pc yields a shock velocity of about 590. The age of the remnant in the radiative phase is thus about 1.1 years.
On the other hand, MCs at =42–48 (in the velocity interval of 35–54, see Figure 19) are probably from the Milky Way’s Perseus arm and/or the Norma (Outer) arm at a kinematic distance of 4.5–5.5 kpc (e.g., refer to the rotation model of Reid et al., 2014). These MCs are clearly associated with H ii region Sh 2-284 and a group of early-type OB stars (see the region of Sh 2-284 in this figure). We also find that molecular gas at =28 (in the velocity interval of 24–33, see Figure 20) seems to be located between the southwestern boundary of SNR G213.00.6 and H ii region Sh 2-284. The 28 MC component is probably also related to the H ii region Sh 2-284 because the blueshifted CO gas with respect to the 42–48 molecular component has corresponding dark patches against the bright optical emission. The molecular gas presents blueshifted wing profiles on the side of the cloud facing H ii region Sh 2-284 (e.g., see the red box and its spectra in Figure 20). Accounting for the low metallicity in the H ii region, the distance of Sh 2-284 is estimated to be about 4 kpc (Delgado et al., 2010; Cusano et al., 2011) or 4.5 kpc (Negueruela et al., 2015), which is in good agreement with the kinematic distance from our CO observations (e.g., the MCs with 42–48 physically associated with the H ii region Sh 2-284). However, we do not find any convincing evidence of SNR–MC interaction for such molecular components.
Finally, many MCs outside the SNR can be seen in the north of Figure 19, in which several early-type OB stars seem to be related to these MCs. For example, B0 star HD 289291 (211768,0747, the upper-right cross in Figure 19) is very likely responsible for its northern MC shell at 45 (see the upper-right corner in Figure 19). It is interesting to note that a maser source G211.5901.05 at (see red triangle in Figure 19) is exactly located in the MC shell. The parallax distance of the maser is about 4.4 kpc (0.2280.007 mas in Table 1 of Reid et al., 2014). Due to the close correspondence between the molecular gas and the maser source, we suggest that the northern and southwestern MCs in the interval of 42–48 (and their associated OB stars, see red crosses in Figure 19) are at the same distance of 4–5 kpc. Accordingly, SNR G213.00.6 has no connection to H ii region Sh 2-284 (and the 28 MCs) because of their different distances.
4 SUMMARY
A large-scale CO survey has been performed with high spatial () and velocity () resolution to study the molecular environment of SNRs G205.50.5, G206.92.3, and G213.00.6. The high-quality CO data reveal complex structures in the molecular gas toward the three remnants. The resulting CO maps also allow us to investigate in detail the relationship between the SNRs and the molecular gas. We summarize our main results as follows.
1. SNR G205.50.5 is actually associated with the MCs at 5 and 19. The 5 molecular gas, which exhibits the blueshifted CO broadening, is identified to be connected with obscuring optical regions. Whereas the 19 MCs with redshifted line-broadening are on the farside of the remnant. On the other hand, the nearby Rosette Nebula is also physically related to these two MC components, suggesting the association between the Nebula and the SNR. Using the 3D extinction map from Green et al. (2015), the distances of the two molecular components are estimated to be 1.6 kpc for the 5 MCs and 1.6–2.0 kpc for the 19 MCs, which agree well with the distance of 1.6 kpc from the connection between the SNR and the Rosette Nebula. The confirmation of SNR–MC interaction toward SNR G205.5+0.5 supports the hadronic origin of the extended gamma-ray emission inside the remnant.
2. SNR G213.00.6 is interacting with the 8–11 MCs. Based on the 3D extinction map from Green et al. (2015), the SNR’s distance is 1 kpc from that of the associated molecular gas, which is consistent well with the estimates from the updated – relationship (Pavlovic et al., 2014) and the kinematic distance inferred from the LSR velocity of 8–11. The remnant has no relation to the southwestern H ii region Sh 2-284, which is located at a distance of 4–5 kpc.
3. For SNR G206.92.3, we notice that this remnant seems to be located in a molecular cavity at 15. Moreover, a partial shell structure at 14–15 is found to be expanding outward at the southeastern boundary of the remnant. While this evidence may indicate an association between the SNR and the molecular gas, no significant molecular line broadening has been obtained. If the SNR–MC association is true, the kinematic distance to SNR G206.92.3 is 1.6 kpc.
4. SNRs G205.50.5 and G213.00.6 evolved in the low-density environment and are now interacting with their ambient molecular gas. However, SNR G206.92.3 seems to be still evolving in the molecular cavity. The SNRs’ low-density environment may be created by their progenitors’ activities. These SNRs are a good laboratory for establishing the relationships between SNRs and their environments because of their large angular sizes, relatively near distances, and likely SNR–MC interaction. Detailed analyses and discussions will be valuable for understanding the remnant’s evolution and the interaction of SNRs with their surroundings through further multiwavelength studies.
References
- Aharonian et al. (2007) Aharonian, F. A., Akhperjanian, A. G., Bazer-Bachi, A. R., et al. 2007, A&A, 469, L1
- Ambrocio-Cruz et al. (2014) Ambrocio-Cruz, P., Rosado, M., Le Coarer, E., Bernal, A., & Gutiérrez, L. 2014, Rev. Mexicana Astron. Astrofis., 50, 323
- Anderl et al. (2014) Anderl, S., Gusdorf, A., & Güsten, R. 2014, A&A, 569, A81
- Baxter et al. (2009) Baxter, E. J., Covey, K. R., Muench, A. A., et al. 2009, AJ, 138, 963
- Bolatto et al. (2013) Bolatto, A. D., Wolfire, M., & Leroy, A. K. 2013, ARA&A, 51, 207
- Casandjian & Grenier (2008) Casandjian, J.-M., & Grenier, I. A. 2008, A&A, 489, 849
- Chen et al. (2016) Chen, X., Xiong, F., & Yang, J. 2016, arXiv160805329C, arXiv:1608.05329
- Chen et al. (2014) Chen, Y., Jiang, B., Zhou, P., et al. 2014, in IAU Symposium, Vol. 296, Supernova Environmental Impacts, ed. A. Ray & R. A. McCray, 170–177
- Chevalier (1974) Chevalier, R. A. 1974, ApJ, 188, 501
- Condon et al. (1993) Condon, J. J., Griffith, M. R., & Wright, A. E. 1993, AJ, 106, 1095
- Cusano et al. (2011) Cusano, F., Ripepi, V., Alcalá, J. M., et al. 2011, MNRAS, 410, 227
- Davies et al. (1978) Davies, R. D., Elliott, K. H., Goudis, C., Meaburn, J., & Tebbutt, N. J. 1978, A&AS, 31, 271
- Delgado et al. (2010) Delgado, A. J., Djupvik, A. A., & Alfaro, E. J. 2010, A&A, 509, A104
- Dent et al. (2009) Dent, W. R. F., Hovey, G. J., Dewdney, P. E., et al. 2009, MNRAS, 395, 1805
- Dickel & Denoyer (1975) Dickel, J. R., & Denoyer, L. K. 1975, AJ, 80, 437
- Dirks & Meyer (2016) Dirks, C., & Meyer, D. M. 2016, ApJ, 819, 45
- Dubner & Giacani (2015) Dubner, G., & Giacani, E. 2015, A&A Rev., 23, 3
- Fesen et al. (1985) Fesen, R. A., Blair, W. P., & Kirshner, R. P. 1985, ApJ, 292, 29
- Fujita et al. (2009) Fujita, Y., Ohira, Y., Tanaka, S. J., & Takahara, F. 2009, ApJ, 707, L179
- Furst et al. (1990) Furst, E., Reich, W., Reich, P., & Reif, K. 1990, A&AS, 85, 691
- Gao et al. (2011) Gao, X. Y., Han, J. L., Reich, W., et al. 2011, A&A, 529, A159
- Graham et al. (1982) Graham, D. A., Haslam, C. G. T., Salter, C. J., & Wilson, W. E. 1982, A&A, 109, 145
- Green (2014) Green, D. A. 2014, Bulletin of the Astronomical Society of India, 42, 47
- Green et al. (2015) Green, G. M., Schlafly, E. F., Finkbeiner, D. P., et al. 2015, ApJ, 810, 25
- Hartman et al. (1999) Hartman, R. C., Bertsch, D. L., Bloom, S. D., et al. 1999, ApJS, 123, 79
- Hensberge et al. (2000) Hensberge, H., Pavlovski, K., & Verschueren, W. 2000, A&A, 358, 553
- Huang & Thaddeus (1986) Huang, Y.-L., & Thaddeus, P. 1986, ApJ, 309, 804
- Jeong et al. (2012) Jeong, I.-G., Byun, D.-Y., Koo, B.-C., et al. 2012, Ap&SS, 342, 389
- Jiang et al. (2010) Jiang, B., Chen, Y., Wang, J., et al. 2010, ApJ, 712, 1147
- Kamezaki et al. (2014) Kamezaki, T., Imura, K., Omodaka, T., et al. 2014, ApJS, 211, 18
- Katagiri et al. (2016) Katagiri, H., Sugiyama, S., Ackermann, M., et al. 2016, ApJ, 831, 106
- Kilpatrick et al. (2014) Kilpatrick, C. D., Bieging, J. H., & Rieke, G. H. 2014, ApJ, 796, 144
- Kilpatrick et al. (2016) —. 2016, ApJ, 816, 1
- Lasker et al. (1990) Lasker, B. M., Sturch, C. R., McLean, B. J., et al. 1990, AJ, 99, 2019
- Leahy (1986) Leahy, D. A. 1986, A&A, 156, 191
- Leahy et al. (1985) Leahy, D. A., Naranan, S., & Singh, K. P. 1985, MNRAS, 213, 15P
- Leahy et al. (1986) —. 1986, MNRAS, 220, 501
- McKee & Cowie (1975) McKee, C. F., & Cowie, L. L. 1975, ApJ, 195, 715
- Negueruela et al. (2015) Negueruela, I., Simón-Díaz, S., Lorenzo, J., Castro, N., & Herrero, A. 2015, A&A, 584, A77
- Nolan et al. (2012) Nolan, P. L., Abdo, A. A., Ackermann, M., et al. 2012, ApJS, 199, 31
- Odegard (1986) Odegard, N. 1986, ApJ, 301, 813
- Oliver et al. (1996) Oliver, R. J., Masheder, M. R. W., & Thaddeus, P. 1996, A&A, 315, 578
- Park & Sung (2002) Park, B.-G., & Sung, H. 2002, AJ, 123, 892
- Parker et al. (2005) Parker, Q. A., Phillipps, S., Pierce, M. J., et al. 2005, MNRAS, 362, 689
- Paron et al. (2015) Paron, S., Celis Peña, M., Ortega, M. E., et al. 2015, A&A, 580, A51
- Pavlovic et al. (2014) Pavlovic, M. Z., Dobardzic, A., Vukotic, B., & Urosevic, D. 2014, Serbian Astronomical Journal, 189, 25
- Reich et al. (1997) Reich, P., Reich, W., & Furst, E. 1997, A&AS, 126, doi:10.1051/aas:1997274
- Reich et al. (2003) Reich, W., Zhang, X., & Fürst, E. 2003, A&A, 408, 961
- Reid et al. (2014) Reid, M. J., Menten, K. M., Brunthaler, A., et al. 2014, ApJ, 783, 130
- Rho et al. (2017) Rho, J., Hewitt, J. W., Bieging, J., et al. 2017, ApJ, 834, 12
- Sano et al. (2016) Sano, H., Nakamura, K., Furukawa, N., et al. 2016, arXiv160607745S, arXiv:1606.07745
- Schneider et al. (1998) Schneider, N., Stutzki, J., Winnewisser, G., & Block, D. 1998, A&A, 335, 1049
- Shan et al. (2012) Shan, W. L., Yang, J., Shi, S. C., et al. 2012, IEEE Transactions on Terahertz Science and Technology, 2, 593
- Slane et al. (2015) Slane, P., Bykov, A., Ellison, D. C., Dubner, G., & Castro, D. 2015, Space Sci. Rev., 188, 187
- Stupar & Parker (2012) Stupar, M., & Parker, Q. A. 2012, MNRAS, 419, 1413
- Su et al. (2014a) Su, Y., Fang, M., Yang, J., Zhou, P., & Chen, Y. 2014a, ApJ, 788, 122
- Su et al. (2014b) Su, Y., Yang, J., Zhou, X., Zhou, P., & Chen, Y. 2014b, ApJ, 796, 122
- Sung et al. (1997) Sung, H., Bessell, M. S., & Lee, S.-W. 1997, AJ, 114, 2644
- Wallerstein & Jacobsen (1976) Wallerstein, G., & Jacobsen, T. S. 1976, ApJ, 207, 53
- Welsh et al. (2001) Welsh, B. Y., Sfeir, D. M., Sallmen, S., & Lallement, R. 2001, A&A, 372, 516
- Xiao & Zhu (2012) Xiao, L., & Zhu, M. 2012, A&A, 545, A86
- Yamazaki et al. (2006) Yamazaki, R., Kohri, K., Bamba, A., et al. 2006, MNRAS, 371, 1975
- Zhou et al. (2016a) Zhou, P., Chen, Y., Zhang, Z.-Y., et al. 2016a, ApJ, 826, 34
- Zhou et al. (2014) Zhou, X., Yang, J., Fang, M., & Su, Y. 2014, ApJ, 791, 109
- Zhou et al. (2016b) Zhou, X., Yang, J., Fang, M., et al. 2016b, ApJ, 833, 4