Search for Interstellar LiH in the Milky Way
Abstract
We report the results of a sensitive search for the 443.952902 GHz transition of the LiH molecule toward two interstellar clouds in the Milky Way, W49N and Sgr B2 (Main), that has been carried out using the Atacama Pathfinder Experiment (APEX) telescope. The results obtained toward W49N place an upper limit of on the LiH abundance, , in a foreground, diffuse molecular cloud along the sight-line to W49N, corresponding to 0.5% of the solar system lithium abundance. Those obtained toward Sgr B2 (Main) place an abundance limit in the dense gas within the Sgr B2 cloud itself. These limits are considerably smaller that those implied by the tentative detection of LiH reported previously for the absorber toward B0218+357.
1 Introduction
Along with molecular hydrogen and its ions (H and H) and isotopologues (e.g. HD), and together with HeH+, lithium hydride is one of a very few molecules that can be formed from the primordial elements (H, D, He and Li) produced by big-bang nucleosynthesis. LiH has been considered as a possible coolant of primordial material, although theoretical analyses are unanimous in concluding that the abundance of LiH in the early Universe is far too small for LiH to have played any significant role in the cooling of the gas (e.g, Bougleux & Galli, 1997; Bovino et al., 2011).
For the present Universe, containing the heavy elements that have been provided by stellar nucleosynthesis, the chemistry of LiH was first considered by Kirby & Dalgarno (1978), who identified two possible production mechanisms for LiH (and the related hydride NaH): (1) a gas-phase pathway, initiated by the slow radiative association of Li+ and H2 to form LiH and then followed by the dissociative recombination of LiH to form LiH; and (2) a grain-surface pathway, in which Li+ ions are neutralized on grain surfaces and undergo reactions with hydrogen atoms on grain surfaces to form LiH. LiH is photodissociated efficiently by the ultraviolet interstellar radiation field (ISRF). In the case of diffuse interstellar clouds, the LiH column densities predicted by Kirby & Dalgarno (1978) were only , far below the detection threshold for any conceivable spectroscopic measurement unless some significant production mechanism has been overlooked. Larger abundances are possible in well-shielded dense clouds, particularly if the grain-surface production route is efficient. In the case of NaH, however, Plambeck & Erickson (1982) have obtained observational upper limits on the abundance toward several dense clouds including Sgr B2; in some sources, upper limits as small as were obtained for the abundance of NaH relative to H2, corresponding to only 10-5 times the solar abundance of Na. These limits led Plambeck & Erickson (1982) to argue against grain-surface reactions being an efficient source of NaH in dense clouds. If the same is true of LiH, then the prospects for a detection in dense clouds is extremely dim, the cosmic elemental abundance of Li being three orders of magnitude below that of Na.
Notwithstanding these pessimistic theoretical expectations, two tentative () detections of LiH have been reported in the absorber in front of the BL Lac object B0218+357. The first of these was obtained by Combes & Wiklind (1998), who used the IRAM 30 m telescope to observe the transition of LiH at a redshifted frequency of 263.527 GHz, and the second by Friedel et al. (2011), who used the CARMA array to observe the same transition toward the same source. The best-estimate LiH column densities obtained in these studies were and respectively. If these tentative detections of LiH were confirmed, either in the absorber or in the Milky Way, LiH would join a relatively small list of diatomic hydrides detected in the interstellar medium. These hydrides, comprising CH, CH+, OH, OH+, HF, SH, SH+, HCl, HCl+, and ArH+, have proven invaluable diagnostic probes of the physical and chemical conditions in the interstellar gas (Gerin et al. 2016, and references therein).
Motivated by these possible extragalactic detections of LiH, we have performed a deep search for LiH in the Milky Way galaxy. In the local Universe (i.e. at ) such a search requires excellent atmospheric conditions, because the LiH transition – at a frequency of 443.952902 GHz (Matsushima et al., 1994) – lies in the wing of a deep and highly pressure-broadened terrestrial water line (the transition at 448.001 GHz). In this paper, we present upper limits on the LiH abundance thereby obtained toward two bright submillimeter continuum sources: Sgr B2(Main), and W49N. Sgr B2(M) is an extremely massive and luminous molecular cloud located at a projected distance of pc on the Galactic Center, with a total mass of and a total bolometric luminosity of (Schmiedeke et al., 2016). The W49N molecular cloud, located in the Perseus arm at a distance of kpc from the Sun (Zhang et al., 2013), is a factor of 10 even more massive than Sgr B2(M)(Galván-Madrid et al., 2013). Both sources exhibit a rich spectrum of molecular features at the systemic velocity of the background source, in addition to multiple absorption features associated with unrelated foreground material along the sight-line. For the purposes of the present study, a search the LiH transition in the Sgr B2(M) source provides the greatest sensitivity to LiH in dense molecular material in the Milky Way, while a search for foreground absorption in a translucent molecular cloud along the sight-line to W49N affords the best sensitivity in diffuse molecular gas.
2 Observations and data reduction
The LiH observations were carried out using the FLASH+ receiver (Klein et al., 2014) and the extended bandwidth Fast Fourier Transform Spectrometer (XFFTS) backend (Klein et al., 2012) on the 12 m APEX telescope 111This publication is based in part on data acquired with the Atacama Pathfinder Experiment (APEX). APEX is a collaboration between the Max-Planck-Institut für Radioastronomie, the European Southern Observatory, and the Onsala Space Observatory.(Güsten et al., 2006) on several nights in September 2014 under exceptionally good weather conditions. This instrumentation yields a nominal beam size of (FWHM) and a spectral channel width of 0.076 MHz, corresponding to 0.052 km s-1. Position switching observations with a clean reference position were used to achieve the observed signal to noise ratio. For both sets of observations, the focus was checked at the beginning of each observation; pointing was checked every hour and found to be better than 2″. The data from APEX were calibrated in units of using the standard APEX calibration tools, and smoothed to a channel width of 0.52 km s-1 with the use of a boxcar filter.
3 Results
In Figures 1 and 2, we present the spectra obtained toward W49N and Sgr B2 (Main). The spectra shown in the top panels have been divided by a linear fit to the continuum spectrum, and are presented on the scale of Doppler velocity relative to the Local Standard Rest (LSR) for an assumed LiH rest frequency of 443.952902 GHz (Matsushima et al., 1994). A set of emission lines, observed toward both sources, can be identified as a series of rotational transitions of , all with . Blue vertical lines, labeled with the upper rotational quantum number , indicate positions of these emission lines for assumed centroid velocities of +10 (W49N) and (Sgr B2 Main) relative to the LSR. The stronger emission features appearing near +120 (W49N) and (Sgr B2 Main) are the 443.79176 GHz transition of (the dominant isotopologue) A series of emission lines of ketene (), marked by red vertical lines, is also evident in the spectra.
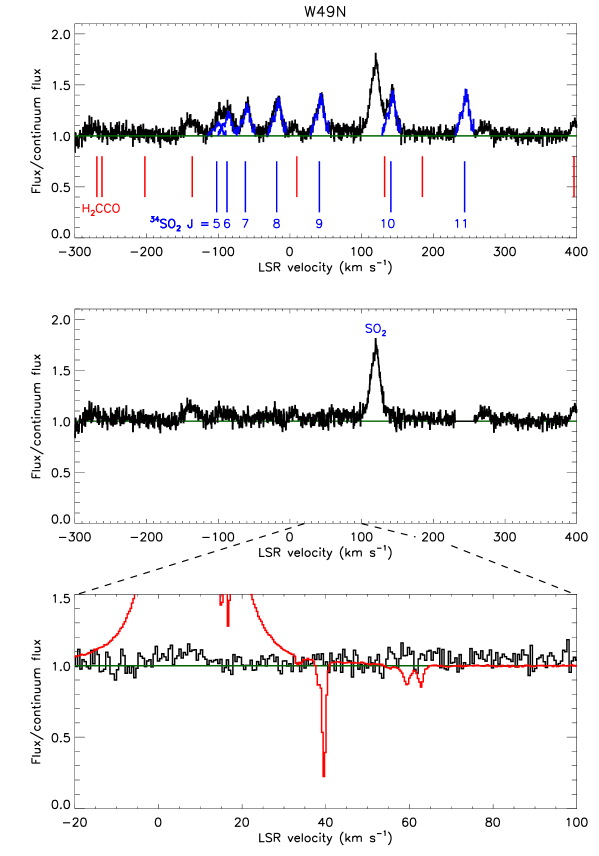
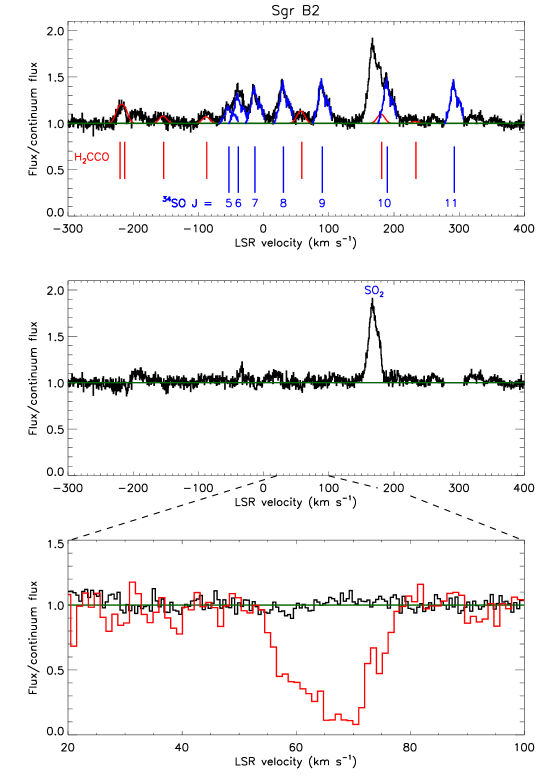
We have removed the emission lines appearing in the upper panel of Figures 1 and 2 – together with additional weak emission lines in the case of Sgr B2 (M) – to obtain the spectra shown in the middle panel. For the lines, we adopted the transition as a template, and assumed that a single rotational temperature could account for the line ratios. An excellent fit (blue curves in the top panel) was obtained for an assumed rotational temperature of 100 K for W49N and 60 K for Sgr B2. In the case of Sgr B2 (M), an extensive line survey has been conducted at millimeter wavelengths by Belloche et al. (2013), who derived estimates of the source size, column density and rotational temperature for 46 molecules and 54 minor isotopologues thereof. Based upon these estimates, we have used the XCLASS software (Möller et al., 2017) to compute a predicted spectrum for the weak ketene lines in the spectral region targeted in the present study, together with one weak line of that also lies in the bandpass. This predicted spectrum is shown by the red curve in the top panel of Figure 2, and was subtracted along with the rotational transitions of to obtain the middle panel in that figure.
The bottom panels in Figures 1 and 2 show zoomed versions of the spectra after subtraction of the emission lines (and, in the case of Sgr B2 (M), of the predicted ketene and spectrum.) For comparison, in Figure 1, the red histogram in the bottom panel shows the H2S spectrum obtained by Neufeld et al. (2015) for W49N. As is observed for many molecules (e.g., Neufeld et al., 2015), an absorbing cloud at gives rise to a strong absorption line in the H2S spectrum. The LiH spectrum, by contrast, shows no hint of any absorption feature at . There appears to be a weak emission feature, perhaps of marginal significance, close to the systemic velocity of source. Even if real, this could not be identified with LiH , because ground-state rotational lines observed at submillimeter wavelengths in this and other similar sources are expected and indeed observed to appear in absorption. A blend of the and lines of ketene is a plausible identification.
4 Discussion
4.1 Upper limit on LiH for a diffuse molecular cloud, derived from observations of W49N
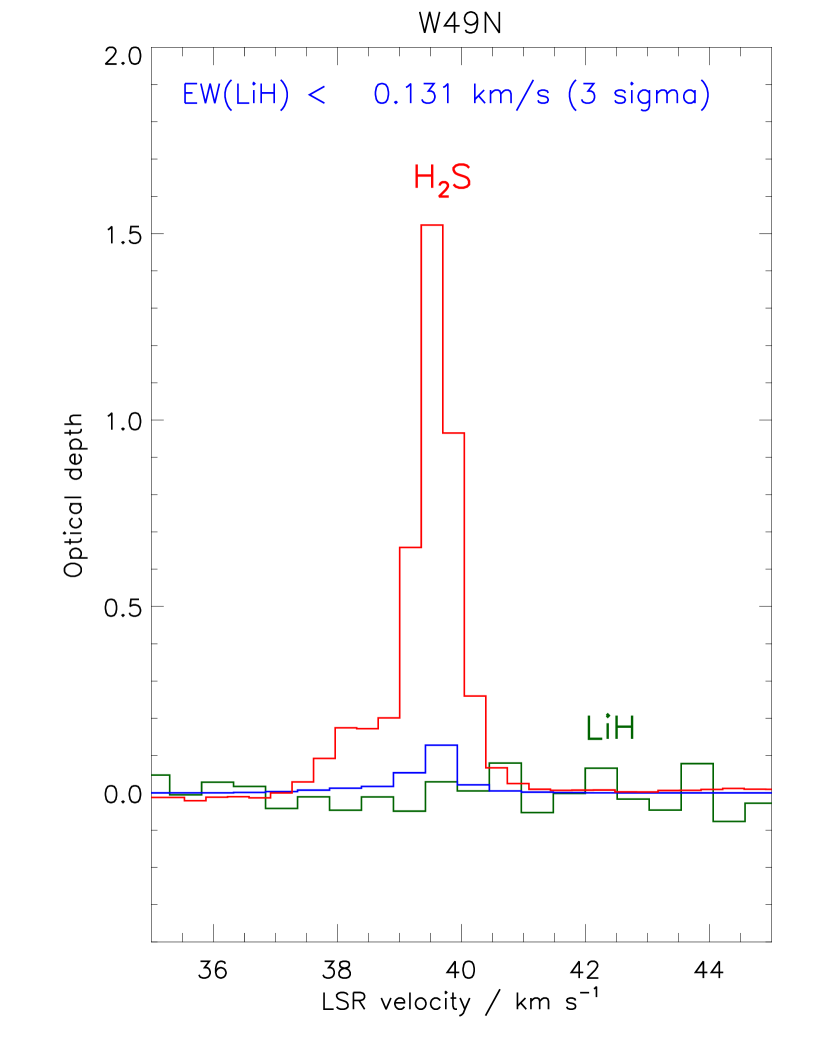
For the W49N spectrum, we have obtained an upper limit on the LiH column density in the absorbing cloud by using the H2S line profile as a template. In Figure 3, we show the line optical depths for H2S (red) and LiH (green), as a function of . The spectra have been regridded onto a common velocity grid. Assuming a LiH line profile identical to that of H2S, we used a analysis to place a upper limit on the LiH optical depth (blue). To determine that limit, we considered the mean square deviations between the observed data and a scaled version of the H2S spectrum, and adjusted the scaling factor so as to increase the value of by 9. The resultant upper limit on the integrated optical depth of the LiH line is At the low densities and radiation fields typical of diffuse molecular clouds, most LiH molecules will be in the ground rotational state, and the rotational temperature will lie close to the temperature of the cosmic microwave background. Adopting a dipole moment for LiH of 5.88 Debye (Buldakov et al., 2004), which leads to a large spontaneous decay rate of , and assuming an excitation temperature of 2.73 K, we obtain the following upper limit on the LiH column density:
The H2 column density in this cloud has been estimated as so our upper limit on corresponds to a LiH abundance of relative to H2. By comparison, the elemental abundance of lithium nuclei in the solar system is relative to H nuclei (Asplund et al., 2009), so our upper limit on is equivalent to 0.5 of the solar system lithium abundance.
This limit is perhaps unsurprising, since most hydrides – defined here as molecules containing one heavy element atom and one or more hydrogen atoms – are only minor reservoirs of heavy elements in diffuse molecular clouds (Gerin et al., 2016). For most elements, including O, C, S, and N, hydrides typically account for no more than 0.1 of the gas-phase abundance. The notable exceptions are HF, which typically accounts for of the gas-phase fluorine abundance in diffuse molecular clouds, and HCl, HCl+ and H2Cl+, which account for up to of the gas-phase chlorine (Gerin et al., 2016). These exceptions are readily understood by considerations of thermochemistry, in that F and Cl are the only elements that react exothermically with H2 in their dominant ionization stage in diffuse clouds (F and Cl+), thereby forming HF and HCl+ rapidly at low temperature. In the case of LiH, by contrast, no similarly rapid formation process has been proposed. As discussed previously, the formation of LiH is expected to be slow, proceeding by via grain surface reactions or in a gas-phase chemical sequence initiated by the slow radiative association of Li+ and H2.

4.2 Upper limit on LiH for a dense molecular cloud, derived from observations of Sgr B2
From the Sgr B2 (Main) spectrum, we may obtain a lower limit on the LiH abundance in the background source itself. In this case, the gas densities are much higher than in the diffuse ISM, and collisional excitation cannot be neglected. Moreover, a strong far-infrared radiation field can lead to significant radiative pumping. A model for the excitation of LiH and the radiative transfer of its line radiation is therefore needed.
Here, we employed the Python tool “Pandora”, developed by Schmiedeke (2016), to make coordinated use of the RADMC-3D (Dullemond, 2012) and LIME (Brinch & Hogerheijde, 2010) radiative transfer codes. Given an assumed density profile and a distribution of heating sources, RADMC-3D provides the temperature profiles that LIME uses as input for the line radiative transfer calculations. Our density and temperature profiles for the Sgr B2 cloud correspond to Model C of Schmiedeke et al. (2016), which provides a good fit to the observed infrared continuum radiation. Excitation calculations were performed for the lowest 11 rotational states of LiH, with the use of spontaneous radiative rates from Plummer et al. (1984). Calculated rate coefficients are not available for collisional de-excitation of LiH, so we adopted rate coefficients for the de-excitation of HCl by H2 (Lanza & Lique, 2014) and computed the excitation rates using the principle of detailed balance. In the optically-thin regime of present interest, the line was predicted to be entirely in absorption, with a predicted equivalent width that was found to be proportional to the adopted abundance. We assumed a constant gas-phase abundance for LiH along the line-of-sight, thus neglecting fluctuations linked to freeze-out onto or evaporation from dust grains. A detailed description of the parameters adopted for the spectral line modeling of Sgr B2 with “Pandora” can be found in Schmiedeke (2016) and in Comito et al. (in preparation.)
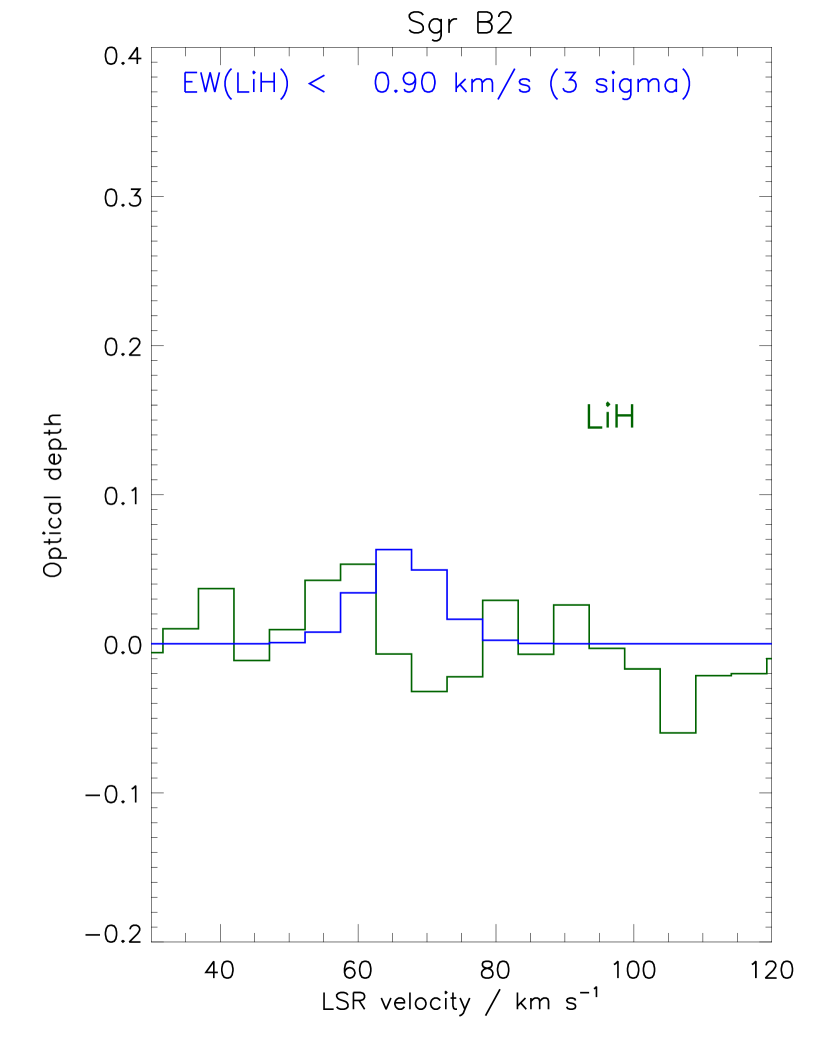
We computed the expected line strengths and profiles as a function of the abundance ratio. In Figure 4, we show a set of predicted line profiles for several values of , ranging from to (the maximum value corresponding to the solar system lithium abundance), in steps of a factor 2. We then used a analysis to determine the largest abundance consistent with the data, and thereby obtained an upper limit . In Figure 5, we show the observed spectrum (green), and the expected line profiles for the upper limit given above (blue).
Our upper limit on the LiH abundance along the sight-line to Sgr B2 (Main) corresponds to a fraction of the solar system lithium abundance. This fraction is similar to the fraction of the solar sodium abundance corresponding to the typical NaH limits obtained by Plambeck & Erickson (1982). Thus, our upper limit on LiH suggests that Plambeck & Erickson’s conclusion that NaH cannot be efficiently be formed on grain surface applies also to LiH. It also places constraints on any rapid gas-phase production route that may have been overlooked in previous theoretical studies.
4.3 Comparison with the tentative detection reported toward B0218+357
Based upon their tentative detection of LiH toward B0218+357 with Friedel et al. (2011) inferred a abundance ratio in the range to The large uncertainty in the derived abundance reflects uncertainties in the column density of molecular hydrogen, for which previous literature estimates ranged from to (Menten & Reid, 1996; Combes & Wiklind, 1995). At the bottom of that range, the absorbing cloud is most nearly similar to the diffuse molecular cloud in front of W49N, but the inferred abundance for B0218+357 is 15 times our 3 upper limit. At the top of that range, the comparison with Sgr B2 is most appropriate. Here, our 3 sigma upper limit lies a factor of below the inferred abundance for B0218+357. In either case, the upper limits derived in the present study suggest that the chemical conditions in the Milky Way are significantly different from – and less favorable for LiH formation than – those in the B0218+357 absorber, or else that the previously-reported tentative detections toward the latter source are in fact spurious. Deeper integrations toward B0218+357 would be desirable to resolve the question of whether the previous detections are real.
References
- Asplund et al. (2009) Asplund, M., Grevesse, N., Sauval, A. J., & Scott, P. 2009, ARA&A, 47, 481
- Belloche et al. (2013) Belloche, A., Müller, H. S. P., Menten, K. M., Schilke, P., & Comito, C. 2013, A&A, 559, A47
- Bougleux & Galli (1997) Bougleux, E., & Galli, D. 1997, MNRAS, 288, 638
- Bovino et al. (2011) Bovino, S., Tacconi, M., Gianturco, F. A., Galli, D., & Palla, F. 2011, ApJ, 731, 107
- Brinch & Hogerheijde (2010) Brinch, C., & Hogerheijde, M. R. 2010, A&A, 523, A25
- Buldakov et al. (2004) Buldakov, M. A., Cherepanov, V. N., & Kalugina, Y. N. 2004, in Proc. SPIE, Vol. 5743, Eleventh International Symposium on Atmospheric and Ocean Optics/Atmospheric Physics, ed. G. G. Matvienko & V. P. Lukin, 16–19
- Combes & Wiklind (1995) Combes, F., & Wiklind, T. 1995, A&A, 303, L61
- Combes & Wiklind (1998) —. 1998, A&A, 334, L81
- Dullemond (2012) Dullemond, C. P. 2012, Astrophysics Source Code Library, ascl:1202.015
- Friedel et al. (2011) Friedel, D. N., Kemball, A., & Fields, B. D. 2011, ApJ, 738, 37
- Galván-Madrid et al. (2013) Galván-Madrid, R., Liu, H. B., Zhang, Z.-Y., et al. 2013, ApJ, 779, 121
- Gerin et al. (2016) Gerin, M., Neufeld, D. A., & Goicoechea, J. R. 2016, ARA&A, 54, 181
- Güsten et al. (2006) Güsten, R., Nyman, L. Å., Schilke, P., et al. 2006, A&A, 454, L13
- Kirby & Dalgarno (1978) Kirby, K., & Dalgarno, A. 1978, ApJ, 224, 444
- Klein et al. (2012) Klein, B., Hochgürtel, S., Krämer, I., et al. 2012, A&A, 542, L3
- Klein et al. (2014) Klein, T., Ciechanowicz, M., Leinz, C., et al. 2014, Terahertz Science and Technology, IEEE Transactions on, 4, 588
- Lanza & Lique (2014) Lanza, M., & Lique, F. 2014, J. Chem. Phys., 141, 164321
- Matsushima et al. (1994) Matsushima, F., Odashima, H., Wang, D., Tsunekawa, S., & Takagi, K. 1994, Japanese Journal of Applied Physics, 33, 315
- Menten & Reid (1996) Menten, K. M., & Reid, M. J. 1996, ApJ, 465, L99
- Möller et al. (2017) Möller, T., Endres, C., & Schilke, P. 2017, A&A, arXiv:1508.04114
- Neufeld et al. (2015) Neufeld, D. A., Godard, B., Gerin, M., et al. 2015, A&A, 577, A49
- Plambeck & Erickson (1982) Plambeck, R. L., & Erickson, N. R. 1982, ApJ, 262, 606
- Plummer et al. (1984) Plummer, G. M., Herbst, E., & De Lucia, F. C. 1984, J. Chem. Phys., 81, 4893
- Schmiedeke (2016) Schmiedeke, A. 2016, PhD thesis, Universität zu Köln
- Schmiedeke et al. (2016) Schmiedeke, A., Schilke, P., Möller, T., et al. 2016, A&A, 588, A143
- Zhang et al. (2013) Zhang, B., Reid, M. J., Menten, K. M., et al. 2013, ApJ, 775, 79