The dusty tori of nearby QSOs as constrained by high-resolution mid-IR observations
Abstract
We present mid-infrared (MIR, m) imaging and spectroscopy observations obtained with the CanariCam (CC) instrument on the 10.4m Gran Telescopio CANARIAS for a sample of 20 nearby, MIR bright and X-ray luminous QSOs. We find that for the majority of QSOs the MIR emission is unresolved at angular scales arcsec, corresponding to physical scales pc. We find that the higher-spatial resolution CC spectra have similar shapes to those obtained with Spitzer/IRS, and hence we can assume that the spectra are not heavily contaminated by extended emission in the host galaxy. We thus take advantage of the higher signal to noise Spitzer/IRS spectra, as a fair representation of the nuclear emission, to decompose it into a combination of active galactic nuclei (AGN), polycyclic aromatic hydrocarbon (PAH) and stellar components. In most cases the AGN is the dominant component, with a median contribution of 85 per cent of the continuum light at MIR (5-15 m) within the IRS slit. This IR AGN emission is well reproduced by clumpy torus models. We find evidence for significant differences in the parameters that describe the dusty tori of QSOs when compared with the same parameters of Seyfert 1 and 2 nuclei. In particular, we find a lower number of clouds (), steeper radial distribution of clouds (), and clouds that are less optically thick () than in Seyfert 1, which could be attributed to dusty structures that have been partially evaporated and piled up by the higher radiation field in QSOs. We find that the combination of the angular width , viewing angle , and number of clouds along the equatorial line , produces large escape probabilities ( per cent) and low geometrical covering factors (), as expected for AGN with broad lines in their optical spectra.
keywords:
galaxies: QSO – infrared: galaxies – galaxies: active1 Introduction
The dusty torus (e.g., Rowan-Robinson, 1977; Krolik & Begelman, 1988) is the cornerstone of the unified scheme for Active Galactic Nuclei (AGN, e.g., Antonucci, 1993; Urry & Padovani, 1995). This framework attributes the differences between type 1 and type 2 AGN to the orientation of a putative dusty torus that surrounds the central engine around the supermassive black hole. Type 1 AGN show broad permitted optical emission lines (with full-width half-maxima km s-1) and narrow permitted and forbidden emission lines ( km s-1), while type 2 AGN only show permitted and forbidden narrow emission lines ( km s-1), as the broad line region is obscured by the torus under this framework. The torus absorbs the emission of the central engine and re-radiates it in the mid-infrared (MIR), such that at m it is the dominant component (e.g., Urry & Padovani, 1995; Urry, 2003; Packham et al., 2005; Radomski et al., 2008). Hence the shape of the MIR spectral energy distribution (SED) depends crucially on the configuration, providing a clean insight into its geometry and composition. If the dust is homogeneously distributed in the torus, the IR emission that arises from the inner region of the torus (hot and optically thin region) should be larger than the emission observed through the torus, which is optically thick, resulting in a steeper SED (e.g., Pier & Krolik, 1992; Granato & Danese, 1994; Efstathiou & Rowan-Robinson, 1995). On the other hand, if the dust is in a clumpy distribution of optically thick clouds that do not fill all the volume, then the dependence of the luminosity with the viewing angle decreases and the SED becomes flatter (e.g., Nenkova et al., 2008a, b; Stalevski et al., 2012). However, Feltre et al. (2012), in a detailed comparison of smooth and clumpy models, find that both configurations can predict similar MIR continuum shapes for different model parameters, but their predicted NIR slopes are different.
MIR observations acquired with 8m-class ground-based telescopes provide high spatial resolution data ( arcsec) crucial to isolate the emission of the dusty torus and the AGN from its host (e.g., Krabbe et al., 2001; Horst et al., 2006; Mason et al., 2006; Horst et al., 2008; Gandhi et al., 2009; Levenson et al., 2009). During the last decades these MIR observations have constrained the spatial extension of tori in nearby Seyfert galaxies to be pc (e.g., Jaffe et al., 2004; Packham et al., 2005; Tristram et al., 2007; Radomski et al., 2008), giving support to models where the torus is fragmented into clouds that form a clumpy obscuring medium.
One of the largest sample of Seyfert galaxies studied so far with ground-based MIR observations suggests that their classification as type 1 or 2 does not only depend on the viewing angle but also on the intrinsic geometry of the cloud distribution (e.g., Ramos Almeida et al., 2009, 2011; Alonso-Herrero et al., 2011; Mateos et al., 2016). In a previous work, Ichikawa et al. (2015) studied a sample of type 1 and 2 Seyfert galaxies, with and without the signs of broad polarized lines, and found that the intrinsic properties of the tori are also intrinsically different. In a recent study, García-Burillo et al. (2016) modeled the torus in the nearby Seyfert galaxy NGC1068 using ALMA plus nuclear NIR and MIR data. They found that the nuclear emission at submilimeter wavelengths (432 m) is consistent with a clumpy distribution of the dust.
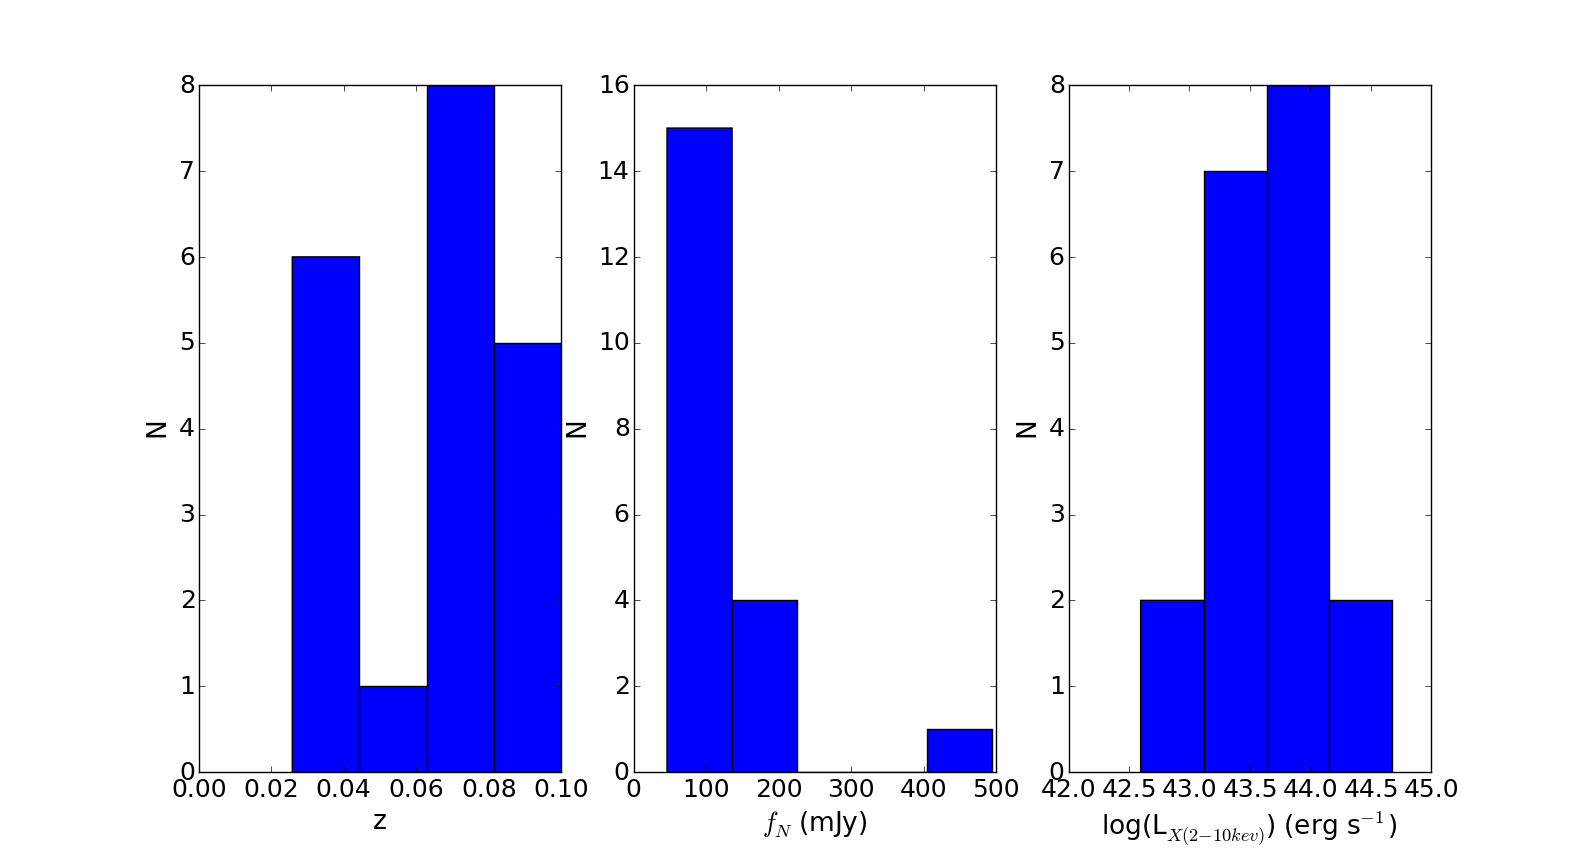
While much effort has been devoted to characterise the dusty torus of Seyfert galaxies using high angular resolution data (e.g., Ramos Almeida et al., 2011; Alonso-Herrero et al., 2011; Ichikawa et al., 2015; Hönig et al., 2010) and low angular resolution data (e.g, Lutz et al., 2004; Schweitzer et al., 2006; Ramos Almeida et al., 2007; Ichikawa et al., 2012; González-Martín et al., 2015), the study of the dusty torus in Quasi Stellar Objects (QSOs) has been limited to low resolution data ( arcsec, e.g., Mor et al., 2009; Nikutta et al., 2009; Mateos et al., 2016; Ichikawa et al., 2017). This is mainly due to their compactness and sparseness in the local Universe. The point-like morphology of QSOs does not allow us to disentangle the extended emissions from the host galaxy in the immediate vicinity of the central engine, which can be an important contaminant that impacts greatly the results on the properties of the torus. Therefore, MIR high angular resolution observations offer a good opportunity to step forward in their understanding.
Previous studies in the IR reveal that the majority of Palomar-Green (PG) QSOs (Green et al., 1986) present signs of a recent galactic interaction (e.g, Veilleux et al., 2009a) and show polycyclic aromatic hydrocarbon (PAHs) emission in the Spitzer/IRS spectrum (Schweitzer et al., 2006) indicating the presence of starbursts at scales of a few kpc for the nearest objects (). Moreover, it is also well known that these objects present prominent 10 m silicate emission features, suggesting the presence of a dusty torus. Although, it is not entirely clear whether all this emission actually arises from the inner regions of a face-on torus or whether part of it comes from an extended silicate region towards the Narrow Line Region (NLR) (Netzer, 2008). The study of the IR emission in this class of AGN requires a complex combination of components (e.g., a combination of the torus, NLR and/or starburst). Some works have also included an additional component of hot dust emission from the inner region of the torus in order to find a successful SED fitting of large aperture observations, especially between 1 and 8 m (e.g., Schweitzer et al., 2008; Mor & Netzer, 2012; Hönig et al., 2010).
In this work we present MIR high angular (0.3-0.4 arcsec) resolution imaging and spectroscopy obtained with CanariCam (CC, Telesco et al., 2003; Packham et al., 2005) in the 10.4m Gran Telescopio CANARIAS (GTC) of a sample of 20 nearby QSOs, with the aim to constrain the geometrical parameters of their dusty tori and compare them with those found in Seyfert galaxies that have been studied with similar techniques. In Section 2 we present the QSO sample. In Section 3 we show our new high angular resolution observations and in 4 the ancillary data we will use in the modelling. Section 5 presents some basic analysis of the data, in Section 6 we present the spectral decomposition into AGN and starburst components, and in Section 7 we perform spectral fitting of the unresolved IR SED and MIR spectroscopy using clumpy models. We discuss the main results in Section 8.2 and our conclusions are given in Section 9. We adopt a cosmology with km s-1Mpc-1, and .
2 The sample
| Name (AGN-type) | RA (2000) | DEC (2000) | Scale | d | Radioc | |||
|---|---|---|---|---|---|---|---|---|
| (h:m:s) | (h:m:s) | (kpc/arcsec) | (Mpc) | (mag) | (erg s-1) | |||
| PG 0003+199/Mrk 335 (1) | 00:06:19.5 | 20:12:10 | 0.03 | 0.498 | 122 | -19.0 | Qd1 | 1. |
| PG 0007+106/Mrk 1501 (1.2) | 00:10:31.0 | 10:58:30 | 0.09 | 1.602 | 363 | -22.9 | Ld2 | 1. |
| PG 0050+124/IZw1 (1) | 00:53:34.9 | 12:41:36 | 0.06 | 1.094 | 243 | -22.7 | Q | 7. |
| PG 0804+761 (1) | 08:10:58.6 | 76:02:43 | 0.10 | 1.772 | 402 | -23.2 | Q | 2. |
| PG 0844+349 (1) | 08:47:42.4 | 34:45:04 | 0.06 | 1.182 | 243 | -22.4 | Q | 5. |
| PG 0923+129/Mrk 705 (1.2) | 09:26:03.3 | 12:44:04 | 0.03 | 0.562 | 122 | -20.9 | Qd3 | 2. |
| PG 1211+143 (NL1) | 12:14:17.7 | 14:03:13 | 0.08 | 1.465 | 323 | -23.3 | Q | 5. |
| PG 1229+204/Mrk 771 (1) | 12:32:03.6 | 20:09:29 | 0.06 | 1.165 | 243 | -20.0 | Q | 3. |
| PG 1351+640 (1.5) | 13:53:15.7 | 63:45:46 | 0.09 | 1.584 | 363 | -23.3 | Q | 1. |
| PG 1411+442 (1) | 14:13:48.3 | 44:00:14 | 0.09 | 1.607 | 363 | -23.9 | Q | 2. |
| PG 1426+015/Mrk 1383 (1) | 14:29:06.6 | 01:17:06 | 0.09 | 1.558 | 363 | -22.7 | Q | 1. |
| PG 1440+356/Mrk 478 (NL1) | 14:42:07.4 | 35:26:23 | 0.08 | 1.436 | 323 | -22.7 | Q | 5. |
| PG 1448+273 (NL1) | 14:51:08.8 | 27:09:27 | 0.07 | 1.199 | 283 | -22.2 | Qd4 | 2. |
| PG 1501+106/Mrk 841 (1.5) | 15:04:01.2 | 10:26:16 | 0.04 | 0.694 | 163 | -20.9 | Qd5 | 7. |
| PG 1534+580/Mrk 290 (1.5) | 15:35:52.3 | 57:54:09 | 0.03 | 0.569 | 122 | -18.5 | Qd1 | 1. |
| PG 1535+547/Mrk 486 (1) | 15:36:38.3 | 54:33:33 | 0.04 | 0.740 | 163 | -20.8 | – | 4. |
| PG 2130+099/IIZw136 (1.5) | 21:32:27.8 | 10:08:19 | 0.06 | 1.165 | 243 | -18.5 | Q | 3. |
| PG 2214+139/Mrk 304 (1) | 22:17:12.2 | 14:14:21 | 0.07 | 1.213 | 283 | -22.3 | Q | 6. |
| Mrk 509 (1.5) | 20:44:09.7 | -10:43:25 | 0.03 | 0.657 | 122 | -22.5 | Qd4 | 4. |
| MR 2251-178 (1.5) | 22:54:05.9 | -17:34:55 | 0.06 | 1.182 | 243 | -22.2 | – | 2. |
References.aNED, bVéron-Cetty & Véron (2010), cKellermann et al. (1994), d1Zhou & Zhang (2010), d2Laurent-Muehleisen et al. (1997), d3Bicay et al. (1995), d4Barvainis et al. (1996), d5Edelson (1987),eZhou & Zhang (2010), e1Piconcelli & Guainazzi (2005), e2Shu et al. (2010), e3Bianchi et al. (2009), e4Gallo (2006).
We select a representative sample of 20 X-ray luminous and MIR-bright nearby QSOs from the latest version of the Véron-Cetty & Véron (2010) catalogue and the NASA/IPAC Extragalactic Database111https://ned.ipac.caltech.edu/ (NED), that meet the following criteria: 1) redshift to obtain a minimum spatial scale of 1.8 kpc/arcsec, so that for our projected nearly difraction-limited observations ( arcsec) we sample spatial scales pc; 2) flux density at band Jy to be able to detect them with CanariCam (CC) on the 10.4 m GTC; and 3) intrinsic X-ray luminosity erg s-1, to focus on the most powerful AGN.
All objects in our sample, except Mrk 509 and MR 2251-178, are also part of the Bright Quasar Survey (Schmidt & Green, 1983) and Palomar Green survey (Neugebauer et al., 1987). Mrk 509 is usually classified as a type 1 Seyfert nucleus. However, this object fits all our selection criteria and has an absolute magnitude () consistent in the optical with the QSO definition (Véron-Cetty & Véron, 2010). MR 2251-178 has not been widely studied but also fits our selection criteria, and its X-ray luminosity places it among the most powerful AGN with (Véron-Cetty & Véron, 2010). Note that all the objects in our sample have Spitzer/IRS spectra, except for MR 2251-178.
3 Observations and data reduction
3.1 GTC/CC 8.7 m imaging
| Name | Date | STD | Airmass | PWV | PA | Programme | |||
|---|---|---|---|---|---|---|---|---|---|
| (s) | (s) | (min) | (arcsec) | (mm) | (deg) | ||||
| PG 0003+199 | 2013.09.15 | 904 | HD 2436 | 8 | 0.27 | 1.18 | 11.3 | 0 | GT |
| PG 0007+106 | 2013.09.27 | 973 | HD 2436 | 9 | 0.30 | 1.20 | 13.6-14.0 | 0 | MEX |
| PG 0050+124 | 2013.09.14 | 904 | HD 2436 | 9 | 0.35 | 1.3 | 9.8-10.3 | 0 | GT |
| PG 0804+761 | 2014.01.03 | HD 64307 | 42 | 0.33 | 1.47 | 9.4 | 360 | ESO-GTC | |
| PG 0844+349 | 2014.01.06 | HD 81146 | 17 | 0.34 | 1.05 | 7.3-7.1 | 360 | ESO-GTC | |
| PG 0923+129 | 2015.04.03 | 695 | HD 82381 | 9 | 0.34 | 1.04 | 5.0-5.5 | 0 | MEX |
| PG 1211+143 | 2014.03.14 | HD 107328 | 26 | 0.31 | 1.04 | 0 | ESO-GTC | ||
| PG 1229+204 | 2014.06.08 | 1251 | HD 111067 | 8 | 0.27 | 1.04 | 6.3-6.4 | 360 | ESO-GTC |
| PG 1351+640 | 2014.05.20 | 1112 | HD114326 | 8 | 0.28 | 1.08 | 4.6 | 360 | MEX |
| PG 1411+442 | 2014.03.16 | HD128902 | 2 | 0.27 | 0.96 | 4.0-3.5 | 360 | ESO-GTC | |
| PG 1426+015 | 2012.03.09 | HD126927 | 58 | 0.40 | 1.15 | 3.0 | 0 | ESO-GTC | |
| PG 1440+356 | 2014.03.16 | 209 | HD128902 | 4 | 0.25 | 1.13 | 4.8 | 0 | ESO-GTC |
| PG 1448+273 | 2014.06.08 | 1112 | HD138265 | 11 | 0.27 | 1.35 | 8.1-5.1 | 360 | MEX |
| PG 1501+106 | 2013.08.30 | HD 140573 | 7 | 0.27 | 1.48 | 5.3 | 360 | ESO-GTC | |
| PG 1534+580 | 2015.04.04 | 695 | HD 138265 | 6 | 0.33 | 1.28 | 1.8-2.5 | 360 | MEX |
| PG 1535+547 | 2014.05.16 | 1112 | HD138265 | 6 | 0.30 | 1.61 | 4.8-5.0 | 360 | MEX |
| PG 2130+099 | 2014.06.10 | 904 | HD206445 | 8 | 0.28 | 1.13 | 7.4-7.5 | 0 | GT |
| PG 2214+139a | 2013.09.17 | 1042 | HD220363 | 13 | 0.8 | 1.32 | 9.0 | 0 | MEX |
| MR2251-178 | 2013.09.17 | 1043 | HD220363 | 7 | 0.3 | 1.30 | 0 | MEX |
Notes.–a Bad quality image.
Twelve QSOs in our sample were observed within the European Southern Observatory-GTC (PI: A. Alonso-Herrero, ID: 182.B-2005) and the CC Guaranteed Time (PI: C. Telesco) large programmes, which also include a large sample of other AGN with X-ray luminosities between erg s-1 (Alonso-Herrero et al., 2016a). The other 8 objects were observed with Mexican time on this facility (PIs: I. Aretxaga and M. Martínez-Paredes).
All QSOs in the sample, except for Mrk 509, were observed with GTC/CC in imaging mode with the Si2 filter ( m, m) between March 2012 and April 2015. Note that we excluded Mrk 509 because it has unresolved emission at MIR, as reported by Hönig et al. (2010). On average, the images were acquired with a precipitable water vapour (PWV) 7.1 mm and typical air mass of 1.2. The log of the imaging observations is compiled in Table 1.
In order to flux-calibrate and estimate the image quality, a standard star was imaged with the same filter just before or after the science target. Considering that the theoretical diffraction-limited FWHM222http://www.gtc.iac.es/instruments/canaricam/canaricam.php#Imaging of the point spread function (PSF) of CC in the Si2 band is 0.19 arcsec, the majority of QSOs have good image quality ( arcsec), except for PG 2214+139, which was observed with arcsec.
We use the CC pipeline RedCan developed by González-Martín et al. (2013) for the reduction and analysis of ground-based MIR CC and T-ReCS imaging and spectroscopy. The image reduction starts with sky subtraction, stacking of individual images, and rejection of bad images. Next, flux calibration is performed using the standard star. These were selected from the catalogue of spectrophotometric standard stars published by Cohen (1999). The final step for image reduction is aperture photometry of the target inside a default aperture radius of 0.9 arcsec, which is a good estimate of the total flux for point-like sources.
3.2 GTC/CC 7.5-13.5 m spectroscopy
| Name | Date | STD | Airmass | PWV | PA | Programme | ||
|---|---|---|---|---|---|---|---|---|
| (s) | (arcsec) | (mm) | (deg) | |||||
| PG 0003+199 | 2013.09.22 | HD 2436 | 0.24 | 1.25 | NA | 65 | GT | |
| PG 0804+761 | 2014.03.15 | HD 64307 | 0.33 | 1.48 | 7.7 | 360 | ESO-GTC | |
| 2014.01.03 | HD 64307 | 0.33 | 1.56 | 7.6 | 360 | |||
| PG 0844+349 | 2014.12.03 | 1238 | HD 81146 | 0.28 | 1.45 | 0 | ESO-GTC | |
| 2014.12.05 | 1238 | HD 81146 | 0.34 | 1.15 | 7.2 | 360 | ||
| PG 1211+143 | 2014.03.14 | HD 113996 | 0.34 | 1.07 | 8 | 0 | ESO-GTC | |
| 2014.06.18 | 943 | HD 109511 | 0.24 | 1.31 | 8.1 | 360 | ||
| PG 1229+204 | 2014.06.20 | 1238 | HD 111067 | 0.42 | 1.35 | 7.1 | 360 | ESO-GTC |
| 2014.06.20 | 1238 | HD 111067 | 0.42 | 1.31 | 8.1 | 360 | ||
| PG 1411+442 | 2014.05.30 | 1238 | HD 128902 | 1.05 | 6.9 | 6.9 | 360 | ESO-GTC |
| 2014.05.31 | 1238 | HD 128902 | 0.36 | 1.35 | 5.9 | 360 | ||
| PG 1426+015 | 2014.05.19 | 943 | HD 126927 | 0.34 | 1.16 | 360 | ESO-GTC | |
| 2014.06.09 | 943 | HD 126927 | 0.30 | 1.33 | 8.7 | |||
| PG 1440+356 | 2014.06.07 | 1238 | HD 128902 | 0.30 | 1.03 | 360 | ESO-GTC | |
| 2014.06.07 | 1238 | HD 128902 | 0.26 | 1.12 | 360 | |||
| PG 1501+106 | 2014.05.27 | 943 | HD 133165 | 0.37 | 1.12 | 4.8 | 360 | ESO-GTC |
| 2014.05.01 | 943 | HD 133165 | 0.28 | 1.33 | 6.0 | 360 | ||
| PG 2130+099 | 2014.09.21 | HD 206445 | 0.31 | 1.05 | 90 | GT | ||
| MR 2251-178 | 2015.07.06 | 1120 | HD219449 | 0.52 | 1.52 | 7.0 | 90 | MEX |
We observed 10 QSOs within the guaranteed and ESO-GTC time in low-resolution spectroscopy () at band ( m). These data were acquired between September 2013 and December 2014 with a slit width of arcsec. Furthermore, Mrk 509 and PG 0050+124 (IZw1) were already observed with VISIR/VLT by Hönig et al. (2010) and Burtscher et al. (2013), respectively (see Section 4), and we used their high-resolution spectroscopy in our analysis. We also observed MR 2251-178 within the Mexican time because this is the only object in the sample without Spitzer/IRS spectra. The low resolution spectroscopy for this object was obtained in July 2015 with a slitwidth of arcsec. Altogether, spectroscopy was acquired in 8-10m-class telescopes for 13 out of the 20 objects.
On average, CC spectroscopy was obtained with a mm and airmass . We estimate the image quality from the image of the standard star obtained at Si2 band just before the acquisition of the science target ( arcsec). The log of CC spectroscopic observations is shown in Table 3.
The spectroscopic observations were also reduced with RedCan. The first steps of the reduction process are similar to those for imaging, followed by two-dimensional wavelength calibration of the target and standard star using sky lines. Then, we define the trace of a PSF using the observations of the standard star. Finally, a point-like extraction was made and we applied both slit-loss correction and aperture correction. For more details on the MIR data reduction pipeline see González-Martín et al. (2013).
4 Ancillary data
We compile high angular resolution NIR ( m), MIR ( m) imaging and spectroscopy from the literature with estimates of unresolved emission, when available, in order to build complete nuclear NIR-to-MIR SEDs of the QSOs in the sample. The unresolved fluxes are the result of removing, using various methods, the underlying NIR and MIR emission related to the host galaxy, and not directly linked to AGN and dusty torus emission. In Table 4 we list the data gathered from previous studies.
| Name | F160W-HST/NICMOS (PSF) | K′-QUIRC/Gemini (PSF) | H-QUIRC/Gemini (PSF) |
|---|---|---|---|
| (mJy) | (mJy) | (mJy) | |
| PG 0007+106 | 2.9 | .3 | … |
| PG 0050+124 | 11.4 | 9.6 | … |
| PG 0804+761 | … | .2 | .2 |
| PG 0844+349 | 5.9 | … | … |
| PG 1211+143 | … | … | .51 |
| PG 1229+204 | 2.7 | .0 | … |
| PG 1351+640 | … | .3 | 4 |
| PG 1411+442a | 7.1 | .8 | … |
| PG 1426+015 | 5.8 | .1 | … |
| PG 1440+356 | 9.1 | .6 | … |
| PG 2130+099 | 9.2 | .5 | … |
| PG 2214+139 | 6.5 | … | … |
| Mrk 509b | … | … | … |
Notes.–aThis object presents an unresolved flux at band mJy from QUIRC/Gemini . bThis object presents fluxes measured in an aperture diameter of 3 arcsec at ( mJy), ( mJy) and ( mJy) bands from ISAAC/VLT, which have been used in the present work as upper limits (Fischer et al., 2006).
4.1 HST/NICMOS data
Veilleux (2006) and Veilleux et al. (2009b) observed with NICMOS/HST at band (F160W, m) a sample of 28 QSOs as part of the Quasar/ULIRG Evolution Study (QUEST), 9 of which are in our sample. The high angular resolution ( arcsec) and pixel size ( arcsec pixel-1) of NICMOS allows to have a good estimate of the unresolved emission ( arcsec). In the present work we have used the unresolved emission reported in this band. The photometric errors are .
4.2 Upper limits from QUIRQ on Gemini North and ISAAC/VLT
Guyon et al. (2006) report unresolved emission at band ( m, m), and at band (, m) for several of our QSOs (see Table 4). These data were obtained with the IR camera QUIRC (Hodapp et al. 1996) on the Gemini North telescope, with an angular resolution arcsec.
Mrk 509 has nuclear fluxes at ( m), ( m) and ( m) bands measured with the IR camera ISAAC on the Very Large Telescope (VLT), with a spatial resolution of arcsec. The nuclear flux was, however, measured in an aperture diameter of 3 arcsec (Fischer et al., 2006), and hence, we use these fluxes as upper limits.
4.3 VISIR/VLT nuclear spectroscopy at N band
4.4 Spitzer/IRS spectroscopy
Most QSOs in our sample are part of the Spitzer/IRS telescope spectroscopic survey QUEST (PID: 3187; PI: Veilleux). In general, they have been observed with the following low-resolution modes333http://irsa.ipac.caltech.edu/: SL1 m, SL2 m, LL1 m and LL2 m. The slit widths range from 3.6 to 11.1 arcsec.
Fully-reduced and calibrated spectra were downloaded from the Cornell Atlas database of Spitzer/IRS CASSIS (v6; Lebouteiller et al., 2011), which provides optimal extraction regions to ensure the best ratio. We stitch the different module spectra together using module SL2 as a reference spectrum for flux scaling using our own Python routines.
5 Analysis
5.1 MIR imaging photometry at Si2 band (m)
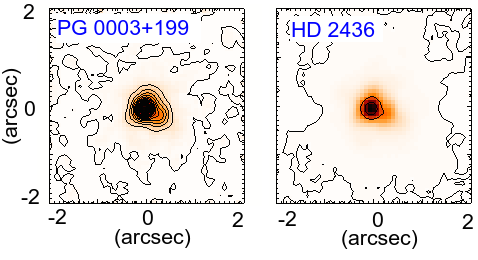
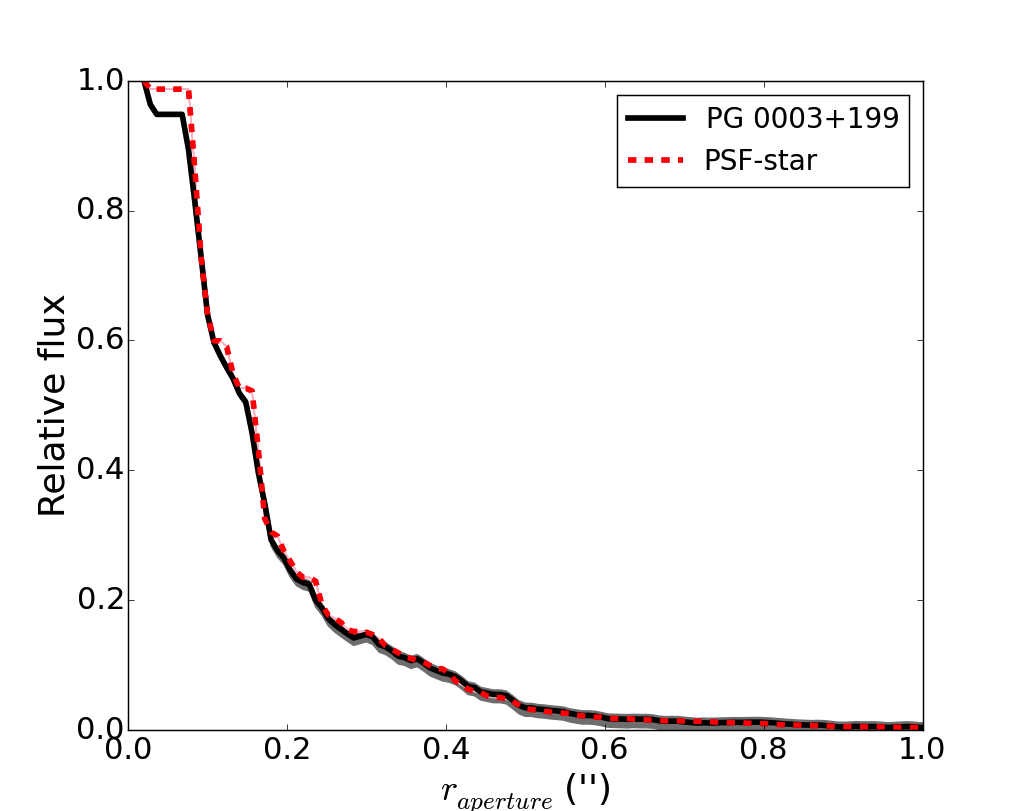
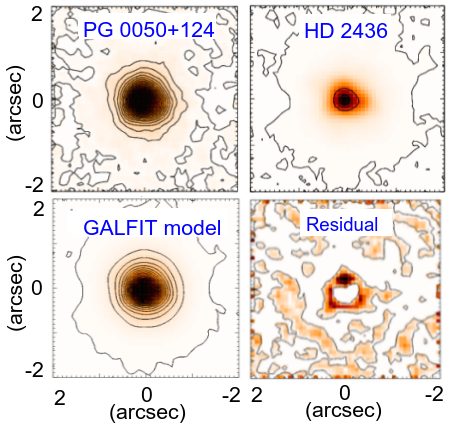
In order to estimate if the QSOs have extended emission over the stellar PSF, we perform aperture photometry on the QSOs and their corresponding standard stars with increasing apertures using the phot and aphot tasks of the image analysis package IRAF. We combine these measurements to build radial profiles. Figure 2 shows the images of PG 0003+199, its standard star and their radial profiles, in which it is clearly seen that the QSO is dominated by unresolved emission. In Figure 3 we show the data and analysis for PG 0050+124, which presents a clear extended component. For this object we also show the galfit model and its residual (see Appendix A for more details on the analysis of the extended component with galfit). The images and analysis for the rest of the QSOs can be seen in Appendix 444https://drive.google.com/open?id=0B9f3R8mc1H8BN3Y0b3RIWDViZ2M.
The uncertainties in the radial profiles include photometric errors, which are estimated as , where is the number of pixels inside the aperture considered, is the number of pixels inside an 80 pixel-width ring around the source, used to estimate the background level and its standard deviation (see Reach et al., 2005). The second term of the error equation is almost negligible because the backgrounds in our images are flat. In addition, we also consider a six per cent uncertainty due to time-variability of the sky transparency and adopt a 13 per cent uncertainty due to PSF-variability555This has been calculated from the analysis of several standard stars observed during the same night at MIR with T-ReCS on Gemini (Mason et al., 2012)..
 |
 |
 |
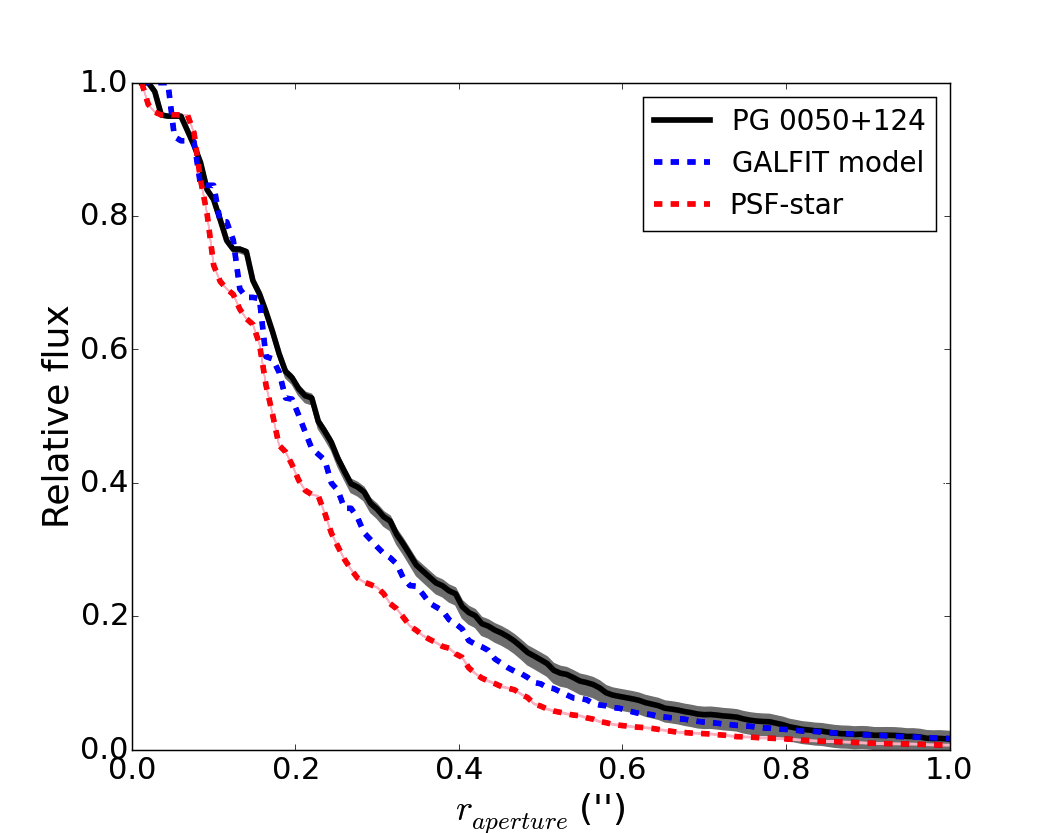 |
In order to estimate variations of the PSF due to variable sky conditions, we use observations of the same standard star acquired consecutively. For two of the QSOs (PG 1426+015 and PG 1229+204) we acquired several observations of the standard star just before or after the target. We find that the FWHM of the PSF varies in time scales of a few minutes. Consistent with the results of Mason et al. (2012). This is likely the reason why several QSOs (e.g. PG 0804+761, PG 0844+349, PG 0923+129, PG 1229+204, PG 1351+640, PG 2130+099) show radial profiles with FWHM slightly narrower than their corresponding standard stars (see Figures in Appendix).
Allowing for these mild FWHM variations, the radial profile of the standard stars represents the maximum contribution to the emission due to an unresolved source. Therefore, taking into account all the uncertainties, all QSOs, except PG 0050+124, are unresolved in our MIR imaging (see Figures in Appendix). In Table 5 we list the flux at Si2 band measured inside an aperture radius of 1 arcsec, plus the ratio between the FWHM of the QSO and its standard star, which shows that the majority of the objects in the sample are indeed unresolved. The errors are estimated adding in quadrature the photometric error, the flux calibration, the time-variability and the PSF-variability uncertainties.
| Name | () | |
|---|---|---|
| (mJy) | ||
| PG 0003+199 | 159..1 | 1.0 |
| PG 0007+106 | 40..2 | 1.2 |
| PG 0050+124 | 249..2 | 1.3 |
| PG 0804+761 | 105..2 | 1.0 |
| PG 0844+349 | 29..7 | 0.9 |
| PG 0923+129 | 92..2 | 0.9 |
| PG 1211+143 | 89..2 | 1.1 |
| PG 1229+204 | 31..2 | 1.0 |
| PG 1351+640 | 67..2 | 0.9 |
| PG 1411+442 | 65..4 | 1.0 |
| PG 1426+015 | 56..1 | 1.1 |
| PG 1440+356 | 67..004 | 1.3 |
| PG 1448+273 | 25..2 | 1.1 |
| PG 1501+106 | 92..1 | 1.0 |
| PG 1534+580 | 111..9 | 1.2 |
| PG 1535+547 | 43..0 | 1.1 |
| PG 2130+099 | 118..1 | 0.9 |
| MR2251-178 | 49..2 | 1.3 |
5.2 Spitzer/IRS and GTC/CC spectroscopy
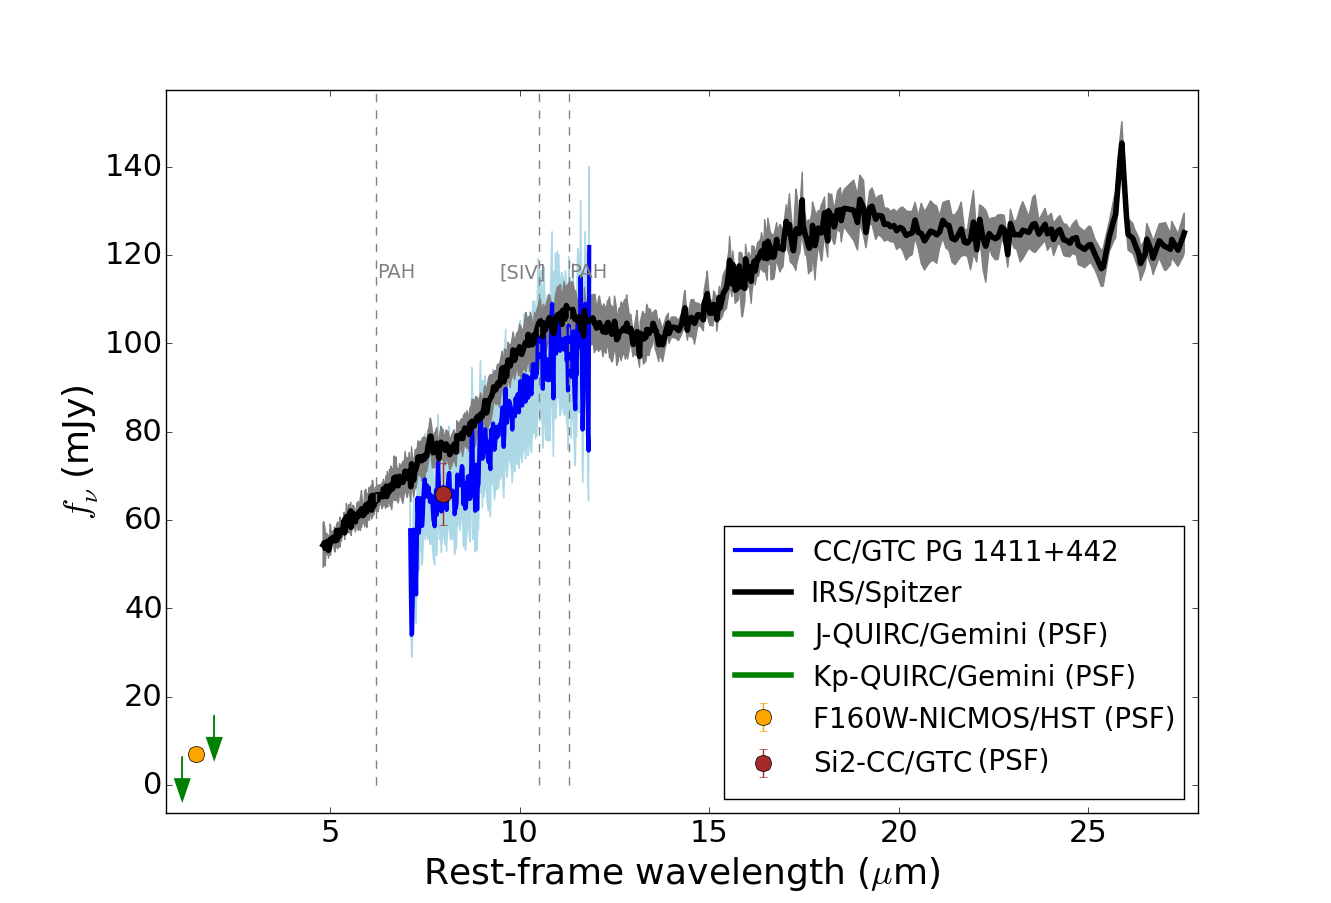
We compare the nuclear GTC/CC and Spitzer/IRS spectra for the 10 QSOs with both types of data (namely, PG 0003+199, PG 0804+761, PG 0844+349, PG 1211+143, PG 1229+204, PG 1411+442, PG 1426+015, PG 1440+356, PG 1501+106 and PG 2130+099, see Figure 4 and Figures in Appendix). We observe that, within the uncertainties, the shapes of both spectra are similar. The most notable differences are at the edges of the GTC/CC spectra ( and m) and in the m rest-frame range. We attribute these differences to low atmospheric transmission666http://www.gtc.iac.es/instruments/canaricam/MIR.php (see Figure 4).
In general, the flux measured in the Si2 band within 1 arcsec apertures is consistent with both the nuclear GTC/CC and Spitzer/IRS spectra. For MR 2251-178, the only QSO that does not have Spitzer/IRS spectrum, the unresolved emission in Si2 band is consistent with the spectral flux at 8.7 m. As an example, in Figure 4 we show the observed NIR to MIR unresolved SED and spectroscopy of PG 1411+442, and the rest of the QSOs are show in Appendix.
For the QSOs that do not have nuclear GTC/CC spectra we compare the flux of the unresolved emission in Si2-band image with that derived from the Spitzer/IRS spectra. PG 1351+640 and PG 1535+547 have Si2 unresolved emission consistent with their Spitzer/IRS spectra at 8.7 m (see Figures in Appendix). PG 0007+106 and PG 1448+273 have unresolved emission fainter than their spectra at 8.7 m, suggesting the presence of an extended component within the Spitzer aperture (see Figures in Appendix). Finally, PG 0923+129 and PG 1534+580 have unresolved emission estimated from the image that is brighter than that of its spectrum at 8.7 m (see Figures in Appendix), probably due to uncertainties in the flux loss correction (Alonso-Herrero et al., 2016a). PG 2214+139 has a bad quality image at Si2 band and it is not possible to measure the flux to compare it with its Spitzer/IRS spectrum.
For PG 0050+124 and Mrk 509 we compare the nuclear VISIR/VLT spectra with the Spitzer/IRS spectra and the unresolved emission at Si2 band from CC. In both cases the flux of the nuclear VISIR/VLT spectra is lower than the Spitzer/IRS ones, while the CC unresolved emission is consistent with the nuclear VISIR/VLT spectra (see Figures in Appendix. The spectral shapes of VISIR/VLT and Spitzer/IRS spectra are also similar.
The nuclear and Spitzer/IRS spectral shapes are similar and the unresolved emission at Si2 band is consistent with the nuclear and Spitzer/IRS spectra. Thus, we assume that the Spitzer/IRS spectra of all QSOs in our sample are mostly dominated by emission due to the AGN and its surrounding torus.
| Name | PAH | % | AGN | % | stellar emission | % | ||
|---|---|---|---|---|---|---|---|---|
| PG 0003+199 | NGC 3769 | 0.3 | PG 1114+445 | 83.6 | M 85 | 16.0 | 0.071 | 0.019 |
| PG 0007+106 | NGC 3187 | 3.1 | PG 1114+445 | 88.4 | NGC 5812 | 8.5 | 0.226 | 0.030 |
| PG 0050+124 | NGC 2993 | 0.0 | [HB89] 1402+436 | 99.5 | M 85 | 0.5 | 0.45 | 0.042 |
| PG 0804+761 | NGC 3769 | 0.1 | J143220.15+331512.2 | 75.2 | NGC 1700 | 24.7 | 0.315 | 0.042 |
| PG 0844+349 | NGC 5996 | 3.3 | J131217.7+351521 | 89.3 | NGC 1374 | 7.5 | 0.289 | 0.036 |
| PG 0923+129 | UGC 09618 | 7.0 | PG 1149-110 | 88.8 | M 85 | 4.2 | 0.279 | 0.031 |
| PG 1211+143 | NGC 3769 | 1.4 | 3C 445 | 98.6 | NGC 4474 | 0.0 | 1.043 | 0.023 |
| PG 1229+204 | NGC 2993 | 0.0 | PG 1149-110 | 87.5 | NGC 1700 | 12.5 | 0.227 | 0.031 |
| PG 1351+640 | NGC 2993 | 0.0 | 2MASX J02343065+2438353 | 97.1 | NGC 1700 | 2.9 | 4.33 | 0.146 |
| PG 1411+442 | J14361112+6111265 | 1.7 | J1640100+410522 | 80.2 | NGC 1700 | 18.1 | 0.096 | 0.019 |
| PG 1426+015 | ESO 557-G-001 | 1.0 | VII Zw 244 | 86.0 | NGC 1700 | 13.0 | 0.120 | 0.027 |
| PG 1440+356 | ESO 467 G 013 | 8.1 | Mrk 1501 | 86.3 | NGC 0821 | 5.6 | 0.530 | 0.021 |
| PG 1448+273 | NGC 3310 | 3.4 | J160222.38+164353.7 | 83.7 | NGC 5812 | 12.9 | 0.333 | 0.048 |
| PG 1501+106 | MCG +08-11-002 | 0.0 | PG 1149-110 | 99.2 | NGC 5831 | 0.7 | 0.2 | 0.029 |
| PG 1534+580 | ESO 244-G-012 | 2.5 | VII Zw 244 | 93.8 | NGC 5831 | 3.7 | 0.271 | 0.032 |
| PG 1535+547 | NGC 3769 | 2.4 | J1640100+410522 | 80.1 | NGC 1700 | 17.5 | 0.203 | 0.028 |
| PG 2130+099 | NGC 3187 | 0.6 | J14492067+4221013 | 89.1 | NGC 4570 | 10.3 | 0.107 | 0.025 |
| PG 2214+139 | NGC 2993 | 0.0 | HB89-1435-067 | 84.8 | NGC 4570 | 15.2 | 0.062 | 0.016 |
| Mrk 509 | NGC 3310 | 8.1 | 3C 390.3 | 84.0 | NGC 1549 | 7.9 | 0.068 | 0.023 |
| Name | (8..5 m) | |||
|---|---|---|---|---|
| (erg s-1) | (erg s-1) | |||
| PG 0003+199 | ||||
| PG 0007+106 | ||||
| PG 0050+124a | ||||
| PG 0804+761 | ||||
| PG 0844+349 | ||||
| PG 0923+129 | ||||
| PG 1211+143 | ||||
| PG 1229+204 | ||||
| PG 1351+640a | ||||
| PG 1411+442 | ||||
| PG 1426+015 | ||||
| PG 1440+356 | ||||
| PG 1448+273 | ||||
| PG 1501+106 | ||||
| PG 1534+580 | ||||
| PG 1535+547 | ||||
| PG 2130+099 | ||||
| PG 2214+139 | ||||
| Mrk 509 |
Notes.-aThese objects were poorly fitted around the silicate feature, and hence we measure the feature on the spectra directly (see statistics in Table 6).
6 Spitzer/IRS spectral decomposition: isolating the AGN emission
Evidence for star formation through the detection of PAH features in the Spitzer/IRS spectra is present in 40 per cent of the QSOs studied by Schweitzer et al. (2006), and also in the stacked spectrum of those that lacked individual detections, implying that starbursts are present in most QSOs. We use the tool deblendIRS (Hernán-Caballero et al., 2015) to decompose the Spitzer/IRS spectra of the QSOs into their starburst (PAH and stellar) and AGN components. deblendIRS uses a set of Spitzer/IRS templates of galaxies dominated by AGN emission, PAH emission (interstellar medium, ISM) and stellar emission (passive population of the host galaxy) and follows a minimization method to find the combination of templates that best reproduces the spectrum of the source under study. Additionally, the rms-variation coefficient is also used as a second criterium to select the best combination of templates (Hernán-Caballero et al., 2015).
Using Bayesian inference, deblendIRS estimates the probability distribution of the fractional contribution to the integrated MIR emission for the stellar, PAH and AGN components, the AGN luminosity contribution at 12 and 6 m, and the starburst luminosity contribution at 12 m. It also calculates the MIR spectral index and the silicate strength for the AGN component, where is calculated between 6 and m assuming a power law , and the silicate strength is defined as
| (1) |
where and are the flux densities at the peak of the silicate feature and its underlying continuum, respectively. See Hernán-Caballero et al. (2015) for details.
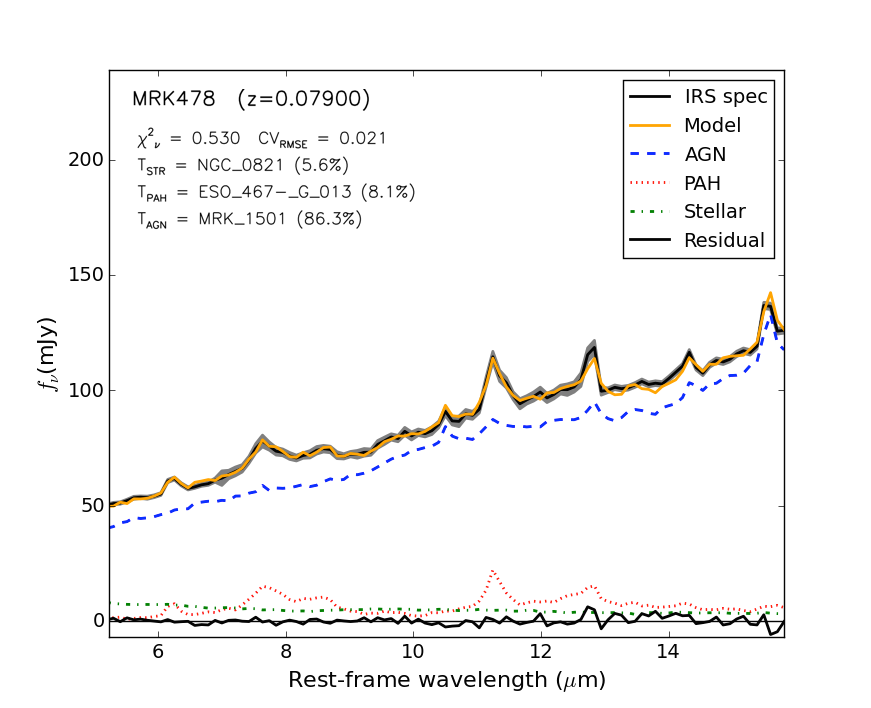
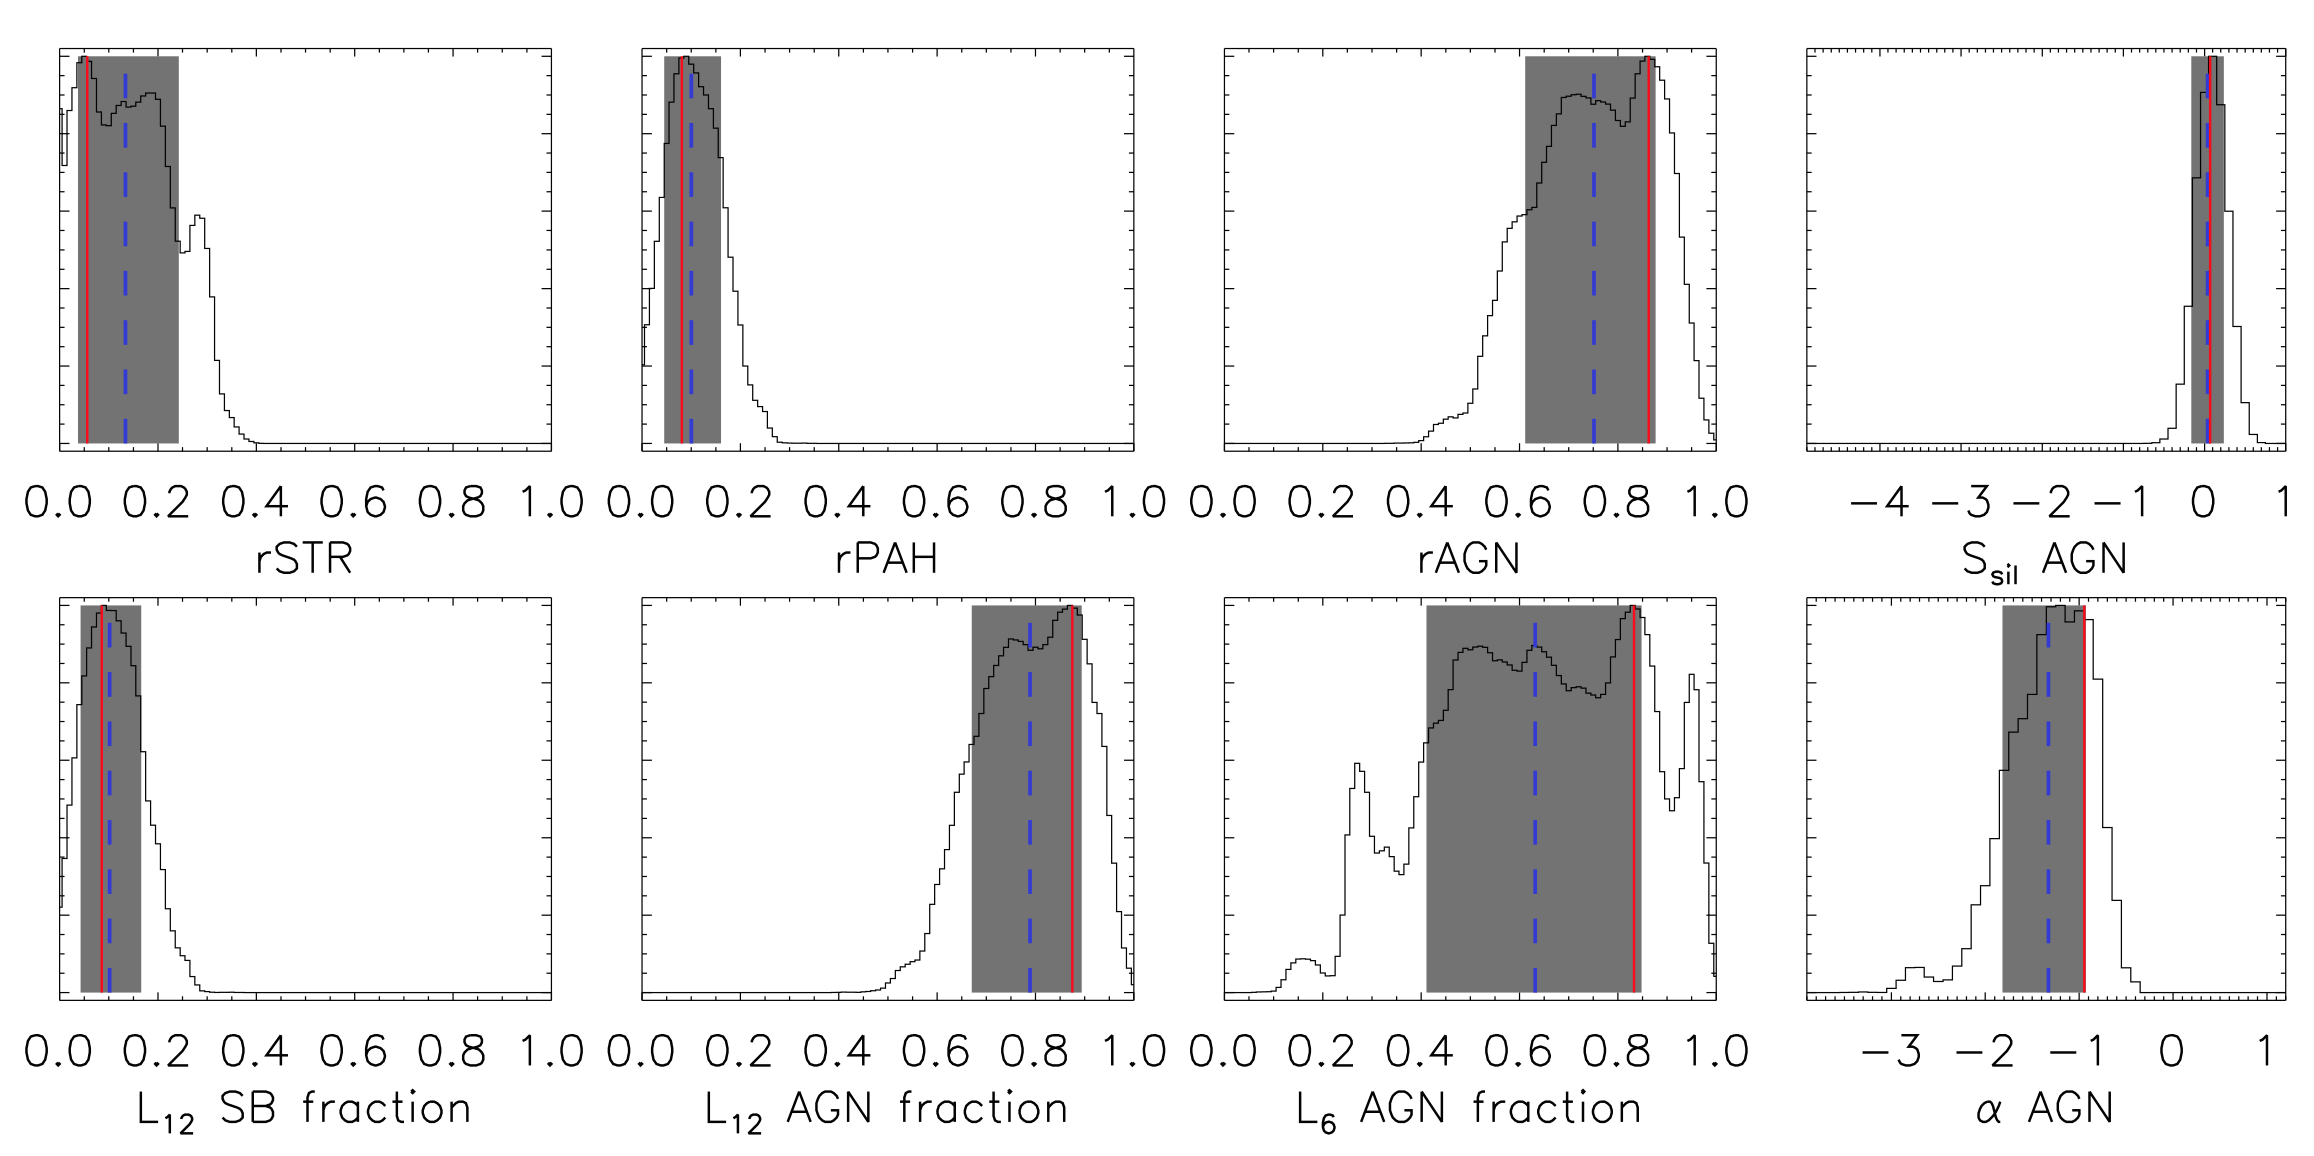
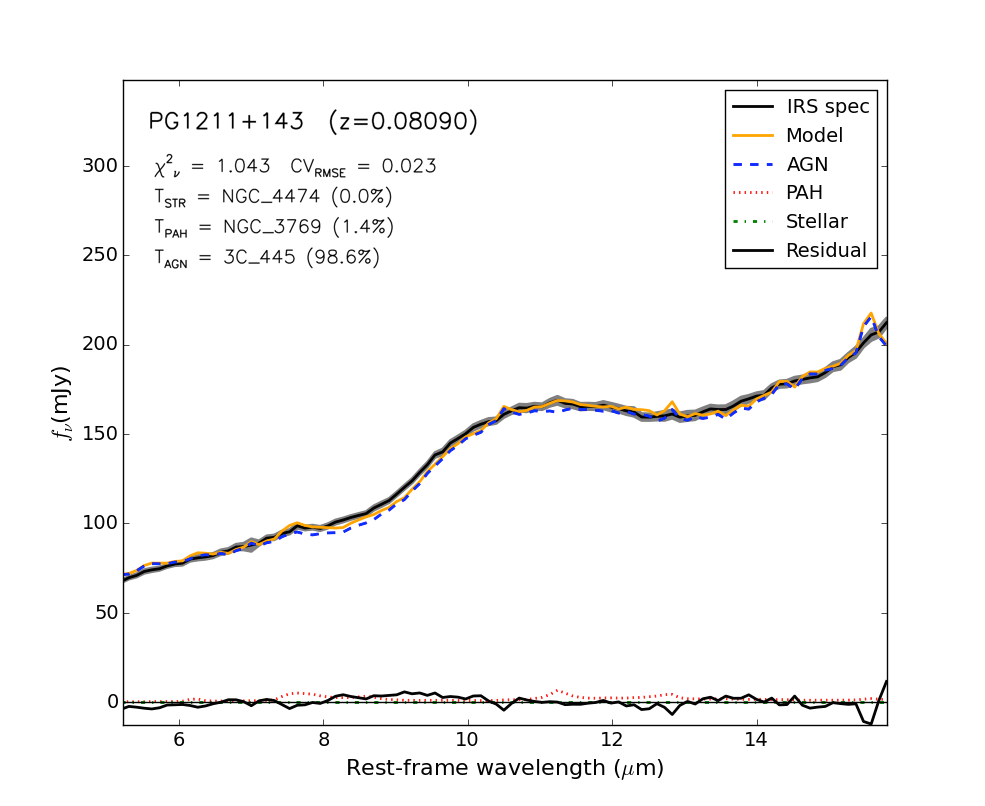
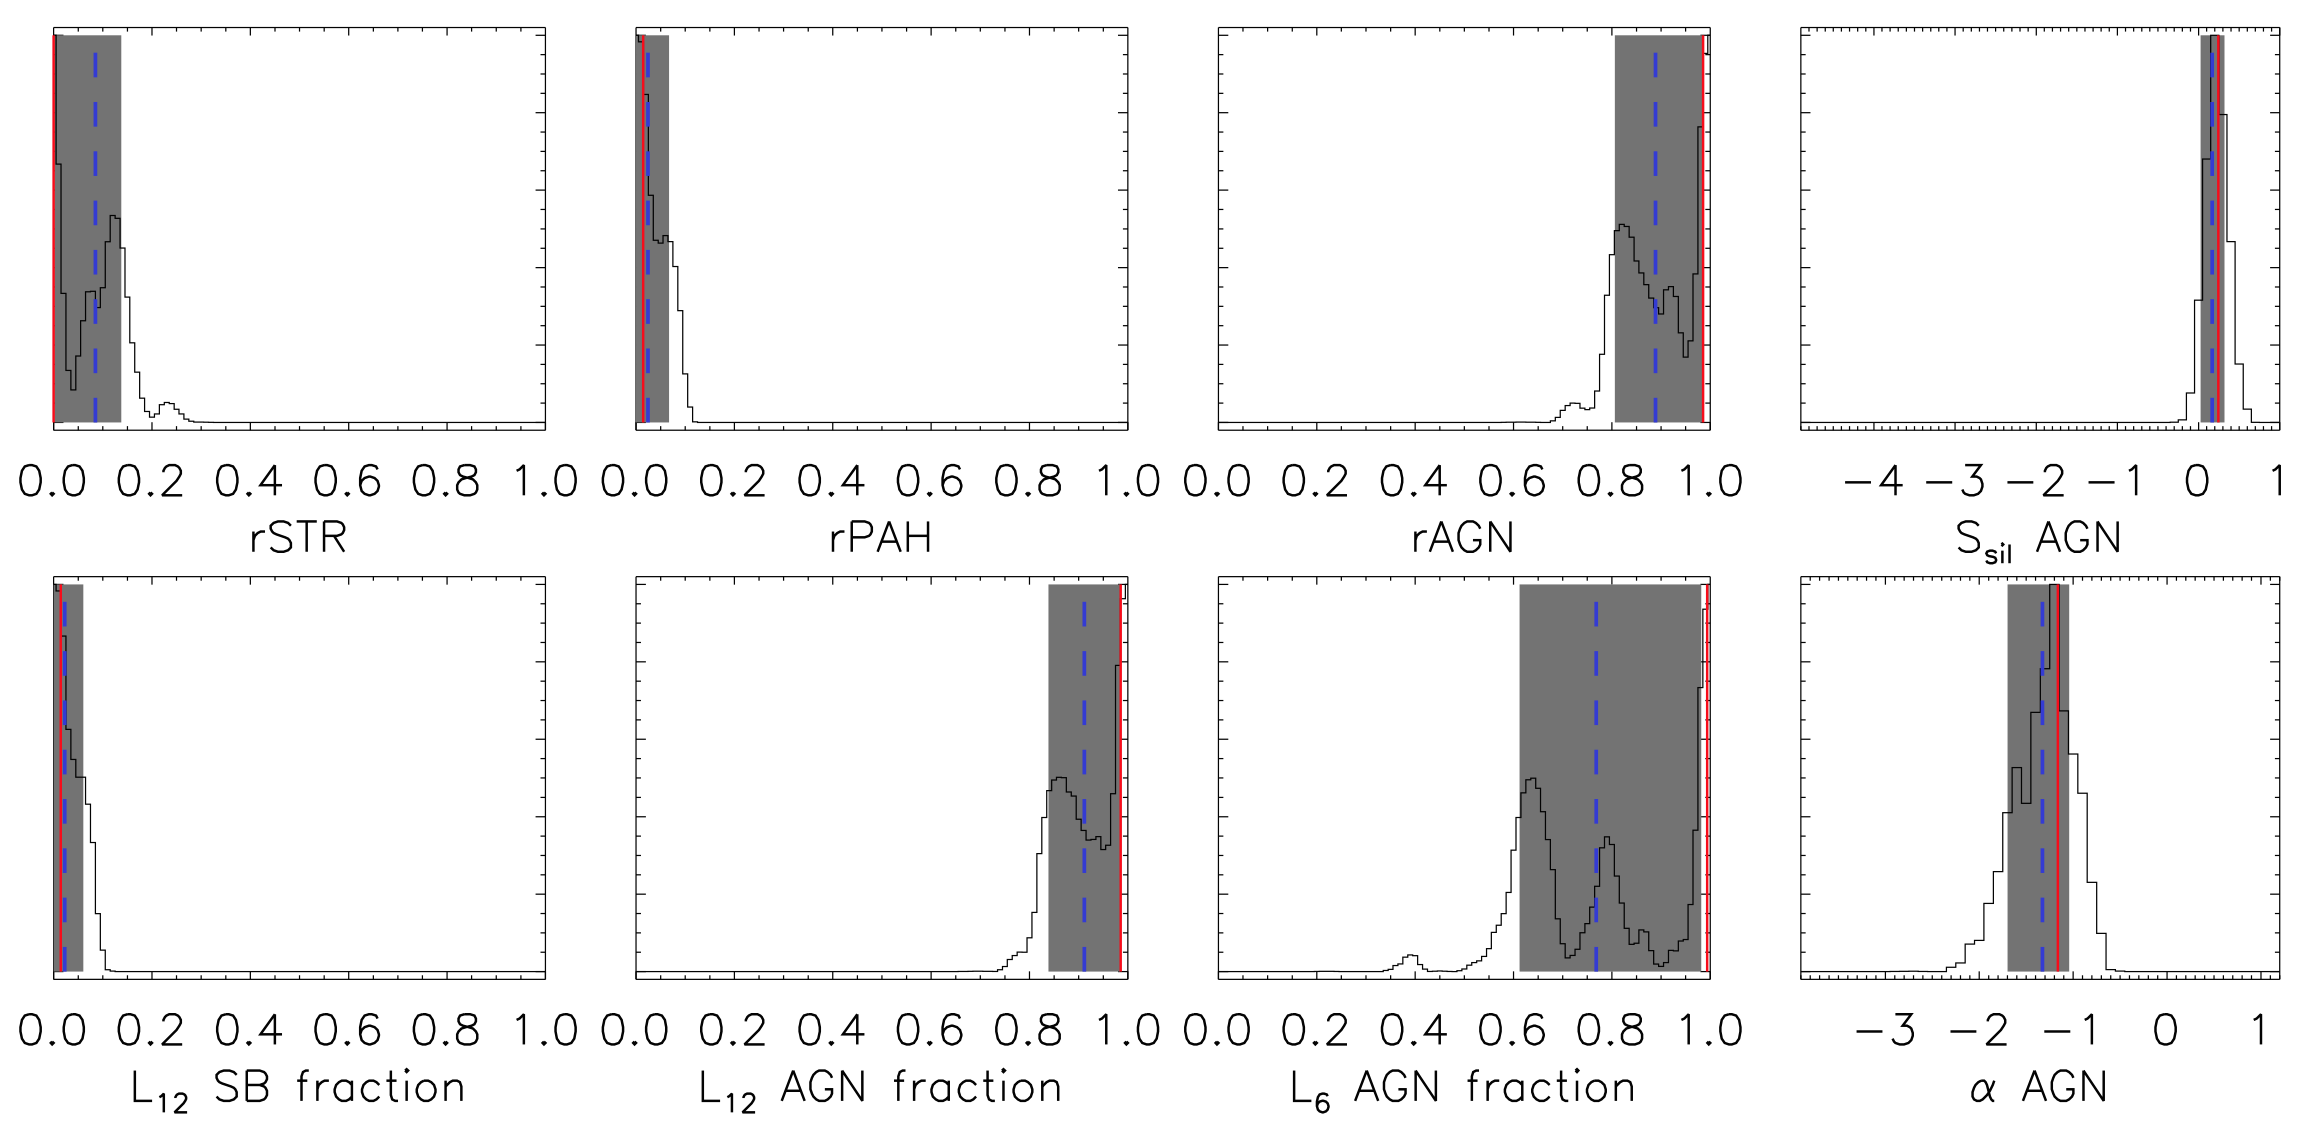
The spectral decomposition is done between and 15 m in the rest-frame. All spectra were re-sampled to a common wavelength resolution m. In Figures 5 and 6 we show the spectral decomposition of a QSO dominated by the AGN component (Mrk 478) and one with significant contributions by PAH and stellar components (PG 1211+143). Table 6 lists the results of the median and 68 per cent confidence intervals of the integrated MIR luminosity at m, and within the Spitzer/IRS slit, attributed to the three components, and the best templates used to decompose each QSO. Table 7 lists the AGN luminosity contribution at 12 and 6 m, the starburst luminosity contribution at 12 m, the MIR spectral index and the silicate strength . PG 0050+124 and PG 1351+640 were poorly fitted around the silicate feature, and hence we measure the feature on the spectra directly.
We cannot find a combination of templates to reproduce the spectrum of PG 1351+640 (see Figure in Appendix), probably because this object presents prominent silicate feature in emission. This object, together with PG 0050+124, PG 1211+143 and PG 0804+761, are among the first objects in which prominent emission of silicates at 10 and 18 m was observed (eg., Sturm et al., 2002; Hao et al., 2005; Dudik et al., 2007).
We find that within the Spitzer/IRS aperture of arcsec ( kpc), on average the starburst component contributes 15 per cent (3 per cent PAH and 12 per cent stellar) and the AGN component 85 per cent to the integrated luminosity of the system in the MIR. These results are consistent with the fact that the nuclear MIR emission reported in the present work is mostly dominated by the AGN (Section 5.1).
7 Dusty torus modeling
7.1 clumpy models
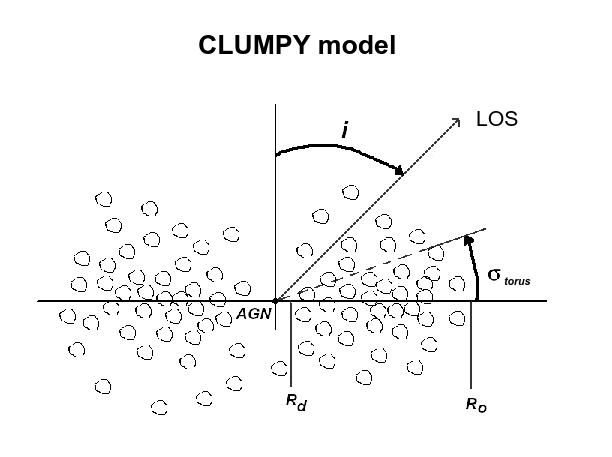
In this section we adopt the CLUMPY models of Nenkova et al. (2002, 2008a, 2008b) as a description of the distribution of clouds that form the dusty torus. Within this framework the distribution of clouds is described by a set of 6 free parameters (see Figure 7). The clouds that surround the central engine have the same optical depth, . The inner radius of the cloud distribution is defined by the dust sublimation temperature ( K for silicates), with (1500 K )erg s pc, while the radial extent is defined as the ratio between the outer () and inner radius (). The radial distribution of clouds is parameterized as , where is a free parameter. Additionally, there are other three free parameters that describe the geometry of the torus: the viewing angle , the angular size and the average number of clouds along a radial equatorial line , which can be used to calculate the number of clouds along the line of sight (LOS) as . According to this description the classification of an AGN as type 1 or type 2 does not depend only on the viewing angle but the probability that AGN photons be able to escape through the torus without being absorbed by an optical thick cloud along the LOS. This is called the escape probability of AGN-produced photons, . Therefore, it is possible to obtain a type 1 AGN even at viewing angles close to the equatorial plane (Nenkova et al., 2002, 2008a, 2008b).
The emission of CLUMPY clouds is the angle-averaged emission of all slab orientations. For the models we are using, corresponds to the optical depth along the normal of the slab. There is a new version of CLUMPY models777www.clumpy.org which uses spherical clouds with 3-dimensional radiative transfer.
In order to be able to compare our results with the previous modelling performed in lower luminosity AGN (e.g., Alonso-Herrero et al., 2011, 2016b; González-Martín et al., 2013, 2016; Ichikawa et al., 2015; Martínez-Paredes et al., 2015; Mateos et al., 2016; Ramos Almeida et al., 2011; Fuller et al., 2016; García-Burillo et al., 2016), we chose to use the 2008 CLUMPY models (Nenkova et al., 2002, 2008a, 2008b).
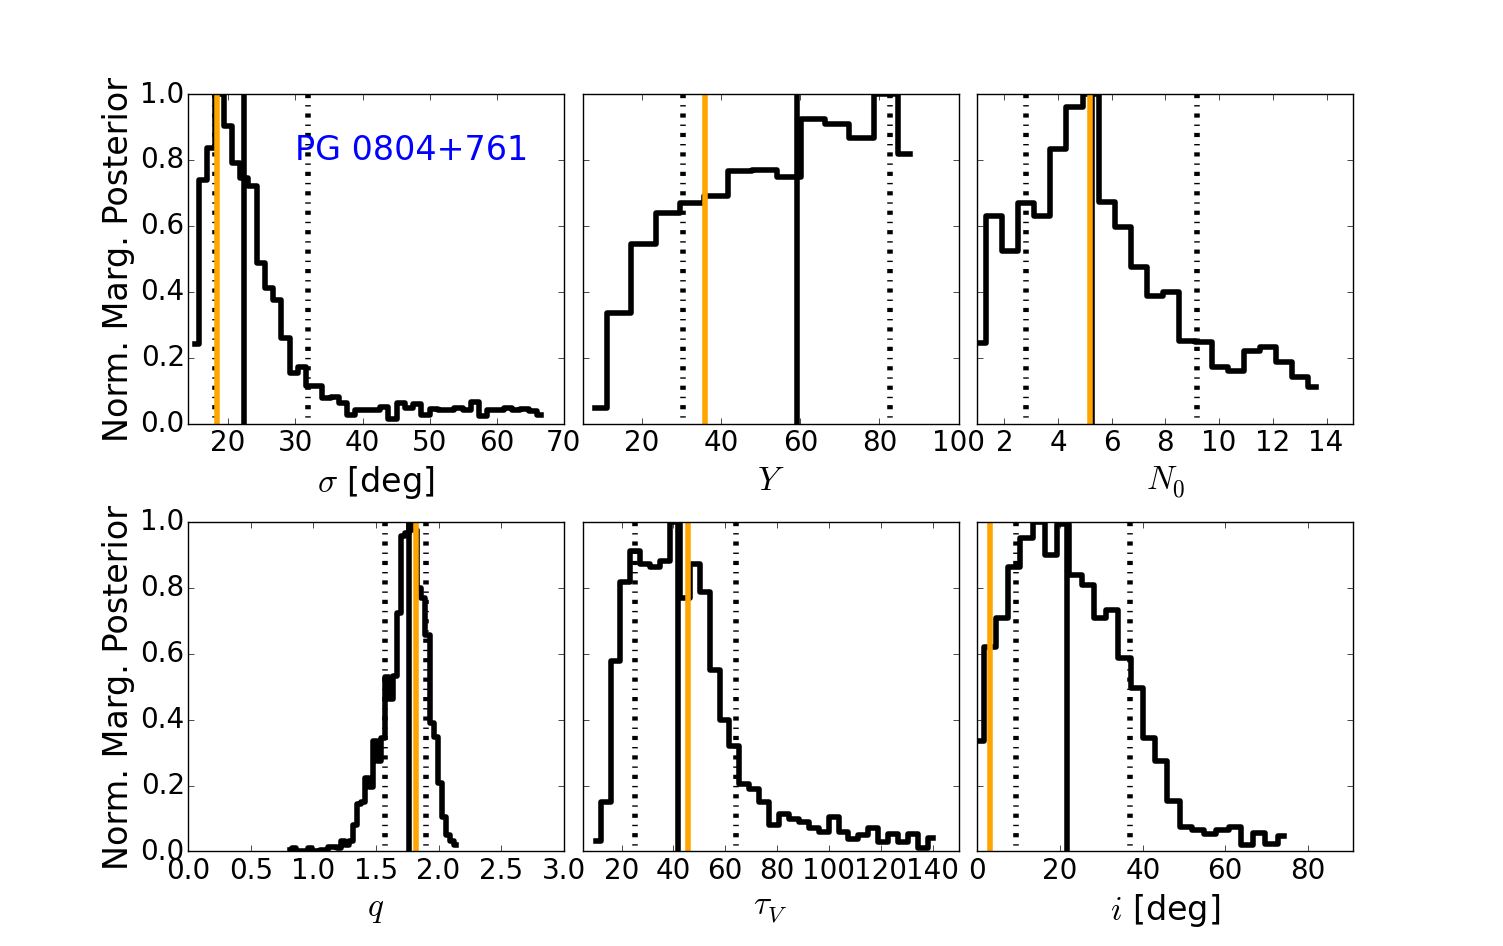
We model the QSOs with the BayesClumpy tool (Asensio Ramos & Ramos Almeida, 2009), which uses Bayesian inference to fit the observed nuclear IR SEDs and MIR spectroscopy of AGN. The output is the probability distribution of the six free parameters of the model (, , , , and ) assuming flat prior information. BayesClumpy allows to fix (or fit) the redshift and the vertical shift too, i.e. the flux scaling factor of the model spectrum. In addition, it is also possible to include foreground extinction, parameterized by , when we are modeling type 2 AGN (see Alonso-Herrero et al., 2011). For type 1 AGN it is possible to add the AGN (accretion disk) emission in the form of a power law contribution as described by Nenkova et al. (2002). The method uses a Metropolis-Hastings Markov Chain Monte Carlo (MCMC) sampling technique to determine the posterior distributions of the free clumpy torus model parameters. These are used in turn to calculate the escape probability distribution () and the distribution of the geometrical covering factor, (e.g., Alonso-Herrero et al., 2011). For more details on BayesClumpy see Ramos Almeida et al. (2014a).
| Parameter | ||||||
|---|---|---|---|---|---|---|
| (deg) | (deg) | |||||
| Range |
In order to fit the models, we start by using the unresolved NIR and MIR starburst-subtracted spectrum between m for all QSOs except PG 1211+143, PG 1351+640, PG 1501+106, and PG 0050+124. The MIR emission of these three QSOs appears to be completely dominated by dust heated by the AGN (see Section 6), with negligible starburst contributions. In these cases we use the IRS spectrum (observed wavelength between m) extracted from the database. For three QSOs (PG 0050+124, PG 1211+143, and PG 1501+106) the spectral range between m was excluded (as discussed in Section 7.2 and 8.2).
In the case of PG 0050+124 the flux density of the unresolved component at m is fainter than the corresponding flux density of the spectrum (see Section 5.2 and Figure in Appendix), suggesting the presence of an extended component in the spectrum larger than the expected uncertainties in flux calibration. Hence we scale the Spitzer/IRS spectrum to the m photometry data point. For this QSO we use the spectral range between m, where the emission is strongly dominated by the dusty torus. For MR 2251-178 we used the GTC/CC spectrum.
We remove the emission lines ( [S IV] 10.4 m, [Ne II] 12.81 m, [Ne V] 14.32 m and [Ne III] 15.56 m) from the spectra before fitting the models, since the emission lines are not modeled. We adopt non-informative priors as flat distributions within the range of values shown in Table 8 for the six free parameters, and vertical shift values between and 4. For all QSOs we include the direct-light power-law AGN component and do not include a screen of extinction.
| Name | ||||||||||||||
|---|---|---|---|---|---|---|---|---|---|---|---|---|---|---|
| Median | MAP | Median | MAP | Median | MAP | Median | MAP | Median | MAP | Median | MAP | |||
| (deg.) | (deg.) | (deg.) | (deg.) | (median) | (MAP) | |||||||||
| PG 0003+199 | 43 | 82 | 3 | 2. | 1.9 | 67 | 65 | 2.15 | 0.12 | |||||
| PG 0007+106 | 24 | 79 | 3 | 2. | 2.1 | 53 | 80 | 0.15 | 0.09 | |||||
| PG 0050+124 | 15 | 58 | 3 | 1.5 | 1.5 | 54 | 80 | 1.37 | 1.25 | |||||
| PG 0804+761 | 18 | 36 | 5 | 1. | 1.8 | 46 | 3 | 1.37 | 0.03 | |||||
| PG 0844+349 | 15 | 96 | 1 | 1. | 1.3 | 66 | 90 | 0.31 | 0.21 | |||||
| PG 0923+129 | 36 | 79 | 13 | 2. | 2 | 117 | 1 | 1.60 | 0.30 | |||||
| PG 1211+143 | 36 | 39 | 2 | 1.4 | 1.4 | 37 | 88 | 1.27 | 1.24 | |||||
| PG 1229+204 | 15 | 64 | 14 | 0.5 | 0.5 | 14 | 75 | 0.94 | 0.33 | |||||
| PG 1351+640 | 15 | 35 | 9 | 0. | 0.01 | 28 | 51 | 2.13 | 1.77 | |||||
| PG 1411+442 | 15 | 74 | 3 | 2. | 2.5 | 73 | 90 | 0.06 | 0.06 | |||||
| PG 1426+015 | 19 | 50 | 6 | 2. | 2.7 | 125 | 88 | 0.80 | 0.62 | |||||
| PG 1440+356 | 15 | 60 | 3 | 2. | 2.9 | 76 | 90 | 0.08 | 0.06 | |||||
| PG 1448+273 | 24 | 60 | 15 | 1. | 1.5 | 73 | 1 | 0.35 | 0.17 | |||||
| PG 1501+106 | 52 | 21 | 8 | 2. | 2.4 | 110 | 56 | 0.42 | 0.36 | |||||
| PG 1534+580 | 18 | 6 | 80 | 15 | 1. | 1.5 | 69 | 2 | 1.54 | 0.35 | ||||
| PG 1535+547 | 24 | 30 | 3 | 2. | 2.3 | 66 | 79 | 0.19 | 0.06 | |||||
| PG 2130+199 | 16 | 94 | 4 | 2. | 1.8 | 46 | 88 | 0.07 | 0.04 | |||||
| PG 2214+139 | 29 | 45 | 2 | 2. | 2.1 | 50 | 85 | 2.67 | 0.19 | |||||
| Mrk 509 | 61 | 85 | 2 | 1. | 1.2 | 58 | 60 | 2.73 | 0.18 | |||||
| MR 2251-178 | 36 | 67 | 10 | 1. | 0.7 | 70 | 1 | 0.94 | 0.63 | |||||
7.2 Results for individual QSOs
From fitting the unresolved NIR emission and MIR AGN spectrum we note that for the majority of QSOs (12) the spectral range between cannot be reproduced by the clumpy models with a set of parameters consistent with a type 1 AGN. In fact, the inclusion of this range results in a poor fit of the silicate features at 9.7 m. To reproduce this emission, previous works have included, apart from the torus emission, a hot dust component (e.g., Mor et al., 2009; Deo et al., 2011; Mor & Trakhtenbrot, 2011; Mor & Netzer, 2012).
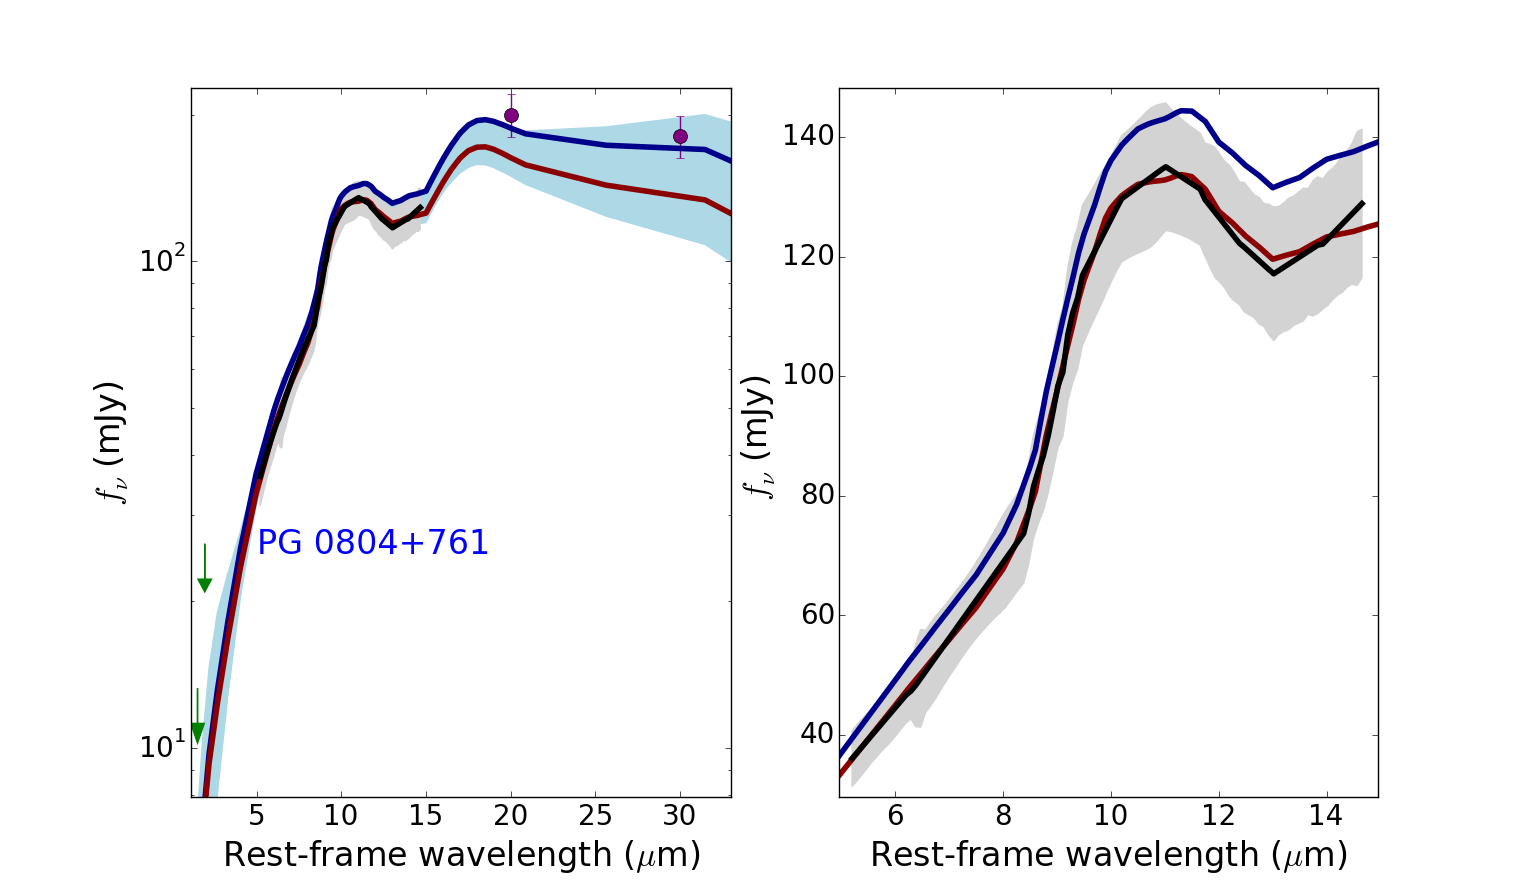
However, for the 20 QSOs in the sample the spectra are well reproduced by clumpy models when we fit in the m range (see Figure 7 for an example and Appendix for the rest of the sample). For four objects (PG 2214+139, PG 0050+124, PG 1440+356 and, PG 1411+442) a comparison of this new fitting with the spectra still shows an excess of NIR unresolved emission in the 5 to 8 m range.
The posterior probability distributions of the clumpy torus model parameters are well constrained for all QSOs except for MR 2251-178, which was modeled with the narrower wavelength range spectrum of GTC/CC. In Table 9 we list the median, uncertainty and the maximum-a-posterior (MAP) values of the parameters derived from the SED modeling. In this table we also list the reduced estimated from fitting both the median and MAP models with the MIR starburst-substrated spectrum.
We find that 50 per cent of QSOs have viewing angles between 50 and 88 degrees, while the other 50 per cent has viewing angles that range from 17 to 47 degrees. A similar analysis on Seyfert 1 galaxies found viewing angles between 50 and 60 degrees with escape probabilities larger than 16 per cent (see e.g., Alonso-Herrero et al., 2011). Nevertheless, in order to better constrain the viewing angle of QSOs, we would need at least two NIR photometry points (Ramos Almeida et al., 2014a).
In Table 10 we list , and the AGN bolometric luminosity derived from the clumpy modeling, and we also include the bolometric luminosity estimated from hard X-rays (2-10 keV), using bolometric corrections of Runnoe et al. (2012), for comparison.
| Name | clumpy | Obs. | ||
|---|---|---|---|---|
| (per cent) | ( erg s-1) | ( erg s-1) | ||
| PG 0003+199 | ||||
| PG 0007+106 | ||||
| PG 0050+124 | ||||
| PG 0804+761 | ||||
| PG 0844+349 | ||||
| PG 0923+129 | ||||
| PG 1211+143 | ||||
| PG 1229+204 | ||||
| PG 1351+640 | ||||
| PG 1411+442 | ||||
| PG 1426+015 | ||||
| PG 1440+356 | ||||
| PG 1448+273 | ||||
| PG 1501+106 | ||||
| PG 1534+580 | ||||
| PG 1535+547 | ||||
| PG 2130+099 | ||||
| PG 2214+139 | ||||
| MR 2251-178 | ||||
| Mrk 509 |
We find that Mrk 509 has an index of the radial density profile () and number of clouds along the equatorial ray () consistent with those previously obtained by Hönig et al. (2010), and respectively, using the clumpy torus models and an extra contribution of hot dust in the inner region of the torus (Hönig & Kishimoto, 2010). We note, however, that they did not fit their MIR spectra but rather compared with a subset of models deemed to be appropriate for Seyfert 1 galaxies.
PG 1211+143 was also previously modeled by Nikutta et al. (2009) with the clumpy models. Three of the torus parameters (, e ) are consistent within the uncertainties with our results, while we find a different index of the radial density distribution and larger optical depths ( and ). These differences probably arise because they fixed the radial extent to while we allowed this parameter to vary freely.
As a sanity check, we also performed the fits for individual QSOs with the new CLUMPY models that use 3-D radiative transfer on spherical clouds, available in their web page, and found that the parameters are the same as with the 2008 models within the derived 1sigma uncertainties.
8 Discussion
8.1 Global torus properties of QSOs
| AGN | (deg.) | (deg.) | (per cent) | |||||
|---|---|---|---|---|---|---|---|---|
| QSO | ||||||||
| Seyfert 1 | ||||||||
| Seyfert 2 |
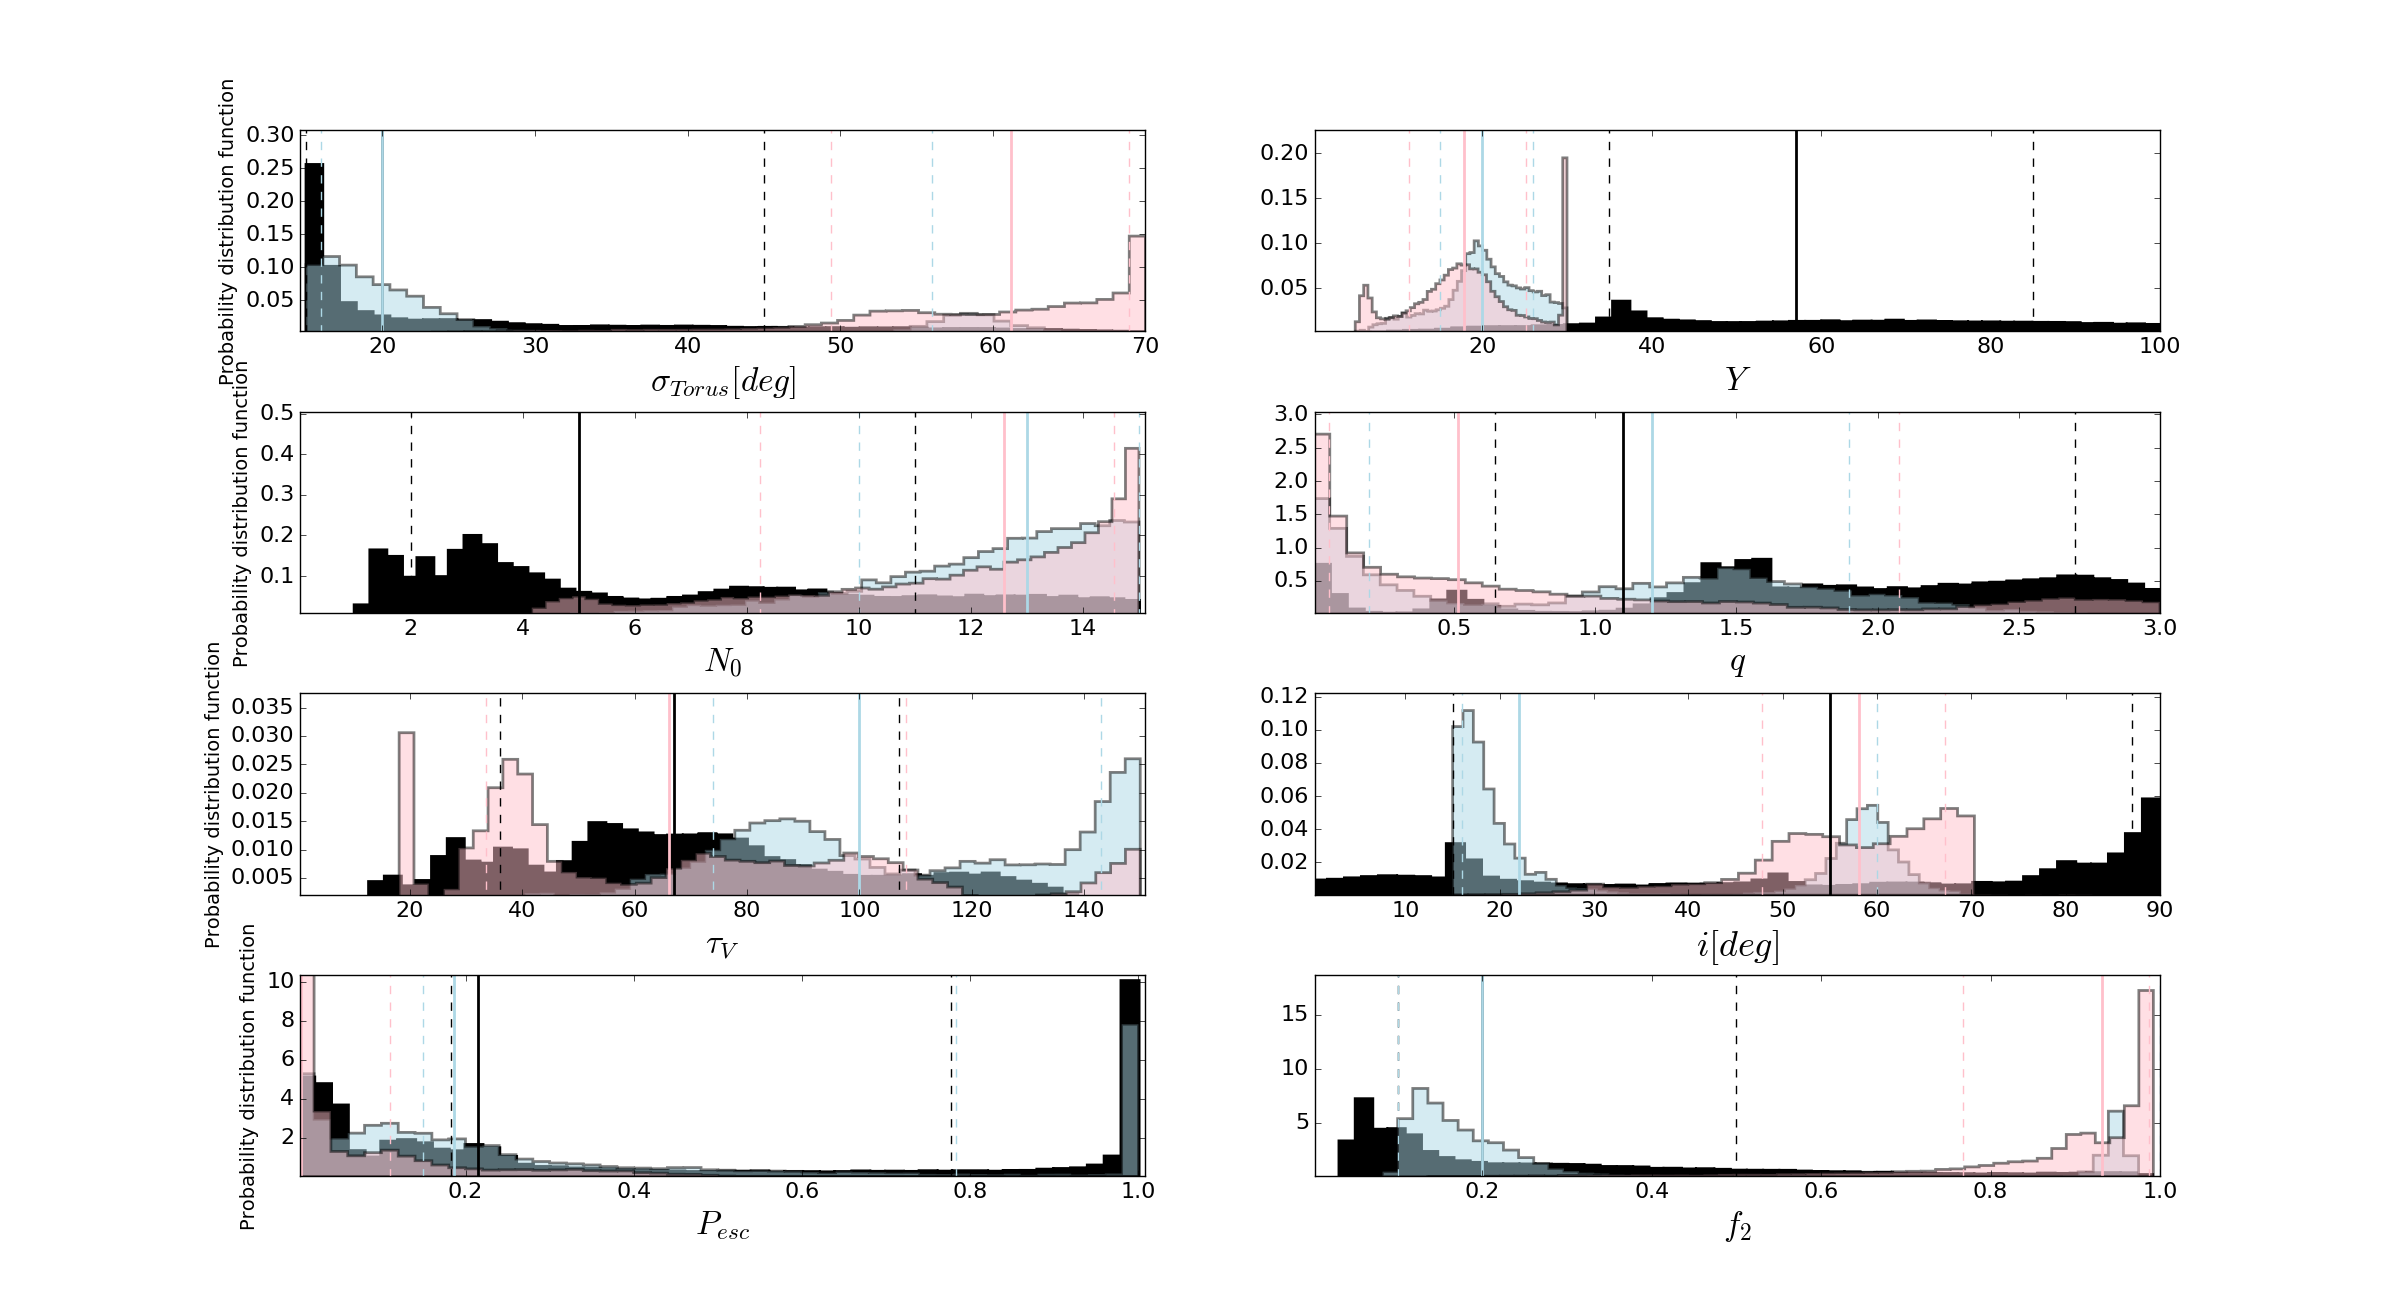
In order to study the QSO sample as a whole, we build global probability distributions for each parameter by bootstrapping on the parameters returned by the MCMC procedure for each QSO 10,000 times, and creating a parent distribution of 19 QSOs 10,000 values to derive the distributions. We exclude MR 2251-178 from the global analysis since the posterior distributions of its parameters are less constrained due to the narrower spectral range used in the analysis. We build the global probability distributions for type 1 and 2 Seyfert nuclei in the same manner, using the individual arrays of values obtained in the analysis published by Ichikawa et al. (2015) (A. Asensio-Ramos, private communication). In Figure 10 we show the global probability distributions of QSOs, type 1 and 2 Seyferts. The median values of the distributions and their 68 per cent confidence intervals are listed in Table 11.
We observe that the global probability distributions cover a wide range of values. In particular, the escape probability for QSOs, which depends on the number of clouds along the LOS (), the viewing angle () and the angular width (), shows a peak below 0.1 (5 objects with per cent), a secondary peak around 0.2 (7 QSOs with per cent), and a peak above 0.7 (7 QSOs with per cent). Nevertheless, better constrains on the viewing angle () could result in better constrains on the escape probability distribution. The geometrical covering factor, which is independent of the viewing angle, however, is well constrained towards low values (median of ). Therefore, QSOs display a wide range of global clumpy model properties (, , and ) in combinations such that and allow for enough AGN-produced photons to escape the dusty structure and the broad lines to be seen in direct light, resulting in a type 1 QSO.
A qualitative comparison of the clumpy model parameters for QSOs with those of Seyfert 1 and 2s shows that the distribution of number of clouds is skewed in QSOs towards lower values than in Seyfert galaxies, and they are more concentrated towards the inner regions of the torus (larger values). The optical thickness of the clouds () is lower than in Seyfert 1s and comparable to Seyfert 2s. The values of in QSOs and Seyfert 1s, however, are more similar, albeit with different parent distributions. The parameter peaks at lower values in Seyfert galaxies than in QSOs, although it is not possible to strictly compare the distributions since Ichikawa et al. (2015) constrain its range between 0 and 30, while we allowed it to vary between 0 to 100, and indeed, we note that the global distribution of for Seyfert 1s is truncated at 30. The viewing angle is larger in QSOs than in Seyfert 1s, but the median values of and are similar in QSOs and Seyfert 1s.
To quantitatively compare the probability distributions of the parameters, we use the two-sample Kolmogorov-Smirnov (KS) test to determine the probability of rejecting the null hypothesis that two samples are drawn from the same parent population. For all free parameters (, , , , , ) of Seyfert 1 and 2 the null hypothesis can be rejected with a negligible probability (). Likewise and have statistically different parent distributions, and the null hypothesis can again be reject with . These probabilities are so small due, in part, to the large number of samples in the global distributions that map the posterior probability distributions of individual AGN, but caution is drawn to the fact that the distributions have been derived from only 10-20 objects for QSOs and Seyfert 2, and four for Seyfert 1.
Additionally, we use the Mann-Whitney (MW, Stuart & Ord, 1994) test to statistically measure the similitude between the medians of distributions. Although for QSOs and Seyfert 1s the medians look similar in , and parameters, they are statistically distinct (), and QSOs do have a tendency for larger escape probabilities and lower covering factors than Seyfert 1 nuclei.
These results are consistent with fundamental geometrical differences between high luminosity type 1 AGN (QSOs) and their lower luminosity counterparts (Seyfert 1s), and between those type 2 AGN.
The low number of clouds along the equatorial ray (), large index of the radial distribution (), and lower optical thickness (), suggest that the clouds in the tori of QSOs might have been partially evaporated and piled away by the high radiation field of the QSOs, as proposed by the receding torus scenario (Lawrence et al., 1991).
8.2 Dependence of AGN covering factor on AGN luminosity
Several works (e.g., Hasinger, 2008; Ueda et al., 2003; La Franca et al., 2005; Gilli et al., 2007; Fiore et al., 2008) have found that the fraction of type 2 AGN decreases with increasing AGN luminosity, and this result can be interpreted as giving support to a model in which the torus recedes due to the higher intensity radiation field (Lawrence et al., 1991). However, these works have used the fraction of absorbed AGN from X-ray or optical broad lines, which could be affected by absorption along the LOS due to dust in the host galaxy or dust-free ionaized gas (see Rowan-Robinson et al., 2009, and references therein).
Using a large X-ray and IR selected sample of AGN Rowan-Robinson et al. (2009) studied the X-ray-infrared correlation. They found that their data is well reproduced by a model in which the median covering factor decreases from high () to moderate () X-ray luminosities and then increases towards low luminosities ().
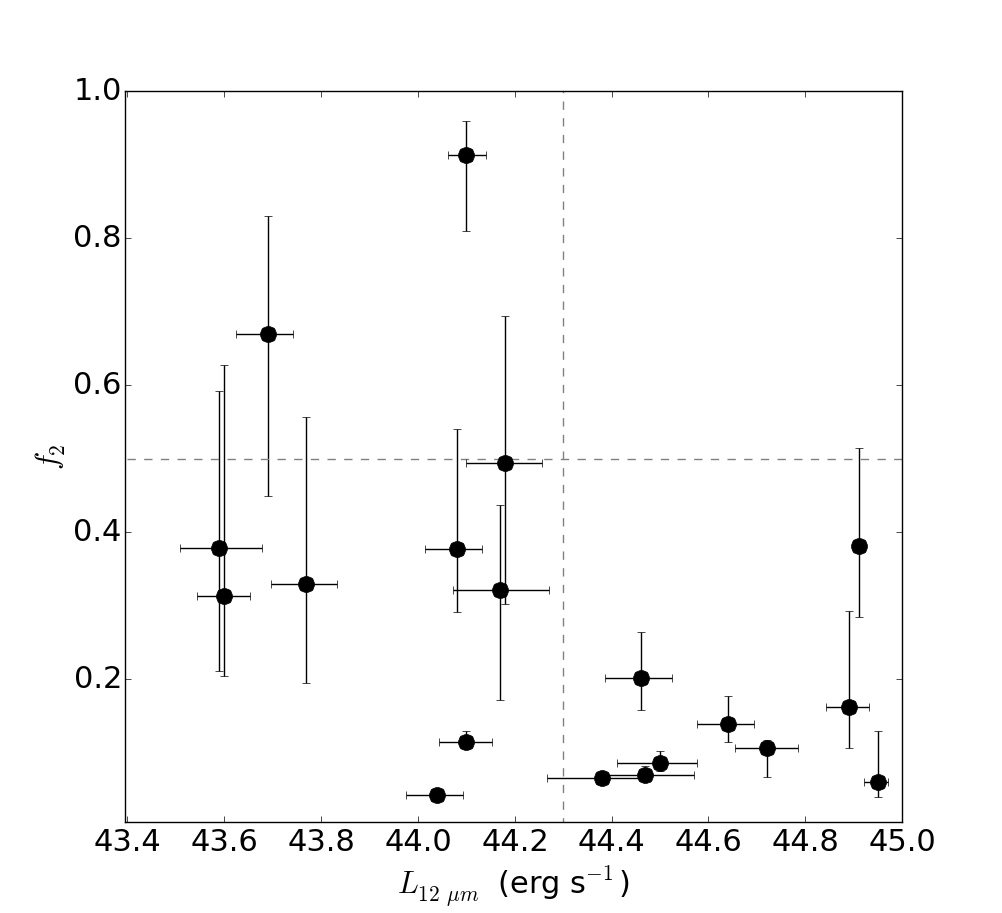
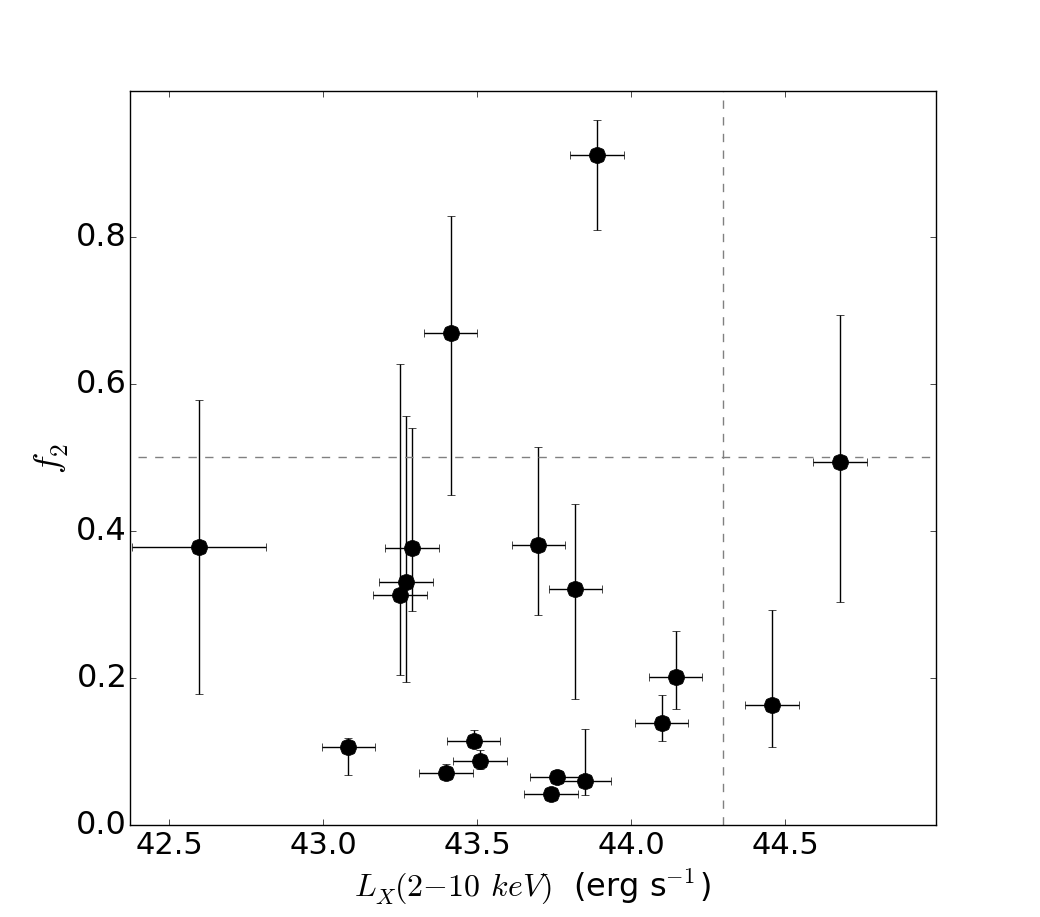
In our sample, we find that objects with lower () IR and X-ray luminosity have a wide range of covering factors, reaching up to the highest values (Figures 11 and 12). These 12m luminosities are hence dominated by the dusty torus emission. In particular, we note that PG 1501+106, the QSO with the highest value, is among the objects with low IR and X-ray emission. The high luminosity and high covering factor region of this relationship, and , is devoid of QSOs. Although only 20 objects have been included in this comparison, the absence of QSOs in this region is significant. If both quantities were to be completely unrelated, we would expect a scatter plot covering all values, with a mean of 7.6 objects falling in the and region in the case of vs relationship. The probability of finding in a sample 0 objects when 7.6 are expected is per cent, assuming a Poisson distribution. Hence the highest-luminosity AGN have a high tendency to have cleaner line of sights. We note that the two QSOs with (PG 0923+129 and PG 1501+106) are 1.2 and 1.5 type objects. The median covering factor of QSOs is and this value is consistent, within the uncertainties, with the 35-40 per cent derived by Rowan-Robinson et al. (2008, 2009) for a sample of QSOs with in the range of 42.5 to 44.5 erg s-1.
Recently, (Mateos et al., 2016) used a large sample of AGN from the Bright Ultra-hard XMM-Newton Survey that includes type 1s, type 2s and intermediate AGN. The torus emission of this sample was modeled using the CLUMPY models of (Nenkova et al., 2008a, b). All free parameters were allowed to vary within the same range as we used for our sample of QSOs, except the radial extend (), that was constrained a priori between 5 and 30. They found that type 2 AGN present on average higher () geometrical covering factors than type 1 AGN (), but they also found that per cent of type 1 AGN have covering factors larger than 0.5 and that the per cent of type 2 AGN have covering factors lower than 0.5. These results are consistent with ours, since most QSOs in our sample have covering factors .
8.3 Excess NIR and MIR emission: starburst, hot dust or accretion disk?
Since clumpy models only take into account the emission of the dusty torus we have done our best to exclude any extended NIR and MIR emission. However, in section 6 we found that for some QSOs the unresolved NIR emission is not well reproduced by clumpy models. Among them, PG 1440+356 has the most prominent PAH emission, observed in both Spitzer/IRS and GTC/CC spectra (see Figure in Appendix), and PG 0050+124 presents clear extended emission at NIR (Surace & Sanders, 1999) and MIR wavelengths (Burtscher et al., 2013, and this work, see Figure in Appendix). Therefore, it is likely that in these objects the extended NIR emission has not been properly accounted to estimate the unresolved emission, or it could also be hot dust associated with the NLR (Hönig et al., 2010; Mor et al., 2009; Hernán-Caballero et al., 2016; Mateos et al., 2016). Similar results have been reported in the modeling of the unresolved NIR SED of some Seyfert 1s (e.g., Alonso-Herrero et al., 2011; Ichikawa et al., 2015) suggesting that in type 1 AGN it is more difficult to constrain the emission from dust heated by the AGN. Another possible explanation is that a power law is not adequate to represent the intrinsic AGN emission in the NIR (Mateos et al., 2016; Hernán-Caballero et al., 2016).
9 Conclusions
The MIR imaging of our sample of 20 nearby QSOs reveal that the majority of them are unresolved at arcsec resolution, corresponding to physical scales of pc. We compare the Spitzer/IRS and the ground-based high-angular resolution spectra and find that the spectral shapes are similar, and hence adopt the former to characterise the AGN component. We find that on average the AGN contributes 85 per cent of the total MIR emission within the Spitzer/IRS apertures, while the rest can be attributed to starburst emission. These results indicate that at MIR wavelengths the QSO emission is largely dominated by dust heated by the AGN.
We use the unresolved NIR emission and the starburst-subtracted MIR spectra to constrain the physical and geometrical parameters of clumpy dusty torus models. Using Bayesian inference we derive the posterior probability distributions of the six free parameters of the clumpy models and build the global probability distributions of the parameters for the QSO sample. We find that for most QSOs clumpy models reproduce well the AGN emission without the inclusion of a hot dust component, as proposed in the literature.
A statistical analysis reveals that the properties of the dusty torus are intrinsically different from those of Seyfert 1 and Seyfert 2 nuclei (e.g, Ramos Almeida et al., 2011; Ichikawa et al., 2015). Nevertheless, in QSOs the combination of the width of torus, number of clouds and inclination , and results in escape probabilities per cent and covering factors , which are consistent with the optical classification of QSOs as type 1 AGN. Higher luminosity QSOs have the lowest covering factor . We conclude that the lower number of clouds, steeper radial distribution and less optically thick clouds in QSOs can be interpreted as dusty structures that have been partly evaporated and piled up by the higher intensity radiation field in QSOs, as proposed by a receding torus scenario.
Acknowledgements
We thank the referee of this article for insightful comments that allowed us to improve the manuscript. This work has been partly supported by Mexican CONACyT grant CB-2011-01-167291. MM-P acknowledges support by the CONACyT PhD fellowship program and UNAM-DGAPA postdoctoral fellowship. OG-M acknowledges support by the PAPIIT IA100516 grant. AA-H acknowledges financial support from the Spanish Ministry of Economy and Competitiveness through the Plan Nacional de Astronomía y Astrofísica through grant AYA2015-64346-C2-1-P and from CSIC/PIE grant 201650E036. CRA acknowledges the Ram n y Cajal Program of the Spanish Ministry of Economy and Competitiveness through project RYC-2014-15779. KI acknowledges support by JSPS fellowship for young researchers (PD). This work is based on observations made with the 10.4m GTC located in the Spanish Observatorio del Roque de Los Muchachos of the Instituto de Astrofísica de Canarias, in the island La Palma. It is also based partly on observations obtained with the Spitzer Space Observatory, which is operated by JPL, Caltech, under NASA contract 1407. This research has made use of the NASA/IPAC Extragalactic Database (NED) which is operated by JPL, Caltech, under contract with the National Aeronautics and Space Administration. CASSIS is a product of the Infrared Science Center at Cornell University, supported by NASA and JPL.
References
- Alonso-Herrero (1997) Alonso-Herrero, A. 1997, PASP, 109, 69
- Alonso-Herrero et al. (2011) Alonso-Herrero, A., Ramos Almeida, C., Mason, R., et al., 2011, ApJ, 736, 82
- Alonso-Herrero et al. (2016a) Alonso-Herrero, A., Esquej, P., Roche, P. F., et al. 2016, MNRAS, 455, 563
- Alonso-Herrero et al. (2016b) Alonso-Herrero, A., Poulton, R., Roche, P. F., et al. 2016, MNRAS, 463, 2405
- Antonucci & Miller (1985) Antonucci, R. R. J., & Miller, J. S., 1985, ApJ, 297, 621
- Antonucci (1993) Antonucci, R., 1993, ARA&A, 31, 473
- Asensio Ramos & Ramos Almeida (2009) Asensio Ramos, A., & Ramos Almeida, C., 2009, ApJ, 696, 2075
- Barvainis et al. (1996) Barvainis, R., Lonsdale, C., & Antonucci, R. 1996, AJ, 111, 1431
- Bianchi et al. (2009) Bianchi, S., Bonilla, N. F., Guainazzi, M., Matt, G., & Ponti, G. 2009, A&A, 501, 915
- Bicay et al. (1995) Bicay, M. D., Kojoian, G., Seal, J., Dickinson, D. F., & Malkan, M. A. 1995, ApJS, 98, 369
- Burtscher et al. (2013) Burtscher, L., Meisenheimer, K., Tristram, K. R. W., et al., 2013, A&A, 558, AA149
- Cohen (1999) Cohen, J. G., 1999, AJ, 117, 2428
- Capetti et al. (1995) Capetti, A., Axon, D. J., Macchetto, F., Sparks, W. B., & Boksenberg, A. 1995, ApJ, 446, 155
- Courvoisier (1998) Courvoisier, T. J.-L., 1998, A&ARv, 9, 1
- Deo et al. (2011) Deo, R. P., Richards, G. T., Nikutta, R., et al. 2011, ApJ, 729, 108
- Dudik et al. (2007) Dudik, R. P., Weingartner, J. C., Satyapal, S., et al. 2007, ApJ, 664, 71
- Edelson (1987) Edelson, R. A. 1987, AJ, 94, 1150
- Efstathiou & Rowan-Robinson (1995) Efstathiou, A., & Rowan-Robinson, M., 1995, MNRAS, 273, 649
- Falcke et al. (1998) Falcke, H., Wilson, A. S., & Simpson, C., 1998, ApJ, 502, 199
- Feltre et al. (2012) Feltre, A., Hatziminaoglou, E., Fritz, J., & Franceschini, A. 2012, MNRAS, 426, 120
- Fiore et al. (2008) Fiore, F., Grazian, A., Santini, P., et al. 2008, ApJ, 672, 94-101
- Fischer et al. (2006) Fischer, S., Iserlohe, C., Zuther, J., et al. 2006, A&A, 452, 827F
- Fuller et al. (2016) Fuller, L., Lopez-Rodriguez, E., Packham, C., et al. 2016, MNRAS, 462, 2618
- Gallo (2006) Gallo, L. C. 2006, MNRAS, 368, 479
- Gandhi et al. (2009) Gandhi, P., Horst, H., Smette, A., et al., 2009, A&A, 502, 457
- García-Burillo et al. (2016) 2016ApJ…823L..12G García-Burillo, S., Combes, F., Ramos Almeida, C., et al. 2016, ApJ, 823, L12
- Gilli et al. (2007) Gilli, R., Comastri, A., & Hasinger, G. 2007, A&A, 463, 79
- González-Martín et al. (2013) González-Martín, O., Rodríguez-Espinosa, J. M., Díaz-Santos, T., et al. 2013, A&A, 553, AA35
- González-Martín et al. (2015) González-Martín, O., Masegosa, J., Márquez, I., et al. 2015, A&A, 578, A74
- González-Martín et al. (2016) González-Martín, O., et al., In prep
- Granato & Danese (1994) Granato, G. L., & Danese, L., 1994, MNRAS, 268, 235
- Green et al. (1986) Green, R. F., Schmidt, M., & Liebert, J. 1986, ApJS, 61, 305
- Guyon et al. (2006) Guyon, O., Sanders, D. B., Stockton, A. 2006, ApJS, 166, 89
- Hao et al. (2005) Hao, L., Spoon, H. W. W., Sloan, G. C., et al. 2005, ApJ, 625, L75
- Hasinger (2008) Hasinger, G. 2008, A&A, 490, 905
- Hernán-Caballero & Hatziminaoglou (2011) Hernán-Caballero, A., & Hatziminaoglou, E. 2011, MNRAS, 414, 500
- Hernán-Caballero et al. (2016) Hernán-Caballero, A., Hatziminaoglou, E., Alonso-Herrero, A., & Mateos, S. 2016, MNRAS, 463, 2064
- Hernán-Caballero et al. (2015) Hernán-Caballero, A., Alonso-Herrero, A., Hatziminaoglou, E., et al. 2015, ApJ, 803, 109
- Hönig et al. (2010) Hönig, S. F., Kishimoto, M., Gandhi, P., et al., 2010, A&A, 515, AA23
- Hönig & Kishimoto (2010) Hönig, S. F., & Kishimoto, M. 2010, A&A, 523, A27
- Horst et al. (2006) Horst, H., Smette, A., Gandhi, P., & Duschl, W. J. 2006, A&A, 457, L17
- Horst et al. (2008) Horst, H., Gandhi, P., Smette, A., & Duschl, W. J. 2008, A&A, 479, 389
- Ichikawa et al. (2012) Ichikawa, K., Ueda, Y., Terashima, Y., et al. 2012, ApJ, 754, 45
- Ichikawa et al. (2015) Ichikawa, K., Packham, C., Ramos Almeida, C., et al. 2015, ApJ, 803, 57
- Ichikawa et al. (2017) Ichikawa, K., Ricci, C., Ueda, Y., et al. 2017, ApJ, 835, 74
- Jaffe et al. (2004) Jaffe, W., Meisenheimer, K., Röttgering, H., Leinert, C., & Richichi, A., 2004, The Interplay Among Black Holes, Stars and ISM in Galactic Nuclei, 222, 37
- Kellermann et al. (1994) Kellermann, K. I., Sramek, R. A., Schmidt, M., Green, R. F., & Shaffer, D. B. 1994, AJ, 108, 1163
- Krabbe et al. (2001) Krabbe, A., Böker, T., & Maiolino, R. 2001, ApJ, 557, 62
- Krolik & Begelman (1988) Krolik, J. H., & Begelman, M. C. 1988, ApJ, 329, 702
- La Franca et al. (2005) La Franca, F., Fiore, F., Comastri, A., et al. 2005, ApJ, 635, 864
- Laurent-Muehleisen et al. (1997) Laurent-Muehleisen, S. A., Kollgaard, R. I., Ryan, P. J., et al. 1997, A&AS, 122
- Lawrence et al. (1991) Lawrence, A., Rowan-Robinson, M., Efstathiou, A., et al. 1991, MNRAS, 248, 91
- Lebouteiller et al. (2011) Lebouteiller, V., Barry, D. J., Spoon, H. W. W., et al., 2011, ApJS, 196, 8
- Levenson et al. (2007) Levenson, N. A., Sirocky, M. M., Hao, L., et al., 2007, ApJ, 654, L45
- Levenson et al. (2009) Levenson, N. A., Radomski, J. T., Packham, C., et al. 2009, ApJ, 703, 390
- Lutz et al. (2004) Lutz, D., Maiolino, R., Spoon, H. W. W., & Moorwood, A. F. M. 2004, A&A, 418, 465
- Martínez-Paredes et al. (2015) Martínez-Paredes, M., Alonso-Herrero, A., Aretxaga, I., et al. 2015, MNRAS, 454, 3577
- Mason et al. (2006) Mason , R. E., Geballe, T. R., Packham, C., et al. 2006, ApJ, 640, 612
- Mason et al. (2012) Mason, R. E., Lopez-Rodriguez, E., Packham, C., et al., 2012, AJ, 144, 11
- Mateos et al. (2016) Mateos, S., Carrera, F. J., Alonso-Herrero, A., et al. 2016, ApJ, 819, 166
- Meisenheimer et al. (2007) Meisenheimer, K., Tristram, K. R. W., Jaffe, W., et al. 2007, AA, 471, 453
- Mendoza-Castrejón et al. (2015) Mendoza-Castrejón, S., Dultzin, D., Krongold, Y., González, J. J., & Elitzur, M., 2015, MNRAS, 447, 2437
- Middelberg et al. (2004) Middelberg, E., Roy, A. L., Nagar, N. M., et al., 2004, A&A, 417, 925
- Miller et al. (1990) Miller, L., Peacock, J. A., & Mead, A. R. G., 1990, MNRAS, 244, 207
- Mor et al. (2009) Mor, R., Netzer, H., & Elitzur, M., 2009, ApJ, 705, 298
- Mor & Netzer (2012) Mor, R., & Netzer, H. 2012, MNRAS, 420, 526
- Mor & Trakhtenbrot (2011) Mor, R., & Trakhtenbrot, B. 2011, ApJ, 737, L36
- Nagar et al. (1999) Nagar, N. M., Wilson, A. S., Mulchaey, J. S., & Gallimore, J. F., 1999, ApJS, 120, 209
- Nenkova et al. (2002) Nenkova, M., Ivezić, Ž., & Elitzur, M., 2002, ApJ, 570, L9
- Nenkova et al. (2008a) Nenkova, M., Sirocky, M. M., Ivezić, Ž., & Elitzur, M., 2008a, ApJ, 685, 147
- Nenkova et al. (2008b) Nenkova, M., Sirocky, M. M., Nikutta, R., Ivezić, Ž., & Elitzur, M., 2008b, ApJ, 685, 160
- Netzer (2008) Netzer, H., 2008, Mem. Soc. Astron. Italiana, 79, 1083
- Neugebauer et al. (1987) Neugebauer, G., Green, R. F., Matthews, K., et al. 1987, ApJS, 63, 615
- Nikutta et al. (2009) Nikutta, R., Elitzur, M., & Lacy, M., 2009, ApJ, 707, 1550
- Noll et al. (2009) Noll, S., Burgarella, D., Giovannoli, E., et al. 2009, A&A, 507, 1793N
- Packham et al. (2005) Packham, C., Telesco, C. M., Hough, J. H., & Ftaclas, C., 2005, Revista Mexicana de Astronomia y Astrofisica Conference Series, 24, 7
- Peng (2002) Peng, C. Y., 2002, AJ, 124, 294
- Peterson et al. (2005) Peterson, B. M., Bentz, M. C., Desroches, L.-B., et al., 2005, ApJ, 632, 799
- Piconcelli & Guainazzi (2005) Piconcelli, E., & Guainazzi, M. 2005, A&A, 442, L53
- Pier & Krolik (1992) Pier, E. A., & Krolik, J. H. 1992, ApJ, 401, 99
- Ramos Almeida et al. (2007) Ramos Almeida, C., Pérez García, A. M., Acosta-Pulido, J. A., & Rodríguez Espinosa, J. M. 2007, AJ, 134
- Ramos Almeida et al. (2009) Ramos Almeida, C., Levenson, N. A., Rodríguez Espinosa, J. M., et al., 2009, ApJ, 702, 1127
- Ramos Almeida et al. (2011) Ramos Almeida, C., Levenson, N. A., Alonso-Herrero, A., et al., 2011, ApJ, 731, 92
- Ramos Almeida et al. (2014a) Ramos Almeida, C., Alonso-Herrero, A., Levenson, N. A., et al., 2014a, MNRAS, 439, 3847
- Radomski et al. (2008) Radomski, J. T., Packham, C., Levenson, N. A., et al., 2008, ApJ, 681, 141
- Reach et al. (2005) Reach, W. T., Megeath, S. T., Cohen, M., et al., 2005, PASP, 117, 978
- Rees (1984) Rees, M. J., 1984, X-ray and UV Emission from Active Galactic Nuclei, 138
- Runnoe et al. (2012) Runnoe, J. C., Brotherton, M. S., & Shang, Z. 2012, MNRAS, 426, 2677
- Rowan-Robinson et al. (2009) Rowan-Robinson, M., Valtchanov, I., & Nandra, K. 2009, MNRAS, 397, 1326
- Rowan-Robinson et al. (2008) Rowan-Robinson, M., Babbedge, T., Oliver, S., et al. 2008, MNRAS, 386, 697
- Rowan-Robinson (1977) Rowan-Robinson, M. 1977, ApJ, 213, 635
- Siebenmorgen et al. (2015) Siebenmorgen, R., Heymann, F., & Efstathiou, A. 2015, A&A, 583, A120
- Seyfert (1943) Seyfert, C. K. 1943, ApJ, 97, 28
- Shi et al. (2007) Shi, Y., Ogle, P., Rieke, G. H., et al. 2007, ApJ, 669, 841S
- Shields et al. (1999) Shields, G. A., Wobus, L., & Husfeld, D., 1999, Structure and Kinematics of Quasar Broad Line Regions, 175, 143s
- Schinnerer et al. (1998) Schinnerer, E., Eckart, A., & Tacconi, L. J. 1998, ApJ, 500, 147
- Schmidt & Green (1983) Schmidt, M., & Green, R. F. 1983, ApJ, 269, 352
- Shu et al. (2010) Shu, X. W., Yaqoob, T., & Wang, J. X. 2010, ApJS, 187, 581
- Schweitzer et al. (2006) Schweitzer, M., Lutz, D., Sturm, E., et al. 2006, ApJ, 649, 79
- Schweitzer et al. (2008) Schweitzer, M., Groves, B., Netzer, H., et al. 2008, ApJ, 679, 101-117
- Surace & Sanders (1999) Surace, J. A., & Sanders, D. B. 1999, ApJ, 512, 162
- Surace et al. (2001) Surace, J. A., Sanders, D. B., & Evans, A. S. 2001, AJ, 122, 2791S
- Stalevski et al. (2012) Stalevski, M., Fritz, J., Baes, M., Nakos, T., & Popovic, L. C. 2012, Publications de l’Observatoire Astronomique de Beograd, 91, 235 Dullemond
- Stuart & Ord (1994) , Stuart & Ord, ISBN-13: 978-0470665305, 6TH Edition
- Sturm et al. (2002) Sturm, E., Lutz, D., Verma, A., et al. 2002, A&A, 393, 821
- Telesco et al. (2003) Telesco, C. M., Ciardi, D., French, J., et al., 2003, Proc. SPIE, 4841, 913
- Tristram et al. (2007) Tristram, K. R. W., Meisenheimer, K., Jaffe, W., et al., 2007, A&A, 474, 837
- Ueda et al. (2003) Ueda, Y., Akiyama, M., Ohta, K., & Miyaji, T. 2003, ApJ, 598, 886
- Ueda et al. (2005) Ueda, Y., Ishisaki, Y., Takahashi, T., Makishima, K., & Ohashi, T. 2005, ApJS, 161, 185
- Urry & Padovani (1995) Urry, C. M., & Padovani, P., 1995, PASP, 107, 803
- Urry (2003) Urry, M., 2003, Active Galactic Nuclei: From Central Engine to Host Galaxy, 290, 3
- Veilleux (2006) Veilleux, S. 2006, Astronomical Society of the Pacific Conference Series, 357, 231
- Veilleux et al. (2009a) Veilleux, S., Rupke, D. S., Kim, D.-C., et al., 2009a, ApJS, 182, 628
- Veilleux et al. (2009b) Veilleux, S., Kim, D.-C., Rupke, D. S. N., et al., 2009b, ApJ, 701, 587
- Véron-Cetty & Véron (2006) Véron-Cetty, M.-P., & Véron, P. 2006, A&A, 455, 773
- Véron-Cetty & Véron (2010) Véron-Cetty, M.-P., & Véron, P. 2010, A&A, 518, A10
- Zakamska et al. (2016) Zakamska, N. L., Lampayan, K., Petric, A., et al. 2016, MNRAS, 455, 4191
- Zhou & Zhang (2010) Zhou, X.-L., & Zhang, S.-N. 2010, ApJ, 713, L11
Appendix A Extended emission
PG 0050+124 has a radial profile which is clearly more extended than the radial profile of the standard star, as can be seen in Figure 3. Therefore, for this object we model the brightness profile using the 2D algorithm GALFIT (Peng, 2002). For that we assume the following models: (1) a Sérsic and PSF components with all parameters left to vary freely; (2) a Sérsic component with all parameters allowed to vary, except the index of the brightness profile , which we assume as 1, plus a PSF component with its parameters free; and (3) a Sérsic profile with and a PSF component with free parameters. We find that the model that best reproduces the MIR emission of PG 0050+124 with a reduced is the one that includes a Sérsic component with plus a PSF. The flux in the residual image is per cent. The parameters of the Sérsic component and the extended and unresolved emission are listed in Table 12. These parameters are consistent with those found by Veilleux (2006) at band using HST/NICMOS images. The uncertainties reported in Table 12 are the standard deviation of the values given by all models. The unresolved plus Sérsic flux of PG 0050+124 measured with GALFIT is similar, within the uncertainties, to that measured directly on the image inside an aperture radius of 1 arcsec. The residual image (see Fig. 2) reveals the possible presence of a ring in PG 0050+124. Indeed, Schinnerer et al. (1998) detected a ring using observations of 12CO(2-1) and 13CO(1-0) lines with the four antennas of the Plateau de Bure interferometer from IRAM. However, the size of the apparent ring ( arcsec of diameter) observed in the residual image of CC does not fit the size of the ring (1.6 arcsec of diameter) reported by Schinnerer et al. (1998). On the other hand, this extended emission could alternatively be related to the silicate extended region proposed by Schweitzer et al. (2008).
| PA | |||||
| (mJy) | (mJy) | (pc) | (degree) | ||
| 4∗ |