22email: gcastell@iafe.uba.ar 33institutetext: Universidad de Buenos Aires, Ciclo Básico Común, Buenos Aires, Argentina 44institutetext: Universidad de Buenos Aires, Facultad de Arquitectura Diseño y Urbanismo, Buenos Aires, Argentina 55institutetext: National Centre for Radio Astrophysics (NCRA), Post Bag No.3, Ganeshkhind, 411007, Pune, India
Radio and X-ray properties of the source G29.37+0.1 linked to HESS J1844030
Abstract
Aims. We report on the first detailed multiwavelength study of the radio source G29.37+0.1, which is an as-yet-unclassified object linked to the very-high-energy -emitting source HESS J1844030. The origin of the multiwavelength emission toward G29.37+0.1 has not been clarified so far, leaving open the question about the physical relationship between these sources.
Methods. Using observations carried out with the Giant Metrewave Radio Telescope (GMRT), we performed high-quality full-synthesis imaging at 610 MHz of the field containing G29.37+0.1. The obtained data, combined with observations at 1400 MHz from The Multi-Array Galactic Plane Imaging Survey (MAGPIS) were used to investigate in detail the properties of its radio emission. Additionally, we reprocessed archival data obtained with the XMM-Newton and Chandra observatories in order to get a multiwavelength view of this unusual source.
Results. The radio source G29.37+0.1 mainly consists of a bright twisted structure, named the S-shaped feature. The high sensitivity of the new GMRT observations allowed the identification of potential lobes, jets, and a nuclear central region in the S-shaped morphology of G29.37+0.1. We also highlight the detection of diffuse and low surface brightness emission enveloping the brightest emitting regions. The brightest emission in G29.37+0.1 has a radio synchrotron spectral index =0.590.09. Variations in the spectral behaviour are observed across the whole radio source with the flattest spectral features in the central nuclear and jets components (0.3). These results lead us to conclude that the brightest radio emission from G29.37+0.1 likely represents a newly recognized radio galaxy. The identification of optical and infrared counterparts to the emission arising from the core of G29.37+0.1 strengthens our interpretation of an extragalactic origin of the radio emission. We performed several tests to explain the physical mechanism responsible for the observed X-ray emission, which appears overlapping the northeastern part of the radio emission. Our spectral analysis demonstrated that a non-thermal origin for the X-ray emission compatible with a pulsar wind nebula is quite possible. The analysis of the spatial distribution of the CO gas revealed the presence of a complex of molecular clouds located in projection adjacent to the radio halo emission and probably interacting with it. We propose that the faint halo represents a composite supernova remnant with a pulsar powered component given by the diffuse X-ray emission superimposed along the line of sight to the radio galaxy. Further broadband observations of HESS J1844030 are needed to disentangle its origin, although its shape and position suggest an extragalactic origin connected to G29.37+0.1.
Key Words.:
Gamma rays: galaxies:individual:HESS J1844030 – Radio continuum: galaxies: individual: G29.37+0.1 – ISM: clouds ISM- X-rays: general1 Introduction
Since their earlier classification as Fanaroff and Riley class I (FRI) and class II (FRII) objects (Fanaroff & Riley, 1974), radio continuum surveys have been very efficient in identifying thousands of radio galaxies. While all these objects have a galactic nucleus, the main difference between the members of these two groups is the brightness surface distribution. Indeed, while FRI radio galaxies are core-brightened objects dominated by the presence of collimated jets extending in opposite directions from the energetic centre, the members of the FRII group also have hotspot regions of bright emission toward the end of diffuse lobes powered by the relativistic jets. Studies of radio galaxies highlight the importance of these sources for understanding a variety of issues such as the cycle of radio activity and the interaction of the jets with the ambient medium during their evolution.
While the radio galaxies are possibly the most energetic single entities in the Universe, supernovae (SNe) and their remnants (SNRs) could also be the most powerful astronomical sources inside a galaxy. In our Galaxy, despite considerable effort, the number of identified SNRs (300, Green, 2014) is at least three times smaller than that expected from statistical studies. The OB star counts, pulsar birth rates, and SN rates in other Local Group galaxies predict 1-2 stellar explosions per century and a lapse of 50,000 to 100,000 yr in which the radio synchrotron emission from their remnants is observable (Li et al., 1991; Tammann et al., 1994).
Over the last decade, observations with instruments such as the Fermi- Large Area Telescope (Fermi-LAT), VERITAS, MAGIC, AGILE, and the High Energy Stereoscopic System (H.E.S.S.) have permitted successful identification of a huge amount of both Galactic and extragalactic -ray emitting sources. To date, a number of the high-energy emitting Galactic objects are known to be associated with SNRs, pulsar wind nebulae (PWNe), and binary systems, while active galactic nuclei (AGNs) would be responsible for the extragalactic -ray emission (Acero et al. 2013; Ackermann et al. 2015; Acero et al. 2016. For an extensive updated catalogue of TeV sources see, for instance, the TeVCat web page111http://tevcat.uchicago.edu/.). There is still an important number of -ray sources, particularly in the Galactic plane, for which a clear identification has not been established. In these cases, a broadband approach using multiwavelength observations, especially in the radio and X-ray bands, is essential to advance the understanding of the nature of the -ray emission processes.
This work focuses on the puzzling radio source named G29.37+0.1. The nature of this object has remained obscure: although G29.37+0.1 was proposed to be a new SNR candidate (Helfand et al., 2006), its morphology comprising two oppositely-directed jets and lobes from a point source located at its centre strongly resembles the structure of a radio galaxy (possibly PMN J18440306222Parkes-MIT-NRAO (PMN) catalogue (Gregory et al., 1994)., Helfand et al., 1989). The situation became further confusing after the detection with the H.E.S.S. telescope array of a complex of TeV sources toward G29.37+0.1 (Hoppe, 2008). Among them, the so-called “component C” (HESS~J1843$-$033C) was detected overlapping only the northeastern edge of the radio source. The latest data recorded with H.E.S.S. reveal the -ray source HESS~J1844$-$030 now spatially overlapping, at least as we see projected on the plane of the sky, the whole radio emission from G29.37+0.1333Deil C. et al for the H.E.S.S. Collaboration, “H.E.S.S. Galactic Plane Survey”, ICRC. August 4, 2015.. As far as we know, no evidence for variability was reported in the gamma-ray flux. The preliminary analysis toward HESS J1844030 yields a flux of 1.0% of the Crab’s in the 0.2-100 TeV energy range. The apparent correlation makes a connection between the HESS source and G29.37+0.1 very plausible. Despite the intriguing morphology of G29.37+0.1 and its likely connection to HESS J1844030, this system has received little attention since it was first observed making this region worthwhile to survey. In this work, we present a multifrequency approach aimed at exploring the origin of both sources with a view to understanding whether they are physically linked or not.
2 Observations and data reduction
2.1 Radio continuum data
We used the Giant Metrewave Radio Telescope (GMRT) during two sessions on 21 and 22 March 2015 to carry out full-synthesis imaging in the G29.37+0.1/HESS J1844030 region, with a total time of 17 hours under the project code 27-027. The primary beam of the full array for imaging covers the entire radio emission from G29.37+0.1 (FWHM of the primary beam of GMRT is 0∘.7 at 610 MHz).
The data from each day were fully reduced and imaged separately to ensure that there were no day-to-day amplitude discrepancies. All the calibration and data reduction were performed using the Astronomical Image Processing Software (AIPS) package developed by the N.R.A.O. We initiated the reduction of the data by manually removing visibilities affected by strong radio frequency interference (RFI) throughout the observing band. Dead antennas were also flagged. To calibrate the amplitude response of individual antennas we used short observations of the standard calibrators 3C48 and 3C286 during March 21 and 22 observing runs, respectively. This calibration was performed setting the flux scale according to the coefficients taken from Perley & Butler (2013). Phase and bandpass calibrations were derived from 1822096. Subsequently, the calibration was applied to the target field visibilities. Before imaging, the data for each day were averaged in terms of frequency by collapsing the bandwidth to 41 spectral channels (the observing mode used a total BW 33 MHz comprising 512 individual 65 kHz channels). Such spectral average reduced the data volume and is acceptable to avoid radial smearing out to the edge of the primary beam.
The final calibrated visibility data for each day were combined into a single uv data set and imaged by adopting a weighting scheme with the Briggs robust parameter equal to 0 (a compromise between uniform weighting of the baseline for highest angular resolution and natural weighting for highest sensitivity). To deal with the non-coplanarity of the visibilities, we employed wide-field imaging based on a pseudo-three-dimensional multifacet algorithm (Cornwell & Perley, 1992). In order to reduce residual phase variations and to increase the dynamic range, the imaging procedure also included two iterations of phase-only self-calibration and a final phase and amplitude self-calibration. Further self-calibration loops were not necessary as these did not improve the fidelity, nor reduce the noise of the image. In each iteration we inspected and flagged any weaker RFI-affected visibilities that could have persisted at this stage. The average synthesized beam for the map made with combined frequency channels is . The rms noise in the 610 MHz GMRT image is 0.42 mJy beam-1, after correcting for the response of the primary beam.
A complementary radio image at 1400 MHz available in the Multi-Array Galactic Plane Imaging Survey (MAGPIS, Helfand et al. 2006) was also used to investigate the local spectral properties of G29.37+0.1 in combination with the GMRT 610 MHz image. The MAGPIS image has a synthesized beam and an rms 0.7 mJy beam-1.
2.2 X-ray observations
We studied the X-ray emission from the G29.37+0.1 field by reprocessing archival data obtained with the Chandra and XMM-Newton observatories. The combination of these two datasets permitted us to perform the most detailed spatially-resolved X-ray spectroscopic study of the region presented so far.
The source G29.37+0.1 was observed with Chandra at two opportunities using the I array of the Advanced Charge-Coupled Device (CCD) Imaging Spectrometer (ACIS-I) operating in the VFAINT telemetry format. The region was also observed with XMM-Newton in two opportunities using the three EPIC cameras aboard the telescope (i.e. MOS1, MOS2, and pn). Both observations were pointed toward the X-ray point-like source AX J1845.00300, located in the northeastern portion of G29.37+0.1. This X-ray source was first discovered by Torii et al. (1998) with ASCA. Table 1 summarizes the Chandra and XMM-Newton archival observations used in this paper.
The Chandra data were reprocessed employing the Chandra Interactive Analysis of Observations software package (CIAO, version 4.6) using the standard procedure in which the calibration products are provided by CALDB 4.6.1.1. The reduction of the XMM-Newton observations was performed using the Science Analysis System (SAS, version 13.5.0) and the HEAsoft (version 6.15.1) analysis package. For each XMM-Newton observation we obtained light curves in the high-energy band ( ¿ 10 keV) and we filtered the event files to remove periods of high count-rate. We applied additional filtering of the XMM-Newton dataset to include only events with FLAG = 0 and PATTERN and for MOS and pn cameras, respectively. The final data consist of filtered event files appropriate to extract science products.
| Telescope | Obs-ID | Instrument | Date | Effective exposure |
|---|---|---|---|---|
| time (ks) | ||||
| Chandra | 11232 | ACIS-I | Aug. 11, 2009 | 29.5 |
| 11801 | ACIS-I | Jun. 17, 2010 | 29.4 | |
| XMM-Newton | 0602350101 | MOS1, MOS2, pn | Apr. 14, 2010 | 34.5, 34.5, 23.3 |
| 0602350201 | MOS1, MOS2, pn | Apr. 16, 2010 | 33.2, 37.5, 16.1 |
2.3 The G29.37+0.1 field at other wavelengths
For the purpose of deriving kinematic distances, we used the 21-cm line emission of the neutral hydrogen (HI) from the Very Large Array (VLA) Galactic Plane Survey (VGPS, Stil et al. 2006). These data imaged the region around G29.37+0.1 with a spatial resolution of 1′, an rms noise level per velocity channel of 2 K, and a spectral resolution of 1.56 km s-1 with a separation in velocity channels of 0.82 km s-1. On the other hand, to investigate the morphological and kinematic properties of the molecular component of the interstellar medium (ISM), we employed data from the Galactic Ring Survey (GRS, Jackson et al. 2006), which maps the J=1-0 rotational transition line of the 13CO gas with an angular resolution of 46′′, a separation between consecutive velocity channels of 0.2 km s-1, and a sensitivity better than 0.4 K.
3 A multiwavelength view of the G29.37+0.1/HESS J1844030 system
3.1 Radio continuum emission
3.1.1 Morphological properties
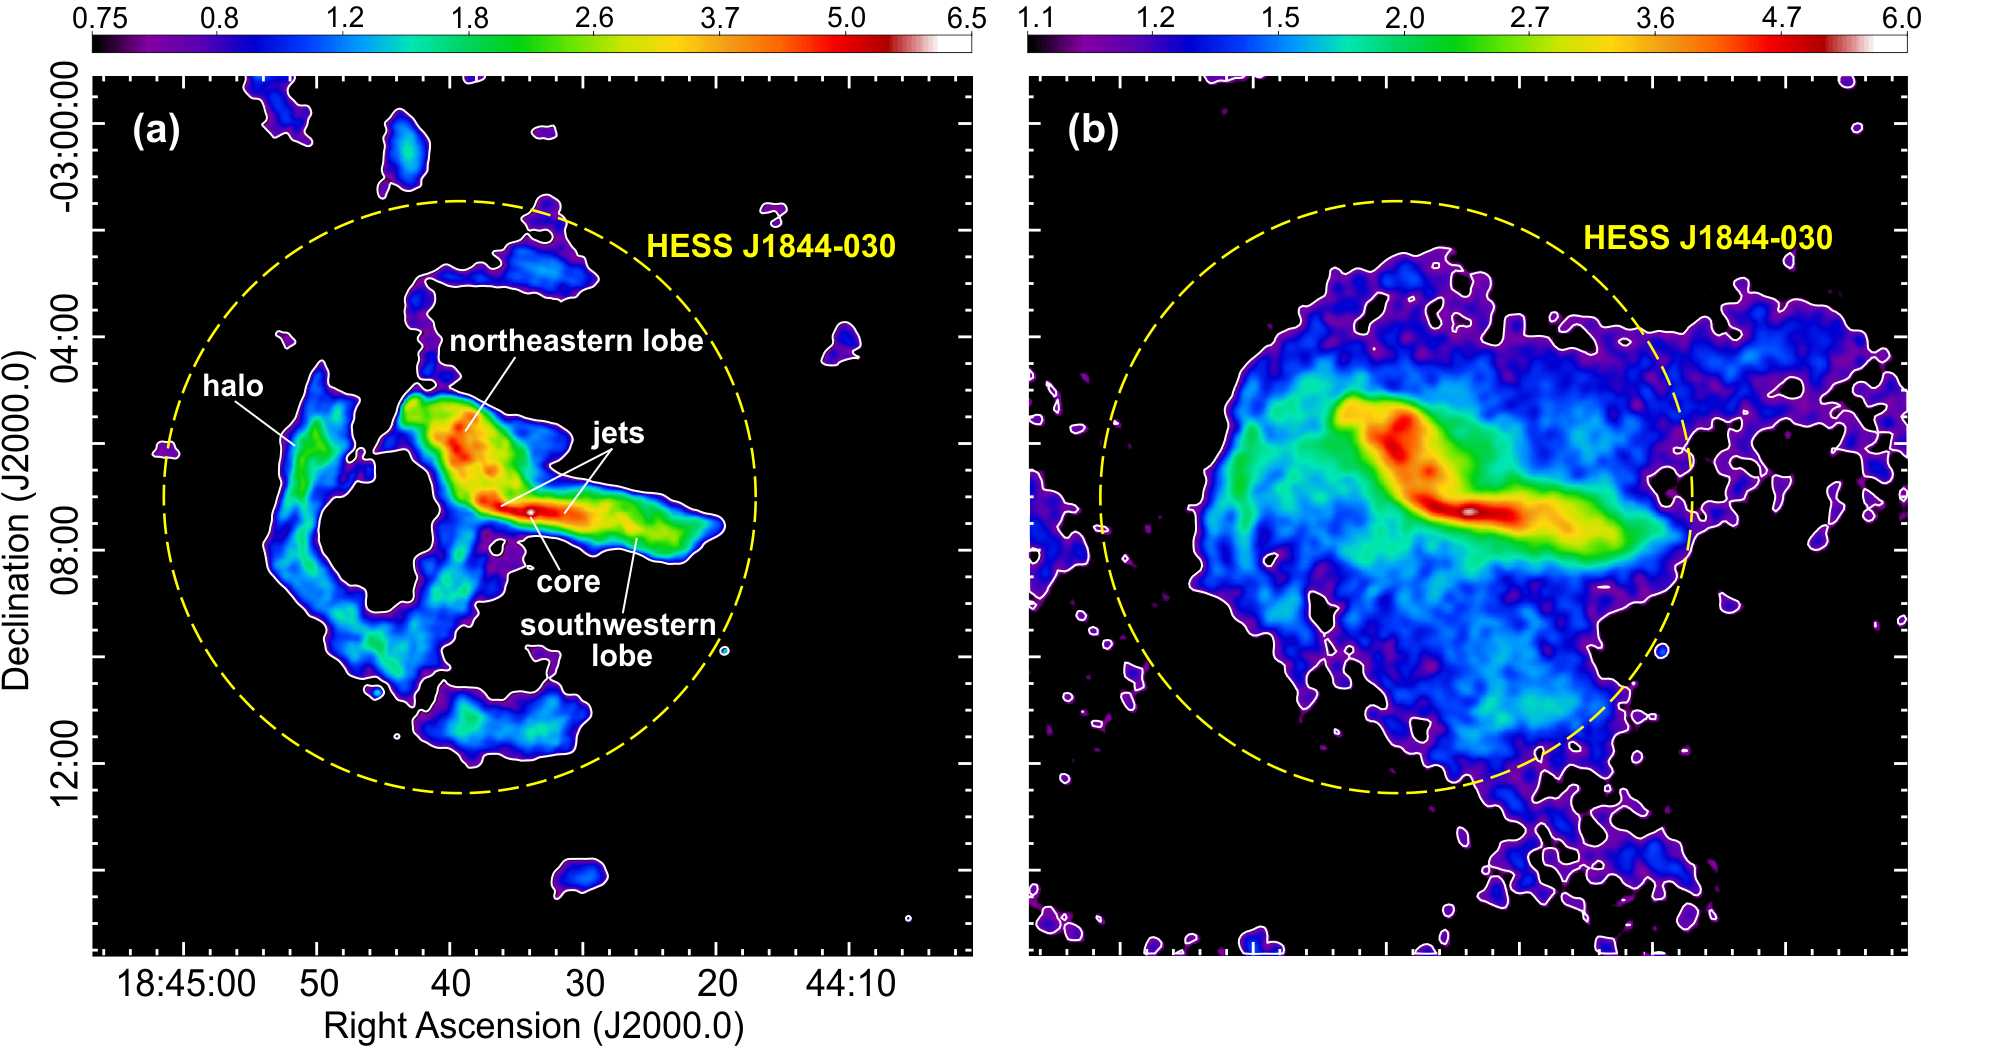
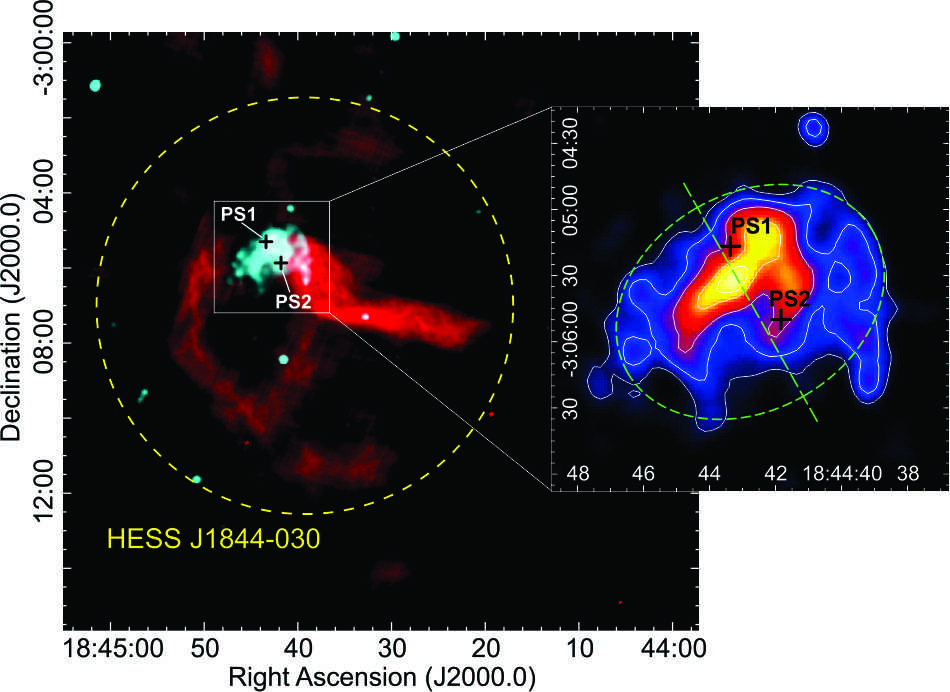
In Fig. 1a we show the new GMRT total power continuum radio image of G29.37+0.1 at 610 MHz. The emission is characterized by a bright curved feature showing a “S”-shaped profile extended about 6′ in size in the northeast-southwest direction. As can be seen in the new GMRT image, this structure ends abruptly in the form of lobes with well defined outer boundaries. Significant internal curved structures are mainly noticeable in the northeastern portion of the arched emission, at the end of which a forward protrusion with enhanced radio emission is detected (RA18h44m43′′, Dec03∘05′20′′, J2000.0). Inside the S-shaped feature, a double-sided jet seems to emanate from a central point-like source (hereafter, the “nucleus” or “core”) located at RA18h44m34′′, Dec03∘07′17′′. The projected separation between the centre of the source and the end of each jet is similar (). Moreover, both radio lobes extend up to similar angular distances from the core ( and for the northeastern and southwestern lobe, respectively). A brightness asymmetry is observed between the lobes, being the northeastern one nearly 2.7 times brighter than its opposite counterpart.
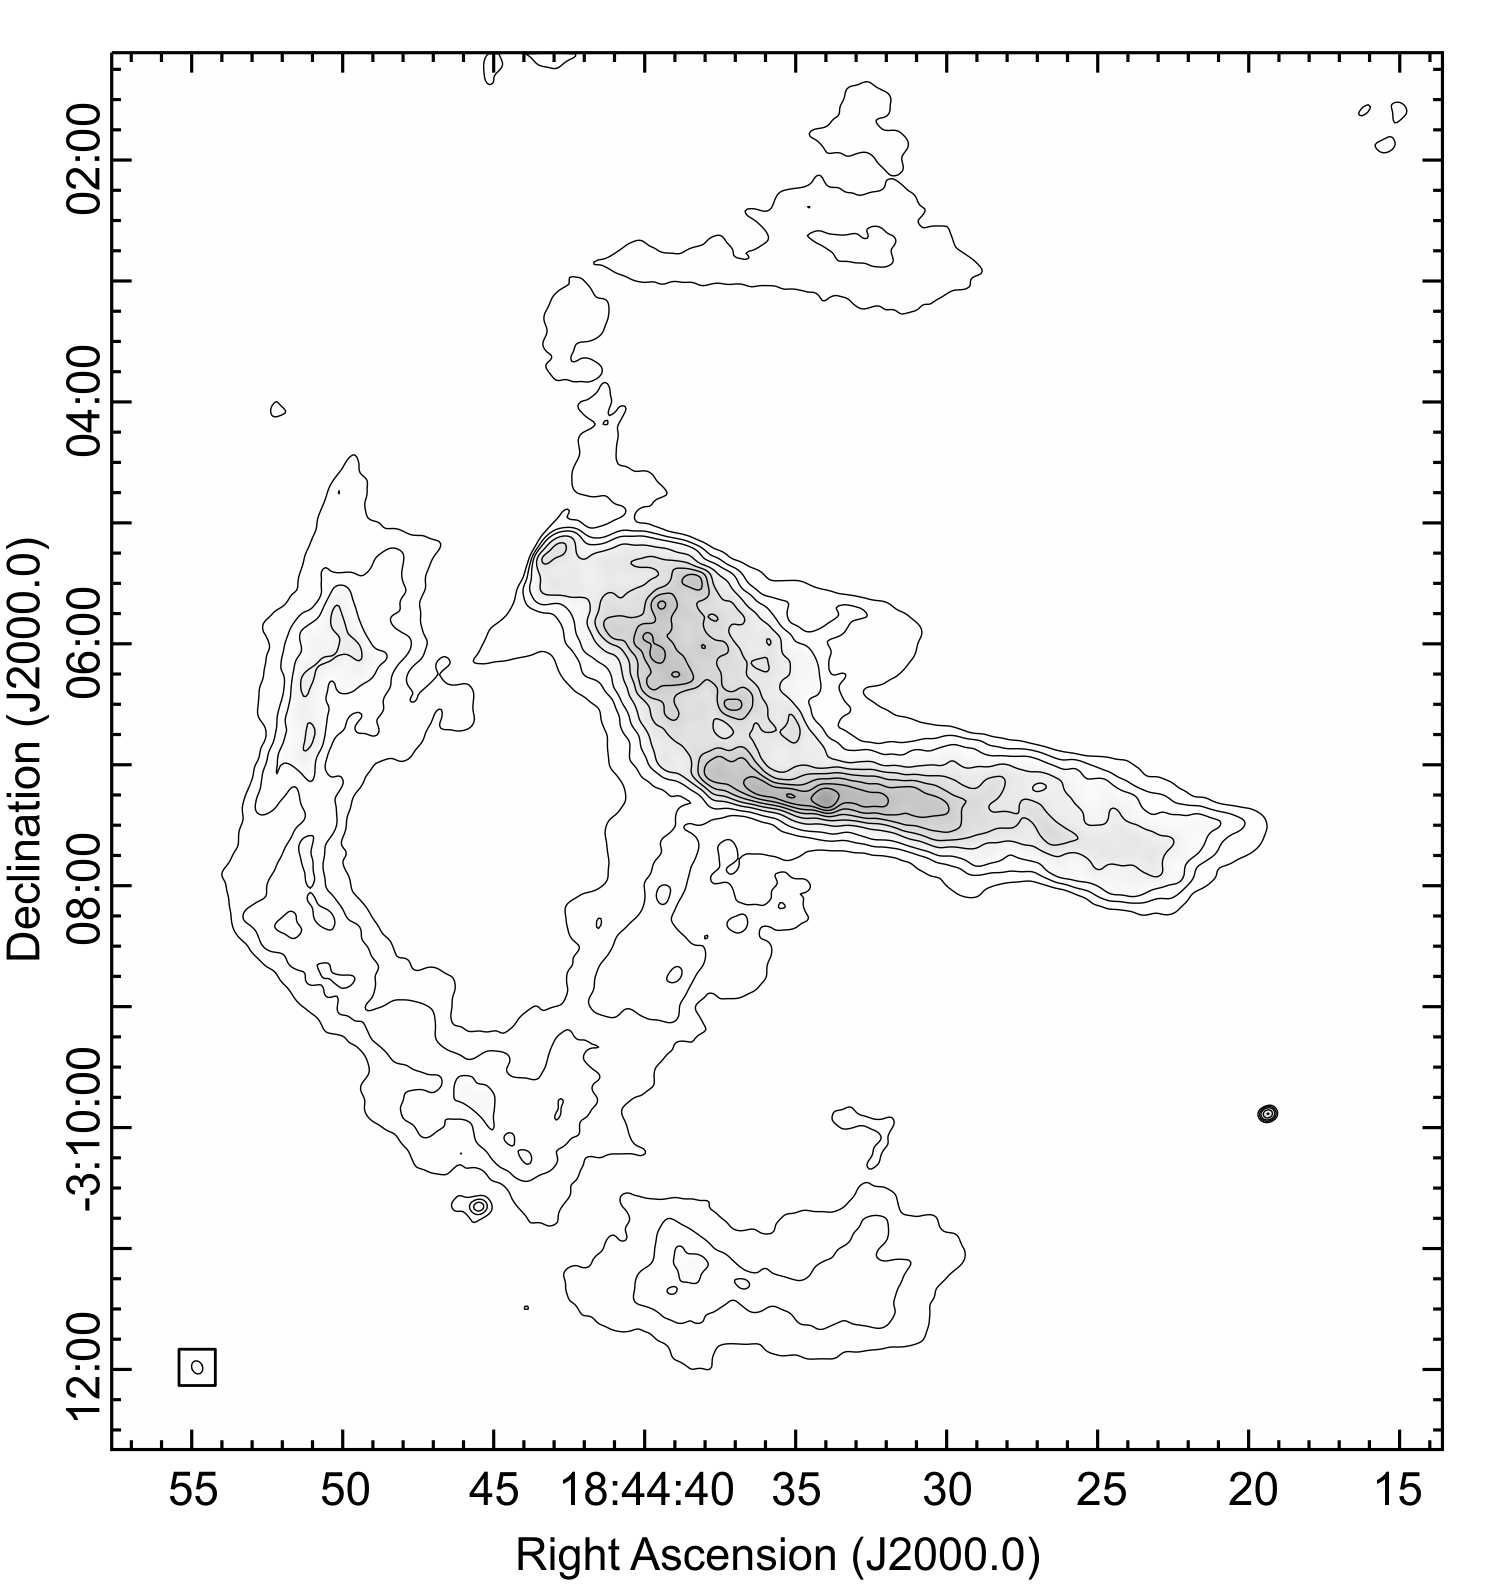
From a pure morphological point of view, the appearance of the S-shaped structure in G29.37+0.1 is very reminiscent of a radio galaxy consisting of two opposite radio lobes at the end of a jet-nucleus structure (e.g. Lara et al., 2001; Weżgowiec et al., 2016). However, it is difficult to classify it as an FRI or FRII type galaxy by a simple morphological analysis. On one hand, G29.37+0.1 presents jets extending beyond a core, but these do not seem to dominate the radio emission, as is typically observed in FRI objects. On the other hand, edge-brightened lobe structures with bright radio emission inside are also part of the emission observed from this source, as is expected in galaxies belonging to the FRII category. Figure 2 displays a total-intensity contour map of the full source at 610 MHz. In this representation the complex structure of brighter features are clearly shown. The bright emission region approximately at the middle of the northeastern lobe together with the protuberance at its outer edge may be interpreted as evidence for the so-called hotspot-like characteristic of FRII radio sources. Such protrusions of emission pushing forward the leading edge of the lobes were also observed in several radio galaxies classified as FRII sources (see for instance 3C 223 and 4C 73.08, Weżgowiec et al., 2016; Orrù et al., 2010). On the opposite southwestern lobe, the emission appears more diffuse without a significant hotspot. Radio structural asymmetries, such as those observed in G29.37+0.1, were also found in other radio galaxies, J1211+743 and J1918+742 being good examples (Pirya et al., 2011, and references therein). Both intrinsic differences between the lobes and extrinsic effects (including orientation and environmental asymmetries) have been used by a number of authors to explain the observed asymmetries in the brightness of the lobes in radio galaxies (Gopal-Krishna & Wiita, 2000; Pirya et al., 2011).
The S-shaped feature in G29.37+0.1 is surrounded by a region of low surface brightness, which we designate “halo”. This faint emission has a relatively sharp outer boundary and is slightly brighter over the eastern and southern sides. We note that although artefacts are not present in the new GMRT image, the non detection of the complete emission from the halo at 610 MHz could be ascribed to possible missing low-level extended emission. At this frequency the halo component looks like a ring rather than an envelope of low-surface brightness distribution as is observed at 1400 MHz. We also mention that this faint component is either undetected or poorly detected in other imaging radio surveys (e.g. 1.4 GHz NRAO VLA Sky Survey, Condon et al. 1998; 1.4 GHz VGPS, Stil et al. 2006; NRAO VLA Archive Survey image at 5 GHz, Crossley et al. 2008). This structure has probably been missed due to sensitivity limits in these radio observations plus the poorer overall uv-coverage of snapshot in some of these surveys. The detection of similar halo components in radio galaxies is rare, with only few clear cases known. The most extreme example of a low-surface brightness component is M87 for which Owen et al. (2000), using the Very Large Array at 330 MHz, reported the detection of a large-scale radio structure encompassing the lobes, jets, and nucleus of the radio galaxy. The faint emission in this region is inhomogeneous and highly filamentary. Recently, Weżgowiec et al. (2016) after combining interferometric and single dish observations at 1400 MHz were able to resolve out the diffuse radio emission forming the halo structure in five radio galaxies (over a sample of 15 objects). Notably, all of them correspond to objects located well off the Galactic plane. In our work, the faint emission surrounding the S-shape feature in G29.37+0.1 could be either the halo of the radio galaxy or a Galactic feature in positional coincidence along the line of sight toward the S-like structure. In Sec. 4.2.2 we discuss further this topic.
3.1.2 Global and local radio spectral properties of G29.37+0.1
Based on the new radio observations at 610 MHz, we have estimated an integrated flux density of S610=1.420.35 Jy for the S-like feature in G29.37+0.1, where the attenuation of the primary beam has been corrected for this calculation. In Table LABEL:S-fluxes we list the estimated values of the flux densities integrated over the entire bright S-like component by using the new and public-domain data. The corresponding flux measurements over its northeastern and southwestern radio lobes are also reported in Table LABEL:S-fluxes. In all cases, the relative contribution of the nucleus and jet components to the total radio flux density of the whole S-shaped feature is slightly less than 10%. At each frequency, the area of integration was defined using a polygon around the emission region. All the new measured flux estimates were tied to the flux scale of Perley & Butler (2016). The quoted errors are mainly due to uncertainties in defining the boundaries of the radio emission and the average background level that may occasionally be present, with a contribution from the uncertainty in the calibration of each dataset.
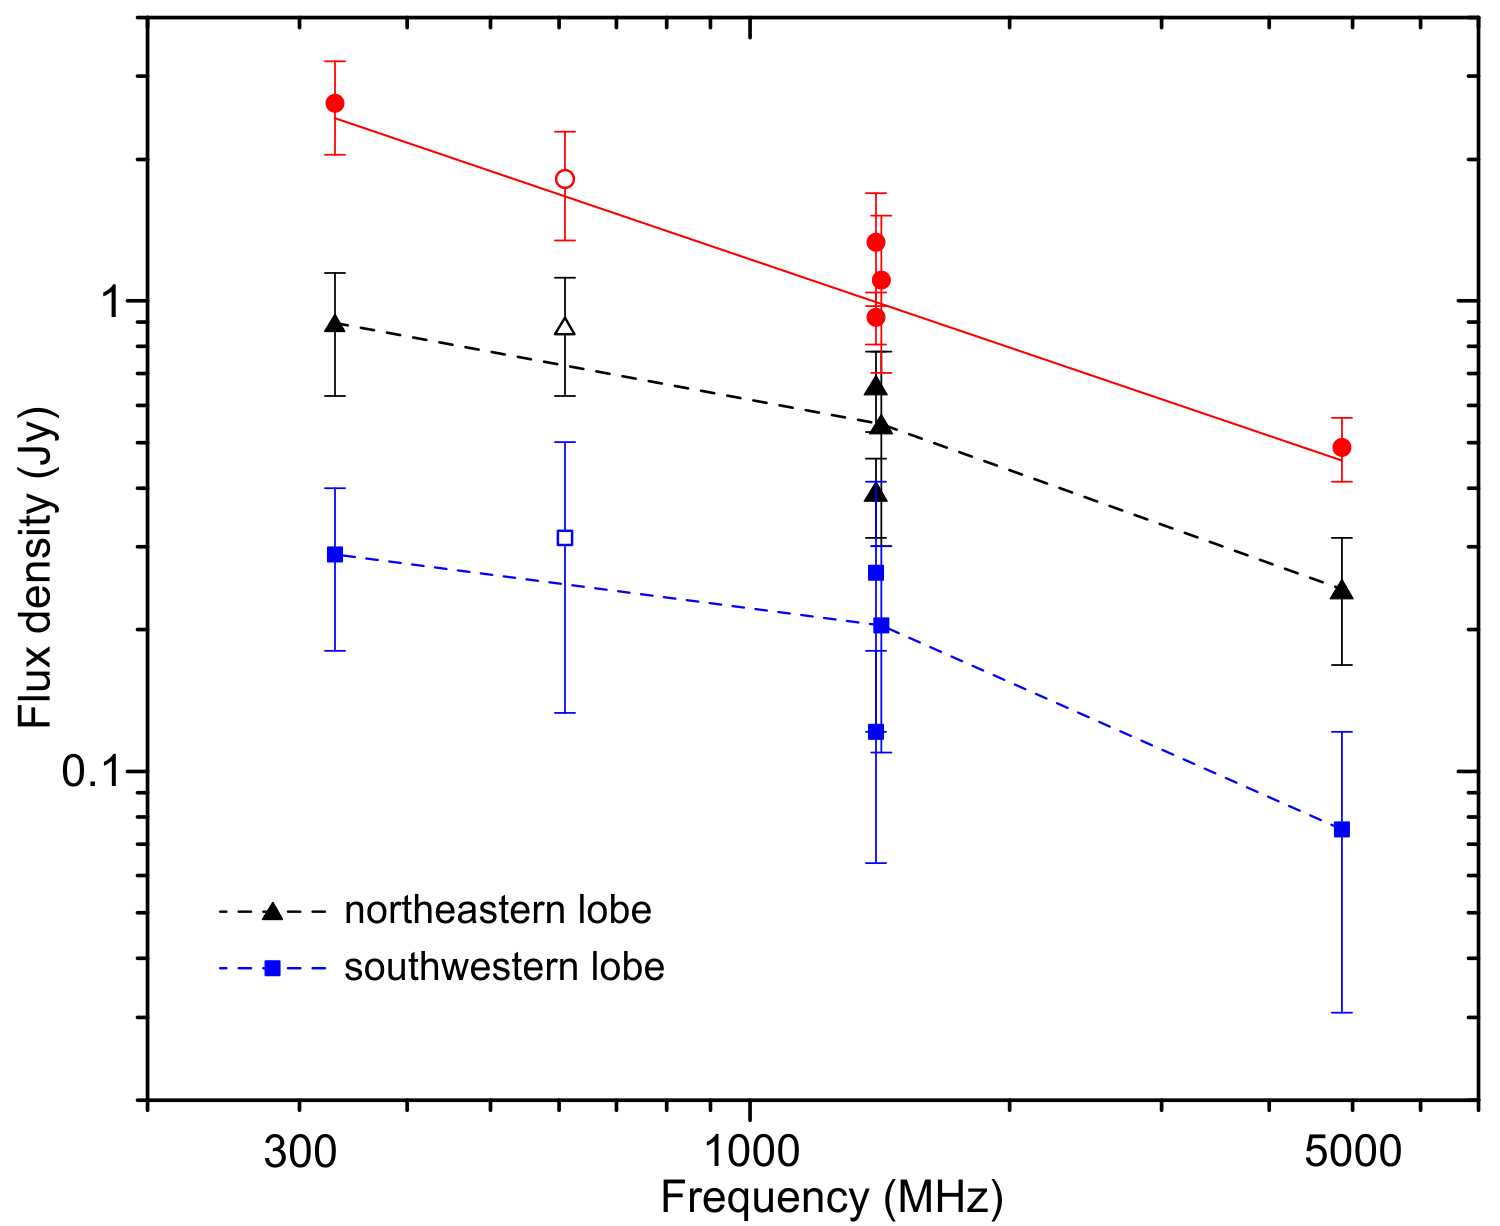
In Fig. 3 we show a plot of the total integrated spectrum for the S-shaped feature and the two radio lobes in G29.37+0.1, calculated using the flux densities reported in Table LABEL:S-fluxes. A weighted fit to the data points using a single power law yields for the whole S-shaped component a slope =0.590.09 (defined here by the relation , with the flux at the frequency ). This integrated spectral index implies that the radiation from the S-shaped feature has a non-thermal origin. The fact that the integrated flux density measured at 610 MHz falls nicely on the power law demonstrates that our GMRT image is missing little, if any emission on the angular scales of the lobes, and thus our flux density measurements and spectrum over the brightest S-like component are reliable.
From Fig. 3 and Table LABEL:S-fluxes it seems that the ratio between the integrated flux densities of the lobes has a break at a frequency of 1400 MHz (a behaviour that is not observed in the integrated spectrum of the whole S-like feature). The break is more noticeable for the southwestern lobe, which might be interpreted as a physical difference between the two lobes (see Fig. 3). The departure from a single power-law could be attributed to processes of energy injection and losses that can occur as the energy carried by the jets is diffused into them (Pacholczyk, 1970). A similar spectral behaviour showing a high frequency steepening was, for example, also observed in the integrated spectra of the radio lobes in the radio galaxy 4C 43.15 (Morabito et al., 2016). In our case, the interpretation of a spectrum with a break for the radio lobes relies mainly on the flux density points at 330 and 4860 MHz. So, further observations toward G29.37+0.1, especially at low and high radio frequencies, are crucial to confirm the observed spectral trend.
| Frequency | Flux density [Jy] | Data | ||
|---|---|---|---|---|
| [MHz] | S-shape | NEa𝑎aa𝑎aHere, NE and SW respectively denote the northeastern and southwestern radio lobes. Lobe | SWa𝑎aa𝑎aHere, NE and SW respectively denote the northeastern and southwestern radio lobes. Lobe | |
| 330 | 2.020.43 | 0.720.20 | 0.250.09 | GPS |
| 610 | 1.420.35 | 0.710.19 | 0.270.15 | This work |
| 1400 | 1.060.27 | 0.540.10 | 0.230.12 | MAGPIS |
| 1400 | 0.750.09 | 0.330.06 | 0.110.05 | NVSS |
| 1420 | 0.890.31 | 0.450.19 | 0.180.08 | VGPS |
| 4860 | 0.410.06 | 0.210.06 | 0.070.04 | NVAS |
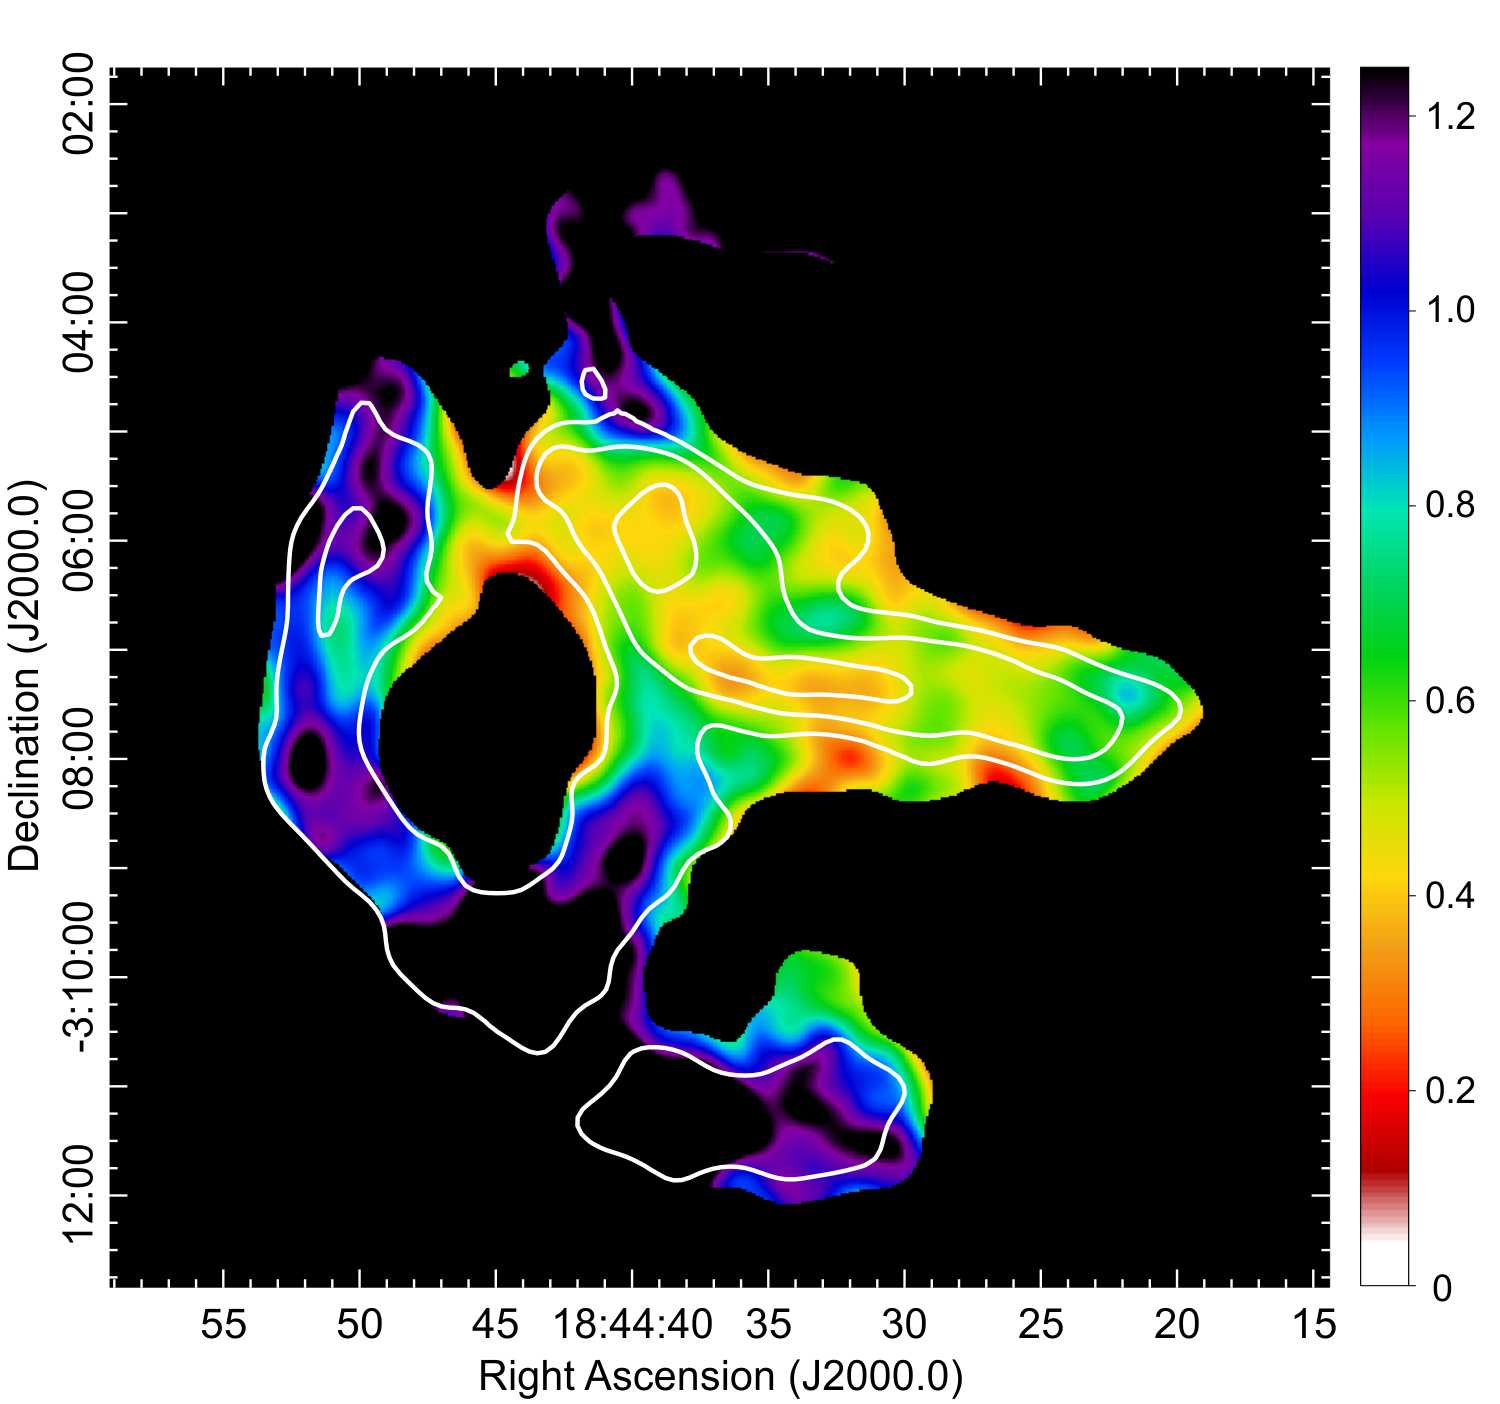
In addition to the global radio continuum spectra, we searched for spectral changes over the different components of the radio source G29.37+0.1. Local variations in the spectral radio index might be interpreted in terms of differences in the underlying physical process that determine the energy of the particles. For this analysis we used the new GMRT image at 610 MHz, together with the image at 1400 MHz from MAGPIS. The latter image combines data from the B, C, and D configurations of the VLA with data from the Effelsberg 100 m telescope and thus does not suffer from the usual interferometric loss in flux. We cautiously note that the datasets from which the spectral indices were derived are not ideally matched to the same uv range, as the visibility data were not available for the image at the higher frequency. We hence constructed the spatially resolved spectral index map shown in Fig. 4 by convolving both frequency images to a common synthesized beam of 20′′, which abstains from any masking effect caused by small scale variations. For the S-like feature in G29.37+0.1 this approach is justified since the reconstruction of the largest and smallest structures is similar at the two frequencies. This situation, however, does not hold for the halo component whose low surface brightness, together with some missing flux in the 610 MHz interferometric map, precludes any detailed spectral analysis. To avoid any positional offsets, the two images were aligned and interpolated to identical projections before calculating spectral indices. In addition, to create the spectral map the 610 and 1400 MHz images were masked at the 4.3 and 3 significance level of their respective noise levels. The uncertainties in the determination of the spectral index from the map range between 0.08 and 0.15 for the brightest and the faintest regions of G29.37+0.1, respectively.
The spectral index map displayed in Fig. 4 shows that the nucleus and the jet region in the S-shaped feature have a flat spectrum with a mean value 0.3, while the northeastern and southwestern radio lobes have average spectral indices of 0.47 and 0.55, respectively. In the northeastern side there is a region which has a flatter spectrum of about 0.38-0.45 (compared with the surrounding lower brightness region of the lobe for which the spectrum ranges from 0.55 to 0.7). This flat spectral region coincides with the bright area observed inside this lobe, which we tentatively associated with a hotspot-like structure (see Fig. 2). Other interesting spectral behaviour occurs in the north-easternmost region of G29.37+0.1, where a very flat spectrum (0.35-0.40) at the site where the X-ray emission was detected (as we discuss later in Sec. 3.2.1). We noticed that the spectral behaviour in the S-like feature is in concordance with that determined in others FRII objects (see for instance Jamrozy et al. 2008 or Orrù et al. 2010) and in radio sources with an hybrid appearance sharing properties of the FRI and FRII-type galaxies (Pirya et al., 2011).
3.2 X-ray analysis of G29.37+0.1
3.2.1 X-ray imaging
To analyze the X-ray surface brightness in G29.37+0.1, we constructed images in different energy bands using the Chandra and XMM-Newton observations. The Chandra data cover the overall radio emission from G29.37+0.1 including the halo region, while the XMM-Newton field completely covers the jet and radio lobes but partially covers the halo seen at radio frequencies. The morphology in the X-ray band as seen by both satellites is similar and, due to its higher angular resolution, Chandra’s images reveal some interesting features that will be pointed out in the next paragraphs.
Using the CIAO tool merge-obs, we combined observations from the projects 11232 and 11801 to construct a mosaicked image of the region. The X-ray image was constructed with a spatial binning of three pixels, which results in a spatial scale of /pixel. The resulting image was then smoothed by using a Gaussian kernel with a radius of 2′′. Figure 5 displays the Chandra image obtained in the energy range 2.5-7.5 keV, in which the X-ray morphology is better distinguished. As can be easily observed, the X rays coincide with the northeastern radio lobe of G29.37+0.1.
Two compact sources were identified in both Chandra and XMM-Newton datasets. For ease of reference, we will call these sources PS1 and PS2 (see Fig. 5). The X-ray emission from PS1 originates mainly in the hard energy band (similar to the diffuse emission), while the emission from PS2 comes also from the soft and medium energy bands (i.e. 0.7-7 keV). We determined the centre of both point sources in the full resolution (i.e. spatial binning = 1) Chandra mosaicked image by running the tool wavdetect in CIAO using the default settings. This tool requires a map of the point spread function (PSF), which was obtained by averaging the individual PSF maps of each observation, weighted by the respective exposure time.555Refer to the CIAO thread http://cxc.harvard.edu/ciao/threads/. To highlight the diffuse emission, we removed the detected discrete X-ray sources from the image before adaptively smoothing it. We used the roi tool in CIAO to create the source and background regions for PS1 and PS2, taking into account the output of the wavdetect tool. Finally, we replaced the source region with an estimate of the local background using dmfilth with POISSON statistic.
A zoomed view of the diffuse X-ray emission in the field (after removing PS1 and PS2) is shown in the inset of Fig. 5. The asymmetric morphology of the X rays can be enclosed in an elliptical shape with an angular size of 65′′ 41′′ on the plane of the sky and its semi-major axis oriented in the northeast-southwest direction. In addition, the close-up image unveils two faint tongues of X-ray emission emanating from the southeast ( long and 16′′ thick) and the southwest (40′′ long and 22′′ thick) sides of the nebula. These are oriented essentially in the north-south direction.
The Chandra observations provide a sufficient number of photons to determine the position of PS1 and PS2 very accurately and hence to identify potential optical and/or infrared counterparts to these sources. From the output of the wavdetect tool, for the source PS1 we obtain an elliptical source region of centred at RA=18h44m, Dec=03∘05′. The central position for the source PS2, derived inside a region , is RA=18h44m, Dec=03∘05′. An enhancement in the X-ray emission is located just to the south of PS1 only separated from the best-fit position of this source by approximately . The sources PS1 and PS2 are respectively catalogued as CXO J18443.4030520 and CXO J18444.1030549 in the Chandra Source catalogue (CSC, Evans et al., 2010), and as 3XMM J184442.9030525 and 3XMM J184441.9030550 in the XMM-Newton Serendipitous Source catalogue (3XMM-DR4, Watson et al., 2009). We used the NASA/IPAC Extragalactic Database (NED) to search for feasible associations of the two sources detected in our Chandra image with extragalactic objects. We found two NED sources separated from PS1 and PS2 by and 3′′, respectively. These angular distances are larger than the average pointing uncertainty of Chandra ( 1′′) and thus the X-ray sources cannot be directly associated with the NED objects. We then analyzed possible near-infrared identifications in the Two Micron All Sky Survey (2MASS) All-Sky catalogue of Point Sources (Cutri et al., 2003), which has an astrometry uncertainty better than . The search was done within a region of 2′′ to account for errors in the determination of the X-ray positions and to minimize the probability of chance coincidence. We found a possible infrared (IR) counterpart located about 1′′ from the X-ray source PS2, but no IR point sources were distinguished within a matching radius of 4′′ around the X-ray source PS1. Examining the Digital Sky Survey (DSS), no obvious optical correlations were identified in association with the X-ray point sources within a 5′′ radius.
3.2.2 X-ray spectroscopy
We used the CIAO tool specextract to obtain the Chandra spectra, and the SAS evselect task for XMM-Newton spectra. For all observations, the backgrounds were selected from circular regions free of diffuse emission and point sources. For each region, we extracted individual spectra from the data reported in Table 1, thus obtaining two spectra for Chandra (corresponding to observations #11232 and #11801) and six spectra for XMM-Newton (corresponding to the MOS1, MOS2, and PN cameras of observations #0602350101 and #0602350201). Then, we combined the spectra to produce a single merged spectrum for Chandra and a single merged spectrum for XMM-Newton, using the CIAO tool combine-spectra and the SAS task epicspeccombine, respectively. During the fitting process, we checked the consistency of the results obtained from the simultaneous fit of the two merged spectra and the results of the simultaneous fit of all the eight spectra. We find that the model parameters always agree and are better constrained when fitting the merged spectra (i.e. confidence ranges are smaller).
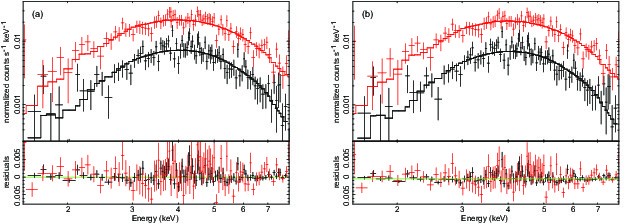
After removing the contribution from the point sources PS1 and PS2, the spectrum of the nebula was extracted from the elliptical region of 65′′ 41′′ centred at RA18h44m43s, Dec-03∘05′ shown in the inset of Fig. 5. The individual merged Chandra and XMM-Newton spectra were grouped with a minimum of 20 and 40 counts per bin, respectively. The two merged spectra were fitted simultaneously in the 1.5-8.0 keV band using Xspec (version 12.8.1) and statistics. The model parameters of the Chandra and XMM-Newton dataset were tied together and only the normalizations were allowed to vary independently to each other to account for different instrumental calibrations between the two telescopes. The merged Chandra and XMM-Newton spectra are shown in Fig. 6. There were 2050 and 3573 counts in the 1.5-8.0 keV band for the Chandra and XMM-Newton spectrum, respectively. The X-ray spectrum of G29.37+0.1 appears as a continuum with no hints of the presence of emission lines.
We fitted the spectrum of the diffuse X-ray emission considering different scenarios. If the X rays are produced in the presumed radio galaxy, the emission may be originated by electrons accelerated at the lobe that radiate through a non-thermal mechanism (synchrotron or inverse Compton) or it may be thermal emission produced by shocked gas surrounding the lobe. Then, we used both a power-law and a bremsstrahlung model to fit the non-thermal and thermal emission, respectively. In our procedure, we included a photoelectric absorption component to model the absorption of the Galactic interstellar medium. The best-fitting model parameters are summarized in Table LABEL:table_X_diffuse. The listed errors correspond to the 90% confidence level.
In the case of an absorbed power-law model ( in the Xspec environment), letting the hydrogen column density and the photon index vary freely, the fit resulted in a good =/ 1.05 ( being the number of degrees of freedom), a Galactic absorption column density of , and a photon index . After correcting for Galactic absorption, the flux666Hereafter, to derive physical properties of the X-ray emission, we use the flux obtained from the Chandra dataset. Using the flux of the XMM-Newton observations yields similar results. in the 1.5-8.0 keV band is 1.6 erg cm-2 s-1. For an assumed redshift 0.05 of the radio emission lobe, we obtain an absorption-corrected luminosity in the 1.5-8.0 keV band of 9.11042 erg s-1, while for =0.01 and =1 the estimated luminosity are 3.41041 erg s-1 and 8.21045 erg s-1, respectively (we present in Sec. 4.1 a further detailed discussion on the redshift estimate to the potential radio galaxy G29.37+0.1).
On the other side, in the case of modelling the X-ray emission with a pure thermal bremsstrahlung component ( in the Xspec environment), for =0.05 the resultant best-fit hydrogen column density and electron temperature () are 8.91022 cm-2 and 14 keV, respectively. The flux in the 1.5-8.0 keV band (corrected for absorption) is 1.410-12 erg cm-2 s-1. In this model, the temperature is not well constrained (8-34 keV for a 90% confidence level) and the best-fit value (14 keV) is much higher than the temperatures measured toward the lobes of other radio galaxies for which a thermal model works well (Grandi et al. 2003; Isobe et al. 2005). Hence, we favour a non-thermal origin for the X-ray emission.
We cannot omit that the obtained absorption parameter for both the non-thermal and thermal models (91022 cm-2) is high compared with the Galactic value 21022 cm-2 measured from HI emission toward RA18h44m, Dec03∘06′23′′ (or 08), the central coordinates of the northeastern lobe (Kalberla et al., 2005). We also tried to fit the X-ray spectrum keeping fixed the hydrogen column density in 21022 cm-2, but we were unable to obtain statistically acceptable fits () for both non-thermal and thermal models. In previous studies of the diffuse X-ray emission from the lobes of radio galaxies, the values of the hydrogen column densities obtained from the fitting are generally similar to the Galactic ones derived from the emission of the HI at 21 cm, typically cm-2 (see for instance Kraft et al. 2003; Isobe et al. 2006; Migliori et al. 2007). However, it is noticeable that in these cases the sources are located well outside the Galactic plane, while the line of sight in the direction of G29.37+0.1 passes through the Galactic disk.
| Model | () | |||||
|---|---|---|---|---|---|---|
| [ cm-2] | [keV] | [10-12 erg cm-2 s-1] | ||||
| Power law | 1.05(172) | 9.58 | 1.76 | - | ||
| Bremsstrahlung | 1.05(172) | 8.96 | - | 13.73 | ||
The apparent correlation between X-ray and radio emission may, however, simply be due to a superposition along the line of sight rather than an X-ray counterpart to the radio emitting plasma in our candidate galaxy. Therefore, as an alternative analysis to the extragalactic scenario, we point out the possibility that the X-ray emission arises from our Galaxy. We found that fitting the spectrum with a power-law model yields a photon index 1.76 (Table LABEL:table_X_diffuse) compatible with that estimated in pulsar wind nebulae (Kargaltsev & Pavlov, 2010), this being another possible origin for the X-ray emission.
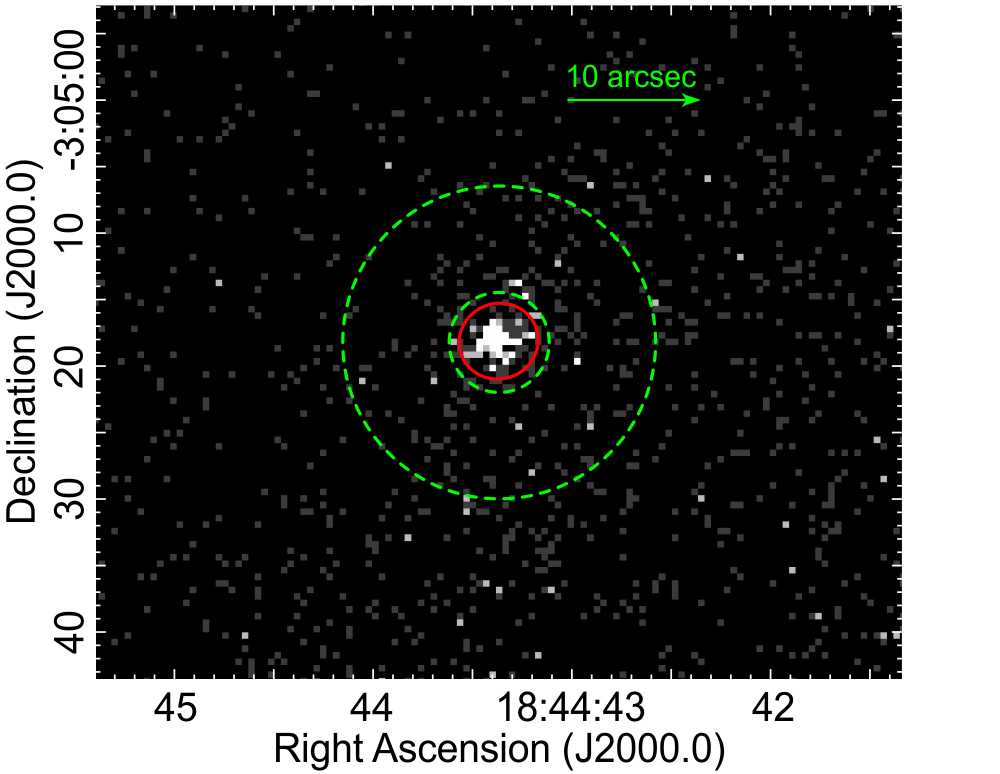
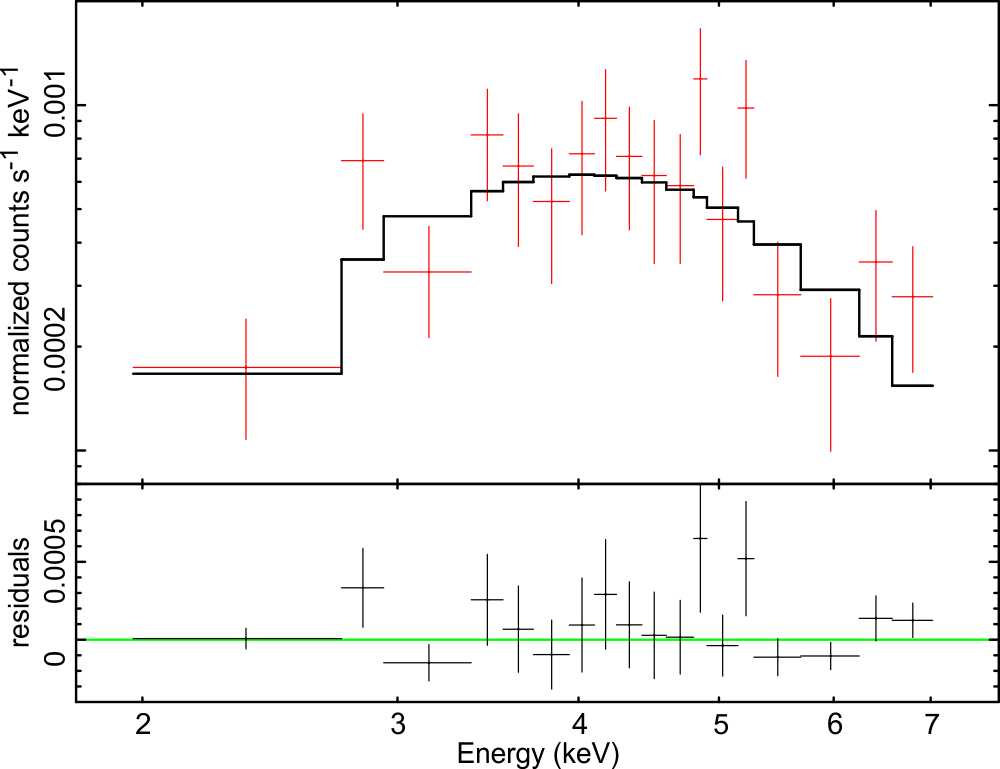
As mentioned above, the X-ray compact sources PS1 and PS2 are superimposed on the diffuse emission. In the next paragraphs, we perform a spectral analysis of their X-ray emission to determine if, in a PWN scenario, they are reliable candidates to be the pulsar which powers the high-energy nebula. We only use Chandra observations to take advantage of the small extent of its PSF, suitable for spectral analysis of point sources. In Fig. 7, we show a full-resolution image of the X-ray emission toward PS1, obtained from the combination of the Chandra datasets. Individual spectra of both Chandra observations were combined into a single merged spectrum, which was grouped with a minimum of eight counts per bin (see Fig. 8). We obtained 148 counts in the 1.5-7.5 keV band. In spite of the low number of counts, the spectral analysis can still provide some insights about the nature of PS1.
The X-ray emission from pulsars may correspond either to thermal emission from the neutron star surface or to non-thermal emission from the magnetosphere. The thermal emission is usually well described by a black body model with a characteristic temperature of 0.1 keV, while the non-thermal spectrum is well described by a power-law model with photon index in the range (Kargaltsev & Pavlov, 2010). We fitted the spectrum of PS1 by considering the absorption column density fixed to the value obtained for the diffuse emission ( ) and as a free parameter. In Table 4 we report the best-fit values obtained using statistics. Due to the low number of counts per bin, we also fitted the spectrum using Cash statistics and found similar parameter values.
| Model | () | |||
| [ ] | [keV] | |||
| Power law | 0.86(16) | 9.58* | – | |
| Power law | 0.91(15) | – | ||
| Black body | 0.95(16) | 9.58* | – | |
| Black body | 1.01(15) | – |
From the results reported in Table 4, we conclude that both power-law and black body models provide similar adequate fits. For the power-law, when is frozen to 9.581022 , the resulting photon index 1.75 is compatible with the values measured toward other pulsars powering PWNe (Kargaltsev & Pavlov, 2010). The absorption-corrected flux in the 1.5-8.0 keV band is 1.3410-13 erg s-1 cm-2. When is a free parameter, its best-fit value is similar to the value toward the diffuse emission, but the errors are larger. In this case, is also badly constrained. Regarding the thermal model (black body), the obtained electron temperatures for both , frozen and free, are 1 keV, a value higher than that expected in a young pulsar (PSR). Fixing keV results in an unacceptable fit (1) for both fixed to and free. Thus, if PS1 is the compact object powering the diffuse emission detected in the direction of G29.37+0.1, its nature is likely non-thermal.
In relation to PS2, this point source presents a variable count rate between the two Chandra observations, increasing from 0.610-2 cts/s (Obs-ID 11232) to 2.110-2 cts/s (Obs-ID 11801) in the 0.7-8.0 keV energy band. For this reason, we fitted both observations separately. We extracted spectra from circular regions of 2′′centred in PS2 and we fitted them with non-thermal (power-law) and thermal (blackbody) models, as we did for PS1. For observation 11232, we obtained 190 counts in the 0.7-8.0 keV band and the power-law model yields a column density 0.21022 cm-2 and a spectral index . For observation 11801, we obtained 611 counts, 0.41022 cm-2 and . The black body fit results in extremely low hydrogen column densities (1013 cm-2) and electron temperatures of 1.3 keV for both observations. We obtained unacceptable fits when we fixed the hydrogen column density to the best-fit value derived for the diffuse emission (=9.581022 cm-2) for both models. Thus, based on the large discrepancy between the column densities derived for the diffuse emission and for PS2, we argue that this point source is not related to the X-ray nebula and conclude that in a PWN scenario PS1 could be the putative pulsar powering the X-ray diffuse emission toward G29.37+0.1.
4 Discussion
In this section, we put together all the pieces of information that we have collected in order to constrain the physical nature of the continuum emission from the puzzling radio source G29.37+0.1. Apart from the radio and X-ray analysis presented in the previous sections, here we examine two basic hypotheses. Firstly, we consider the possibility that the observed radio emission is from an extragalactic object. Secondly, we discuss, on the basis of the distribution of both molecular and atomic gas located in projection adjacent to G29.37+0.1, the alternative idea in which the observed radio and X-ray emission do not originate in a single object but from superimposed structures.
4.1 Extragalactic emission from G29.37+0.1?
4.1.1 The S-like feature in G29.37+0.1
As mentioned above, the observed surface brightness distribution of the S-like feature in G29.37+0.1 is found to be similar to a radio galaxy. Morphological properties, however, are often not sufficient by themselves to classify an extended source as a galaxy, especially if it has a faint magnitude. Classification methods based on infrared colour-colour plots along with the search for optical counterparts are widely used for this purpose (Machalski et al., 2001; Pollo et al., 2010; Kovács & Szapudi, 2015). Using the DSS we have identified the radio core with an optical source at the position RA18h44m, Dec03∘07′. Its optical magnitudes are b15.1, r13.8, i12.3, and v13.6 (Monet et al., 2003; Zacharias et al., 2004). This optical counterpart is very probably determined as a non-stellar object in the USNO-B1.0 catalogue (Monet et al., 2003). We also searched for an infrared counterpart to the optical source using near- and mid-infrared photometry and imaging extracted from 2MASS (Skrutskie et al., 2006). We identified a 2MASS point source, named J184433670307153, lying in the region of the DSS source. No redshift information is available for the identified optical counterpart. Thus, if we assume that the DSS and 2MASS are counterparts to the radio core of G29.37+0.1, and take the well-known infrared K-band versus z relation for radio galaxies into account (Willott et al., 2003), the measured K10.86 mag for the 2MASS source implies a redshift 0.05 for our radio galaxy candidate. In order to gain additional insight into the nature of the nucleus component in G29.37+0.1, we used infrared data extracted from the All-Sky Wide-field Infrared Survey Explorer (AllWISE) Source Catalogue (Mainzer et al., 2011). The four WISE bands from W1 to W4 are centred at wavelengths of 3.4, 4.6, 12, and 22 m, respectively. In the WISE field, the source J184433.65030710.0 is the closest to the nuclear radio component of G29.37+0.1 and hence to its proposed optical counterpart (with an half power beam widht (HPBW) of 6′′ similar to the WISE W1-data, the accuracy of the GMRT image is about 2′′, i.e. 1/3 of its angular resolution). The global magnitudes of the WISE source are W1=8.8520.023, W2=8.7930.023, W3=9.1680.397, and W4=7.0710.522. Figure 9 depicts the 610 MHz radio emission from the central region of G29.37+0.1, illustrated with brightness contours overlaid onto a WISE 3.4 m (W1-band) and DSS optical images. Despite the projected angular offset between the central position of the WISE source and the DSS/2MASS object, if we still consider the WISE source as a plausible counterpart, we could determine the nature of the presumed host galaxy by combining the photometric information of WISE with 2MASS data. Following Kovács & Szapudi (2015), we employed the most sensitive WISE band W1 and the J band from 2MASS to efficiently separate elliptical galaxies from stars. By applying their W1J1.7 colour cut, which guarantees the lowest stellar contamination, we found that the 2MASS source J184433670307153 lies in the galaxy locus of the W1 vs. W1J colour-magnitude plane. In this case, by linking the nuclear component observed at radio wavelengths to the brightest S-shaped morphology in G29.37+0.1, an extragalactic origin for the radio emission observed from this whole structure seems plausible. At this point, it is also necessary to mention that a second 2MASS object (J184433610307095) was also found lying at the centre of the WISE source. In our analysis, we did not consider it to be related to the nuclear emission in G29.37+0.1 due to the lack of an additional optical identification.
In what follows, we estimate a set of basic physical parameters for G29.37+0.1, including the radio luminosity, projected linear size, equipartition magnetic field, and energy density, by adopting the obtained value. However, we recognize that due to the low K-magnitude of the identified 2MASS source, which is somewhat marginal in the K-z relation of Willott et al. (2003), along with our uncertainty in classifying it as the counterpart to the radio core, it is not possible to provide a reliable constraint for the redshift. Hence, the same physical magnitudes were also estimated by adopting an interval 0.011 of probable values for the redshift at G29.37+0.1. This range is consistent with those derived from previous studies of radio galaxies and giant radio galaxies (with projected sizes over Mpc), for example Lara et al. (2001); Willott et al. (2003). Using 0.05, the projected linear size of the 6-arcmin S-shaped structure is 373 kpc (if H0=71 km s-1 Mpc-1, =0.27, and =0.73 are adopted, Spergel et al., 2003), or between 74 kpc and 8 Mpc if a redshift range of 0.011 is considered. In the latter case, G29.37+0.1 would belong to the class of giant radio galaxies. At =0.05 the total 610-MHz luminosity [W Hz-1] has a log value of 25, or it ranges between 23.527.5 for 0.011. Using our estimate for the radio spectral index (0.6), the corresponding logarithmic radio power at 1.4 GHz is 24.8 at =0.05 (or 23.327.4, 0.011). Our results are in broad agreement with those presented by Machalski & Jamrozy (2006), where a range of total power 24.328.6 is measured for a redshift interval from 0.03 to 1.8 in a large sample of selected normal FRII radio sources. We are aware that for redshift values greater than 0.14 (for which the linear size of the S-shaped structure is larger than 1 Mpc), the radio luminosity at 1400 MHz (25.6) falls in the region of transition between FRI and FRII-type large radio galaxies (see Lara et al., 2004).
We also estimate the magnetic field strength, Beq, averaged over the whole S-shaped volume and over each lobe separately. To do this calculation, we consider the minimum energy condition, which roughly implies equipartition of energy densities between fields and relativistic particles. Following the revised formalism proposed by Beck & Krause (2005), we assume a filling factor of unity corresponding to a radio source completely filled by the magnetic field. Regarding the parameter in their equation (A18), which represents the ratio of the number density of protons to that of electrons per particle energy interval, we consider 100 (see also Eq. 7 in Beck & Krause 2005’s work). This value, computed by adopting 0.6 (where is the injection index of the accelerated particles) is in concordance with particle energy content dominated by the protons.
| Component | z | Beq | ueq | |
|---|---|---|---|---|
| [nT] | [10-14 J m-3] | |||
| S-shape | 0.05 | 0.76 | 53.8 | 24.75 |
| 0.01-1 | 1.20-0.32 | 132.6-9.4 | 23.35-27.37 | |
| Northeastern | 0.05 | 0.75 | 52.0 | 24.46 |
| lobe | 0.01-1 | 1.17-0.31 | 127.8-9.1 | 23.06-27.08 |
| Southwestern | 0.05 | 0.72 | 47.53 | 24.1 |
| lobe | 0.01-1 | 1.12-0.30 | 116.8-8.3 | 22.7-26.7 |
In our calculation, we have assumed a cylindrical geometry for the lobes. The size of the lobes was estimated from the lowest radio contour drawn in Fig. 2 with the base diameters equal to the average width of each lobe, and 1′, and lengths of and for the northeastern and southwestern structures, respectively. The total volume of the whole S-shaped structure was determined from the sum of the individual lobe’s volume. The global equipartition parameters estimated for the whole presumed radio galaxy (i.e. the S-shaped feature) and for each lobe in G29.37+0.1 are summarized in Table LABEL:equipartition. It should be pointed out that the spectral break suggested in the radio continuum spectra of both lobes (Fig. 3) prevents the use of a global spectral index for each lobe. Therefore, in determining the physical parameters of the two radio lobes in G29.37+0.1 we used an intermediate spectral index 0.5, a compromise between the values measured between 610 and 1400 MHz in both features. Firstly, we found that similar values of the equipartition magnetic field and energy density were reported in the literature for other FRII radio galaxies also observed with GMRT (Harwood et al., 2016), as well as for a sample of giant radio galaxies (Konar et al., 2008). Considering a smaller value for yields magnetic fields up to three times smaller than those computed assuming dominance of protons (1). We, however, emphasize that these results should be read with caution due to the uncertainties inherent in the redshift determination and in fundamental parameters related to the energy content of the radio emission (e.g. K0, the volume filling factor, or the extent of the source, see Harwood et al. 2016 for a further discussion regarding departure from the equipartition approach). Furthermore, it should not be ignored that there is scarce evidence that equipartition with a magnetic field uniformly distributed in the emitting region actually takes place in lobes of radio galaxies.
4.1.2 X-ray associated with the radio-lobes in G29.37+0.1?
We showed in Sec. 3.2.2 that the most plausible origin of the diffuse X-ray emission is non-thermal. To investigate if the synchrotron process responsible for the radio emission could also produce the observed X-rays, we estimated the X-ray flux predicted by the extrapolation of the radio emission to the keV domain. We used the relation and took the spectral radio index , as derived in Sec.3.1.2 for the northeastern radio lobe. For a reference energy of 1 keV ( Hz), we obtained 10-5 Jy, much higher than the X-ray flux reported in Table LABEL:table_X_diffuse for the power-law fit (9.910-8 Jy in the 1.5-8.0 keV energy band). Thus a simple power-law distribution for the electron population cannot account simultaneously for the radio and X-ray emissions. However, we note that the X-ray spectral index =0.76 is harder than , so both emissions can still be connected if we invoke a spectral break between the radio and the keV bands.
Now we explore the inverse Compton (IC) mechanism as responsible for the emission in the X-ray domain. There are several sources of photons that may be IC-scattered up to X-ray energies in radio galaxies. In high-density electron environments (such as hotspots) the dominant photon population comes from the synchrotron emission and leads to the so-called synchrotron self-Compton mechanism (SSC, Hardcastle et al. 2004). In the low-density lobes of radio galaxies other sources of seed photons are required. The photons from AGN of the galaxy and the cosmic microwave background (CMB) can provide a field to be scattered to keV energies (Croston et al., 2005). A comparison between the energy density of the field of photons from the synchrotron emission, the central AGN, and the CMB has been used to discriminate between different IC scenarios in the lobes of radio galaxies (see Isobe et al. 2002; Grandi et al. 2003; Isobe et al. 2005). Such studies have shown that in FRII sources the CMB is likely to be the main source of low energy photons for the IC process.
If X-ray emission in the northeastern lobe is caused by IC scattering of CMB photons, we can estimate the magnetic field . We follow Harris & Grindlay (1979), who derived an expression for the magnetic field in terms of the the radio continuum spectral index and the radio synchrotron, , and X-ray, , fluxes (adopting the notation of the authors):
| (1) |
where . Here, can be approximated with a value of 1.151031 for 0.52.0. The factor is a correction to account for the IC spectrum produced by the scattering of electrons on the entire black body distribution of CMB photons with a temperature K, instead of considering a monochromatic CMB with 2.7 K photons. The value of was numerically estimated by Harris & Grindlay (1979) for different values of . Taking the spectral index estimated from radio observations for the lobes in G29.37+0.1 (), the corresponding correction factor is =0.5. The magnetic field calculated from the above equation with the reported values of and is expressed in Gauss. We took the radio flux at =1400 MHz for the northeastern lobe F1400MHz=0.54 Jy (see Table LABEL:S-fluxes). In the X-ray band, we used the absorption-corrected flux in the 1.5-8.0 keV from the best-fit power-law model, namely FX=9.910-8 Jy. Thus, from Eq. 1 we obtain B0.0015 nT (or 0.015 G) for z=0.05. The respective magnetic field in the 0.011 interval varies between 0.002 and 0.01 nT. As is evident, there is a substantial difference between the magnetic field strength constrained to the X-ray and radio flux data points and that computed assuming the equipartition condition in G29.37+0.1 to be valid. Several previously published works have noted such a discrepancy (corresponding to (0.3-2.5), e.g. Wilson et al. 2001; Grandi et al. 2003; Harwood et al. 2016) in the lobes of radio galaxies from which the IC X-rays are detected. It is noteworthy that none of the previously published comparisons show differences as significant as that we have found. As argued by Carilli & Taylor (2002), one possibility to explain this issue may be an X-ray emission mainly originated in a thermal process rather than by inverse Compton radiation. We tested a composite model () and found that it produces an acceptable fit. A highly absorbed spectrum is encountered, with a column density 121022 cm-2. The non-thermal component (with a best-fit photon index 2) dominates the entire spectrum, especially the hard band (E¿2 keV). The thermal component (with a best-fit Te0.3 keV) contributes marginally in the lower energy band. Thus, the addition of a thermal component does not produce significant variations in the non-thermal flux of G29.37+0.1 as compared with a simple power-law model. Alternative explanations, to account for the differences in the determination of the magnetic field, include anisotropies in the pitch angle distribution of the cosmic ray electrons or magnetic field concentration in small filamentary structures, which leads to a reduced volume filling factor of the magnetic field (up to 10-2) (Beck & Krause, 2005, and references therein).
Finally, we recall that the radio and X-ray emission may be produced by different sources superimposed along the line of sight (namely, a radio galaxy and a galactic X-ray PWN). If this is the case, the estimation of the magnetic field using Eq. 1 is meaningless and this could account for the unexpected low values derived for this magnitude.
4.2 Galactic emission from G29.37+0.1?
While the morphological properties of G29.37+0.1 (mainly the S-like bright structure) themselves seem well matched to the extragalactic hypothesis, due to its low Galactic latitude, a fortuitous projected positional superposition of other shell-type non-thermal Galactic sources, such as a supernova remnant, cannot be discarded. In this section, we attempt to put constraints on the kinematical distance to the continuum radio emission from G29.37+0.1 on the basis of hydrogen absorption. Additionally, we explore the molecular environment observed in projection toward the radio source using 13CO data. Basically, we search for morphological and kinematic signatures that could account for interstellar gas physically related to either the whole source or some of the radio-synchrotron emitting components (especially its halo component).
4.2.1 Distance constraints
We analyze the kinematic distance to the observed radio synchrotron emission on the basis of neutral hydrogen emission and absorption profiles from the VGPS. Useful spectra were obtained in directions to the northeastern and southwestern lobes and the nucleus, the three main components of the S-shaped feature. In the three cases, the emission spectrum was obtained toward regions where the radio continuum emission is bright, while the corresponding absorption profiles were obtained by subtracting the bright radio emission from nearby regions. No HI spectra were obtained toward the halo due to the low surface brightness of this component.
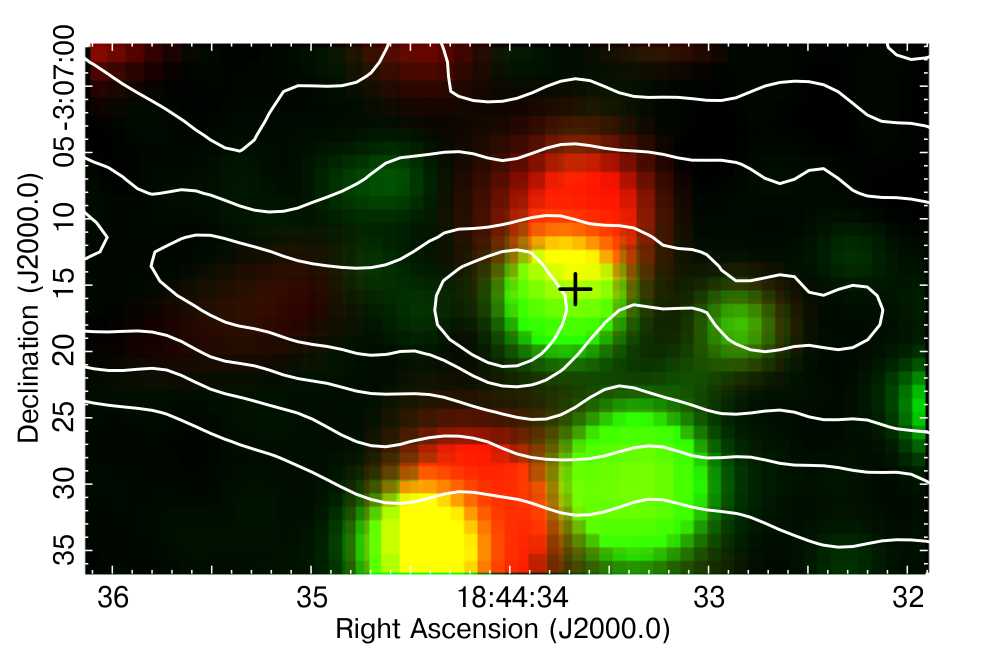
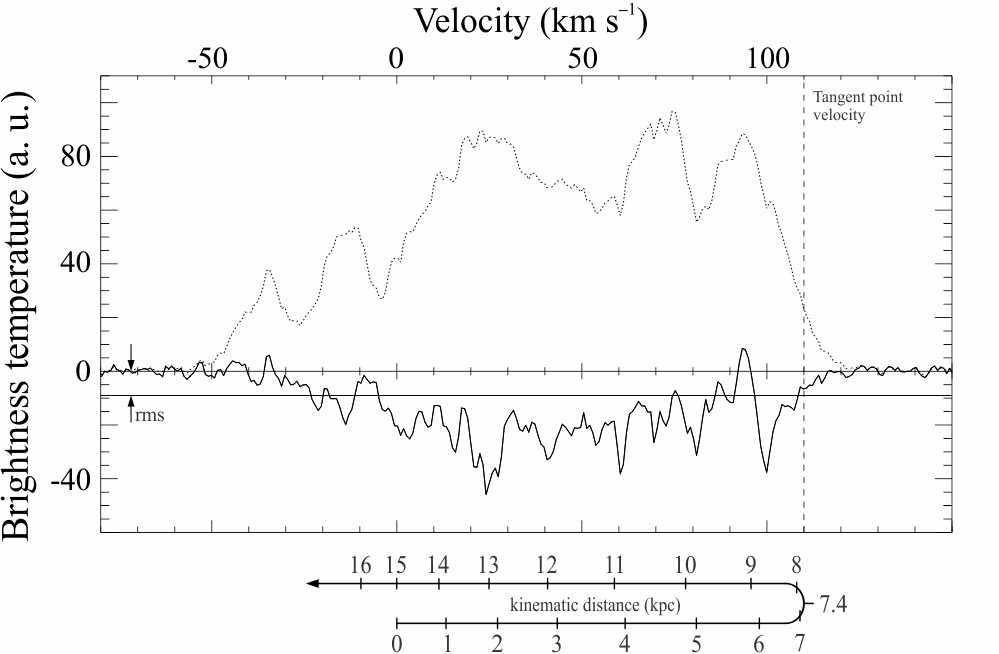
In the direction of the northeastern lobe (see Fig. 10) the HI absorption extends up to the tangential point at 110 km s-1 (all the radial velocities mentioned in this paper are measured with respect to the local standard of rest); the kinematic distance for this feature is 7.4 kpc (converting velocities with the rotation model of the Milky Way of Fich et al., 1989, with the Galactocentric distance R0=8.5 kpc and the rotation velocity at the Sun =220 km s-1). In addition, at negative velocities HI absorption is observed roughly at 21 and 14 km s-1, although the signal-to-noise ratio is somewhat low. The kinematic distances corresponding to the negative features are 17.4 and 16.5 kpc, respectively. Taking all the HI spectra properties into account, we derive a lower distance limit d17.4 kpc to the bright northeastern radio lobe of G29.37+0.1. Similar HI absorption and emission spectra are measured against the nucleus and the southwestern radio lobe in G29.37+0.1 (not shown here), but the negative velocity components are more pronounced than those observed toward the eastern side. Consequently, the distance to both components is likely to be 17.4 kpc. This result disagrees with that obtained by Johanson & Kerton (2009) toward the source named G29.3667+0.1000, which according to its name which is derived from its position, corresponds to G29.37+0.1. It is considered by the authors as a SNR candidate located at a poorly determined distance between 5.2 and 15.8 kpc.
Even with the HI profiles in hand, ascribing distance to G29.37+0.1 is not straightforward. In light of the results presented here, it is evident that the HI spectra do not permit us to confirm or reject an extragalactic origin for either the whole emission from G29.37+0.1 or some of its components, and some further information is required. Although only a lower distance limit was derived from the absorption profiles, the detection of absorption at negative velocities makes it plausible that these features are due to all the absorbing gas in the direction of the suspected radio galaxy traced by the S-shaped morphology.
4.2.2 The molecular gas
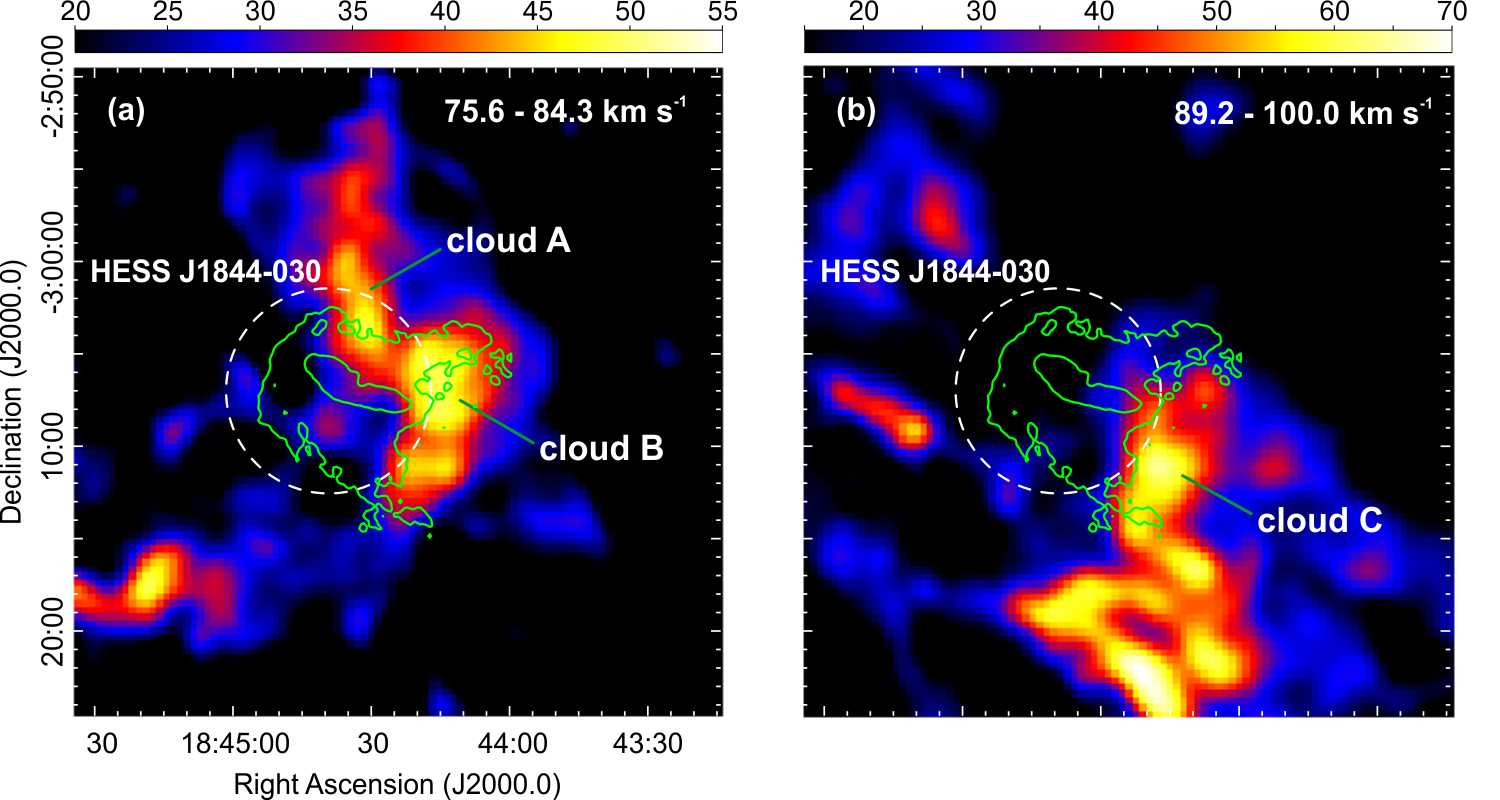
The inspection of the molecular gas throughout the range of velocities covered by the GRS shows a non-uniform distribution of the 13CO lying in projection within the region of the G29.37+0.1/HESS J1844030 system in the velocity range from 75 to 100 km s-1. In particular, we identified three molecular clouds, named in what follows as clouds A, B, and C. The morphology of these clouds may be suggestive of an association between them and the halo-like component in G29.37+0.1, for which we were not able to set a distance limit using HI absorption spectra due to its low surface brightness. Up to date, a notable diversity in morphology and brightness has been identified in Galactic SNRs interacting with their surroundings777See http://astronomy.nju.edu.cn/ ygchen/others/bjiang/interSNR6.htm for an extensive list of Galactic SNRs interacting with molecular clouds. and thus, in the alternative scenario proposed here, the halo morphology would represent a new case of a distorted SNR expanding into the inhomogeneities of the ISM. The detected molecular clouds are presented in Fig. 11, where contours of the radio emission from the MAGPIS-1400 MHz image at 6′′ resolution are included for reference. Figure 11a displays the emission integrated from 75.6 to 84.3 km s-1, the range of velocities in which clouds A and B are found, while Fig. 11b shows the molecular emission integrated between 89.2 and 100.0 km s-1, the range of velocities corresponding to cloud C.
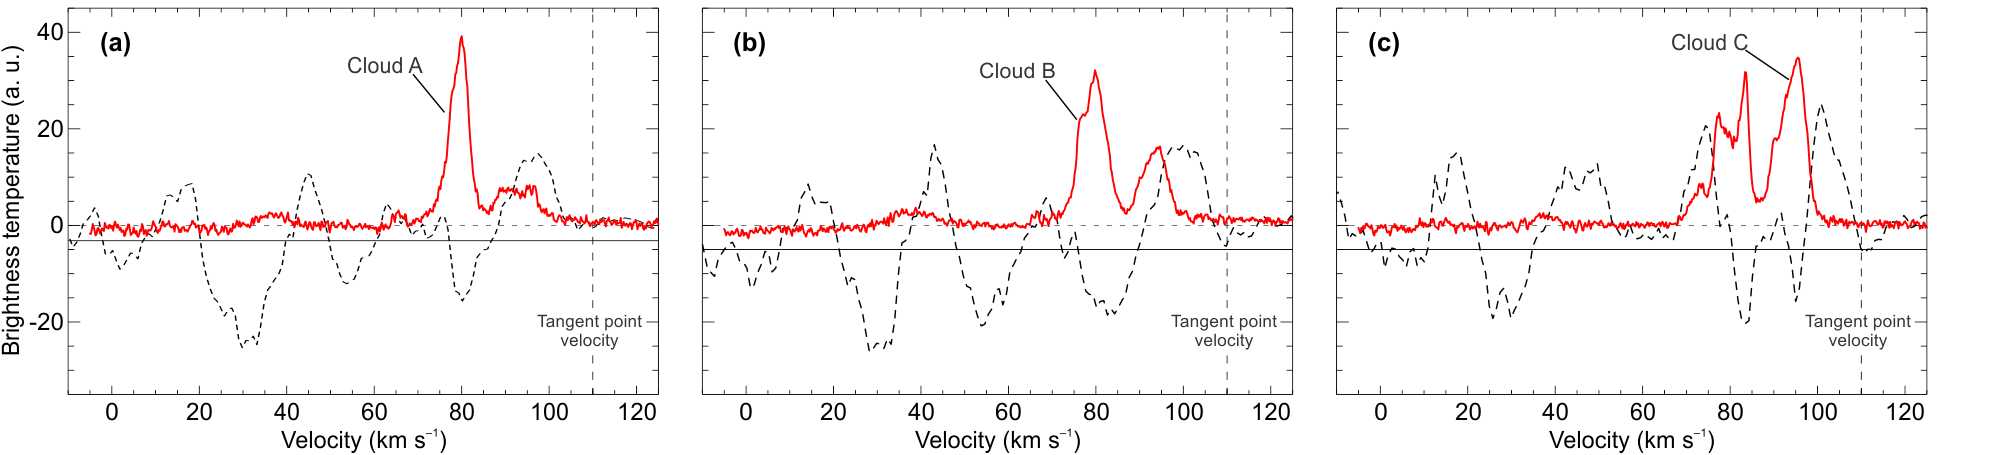
While the observed alignment of the molecular emission and the halo in G29.37+0.1 may be coincidental, we further explore for kinematical signatures of the presumed interacting molecular gas. The 13CO average spectrum for each cloud is displayed in Fig. 12. They were obtained by using a box centred at the brightest clumps of clouds A, B, and C (the clumps are roughly 3′ in size). Along with the emission spectra, the HI absorption profile toward each clump is shown in Fig. 12 as dashed lines. These absorption spectra were constructed by subtracting the HI emission profile from a spectrum averaged over different regions adjacent to each molecular cloud. For all the clouds, several HI absorption peaks are present up to the velocity of the molecular cloud, but it is noticeable that no absorption features are present at higher velocities (up to the tangent point). In order to assign a distance to the corresponding CO clouds, we used the Galactic rotation curve of Fich et al. (1989). Then, the corresponding near and far distances are: 5.0/9.9 kpc for cloud A, 5.1/9.8 kpc for cloud B, and 5.8/9.0 kpc for cloud C. To solve this kinematic distance ambiguity (KDA) and determine a unique distance to each cloud, we can observe that the clouds only marginally overlap the continuum emission from the halo, and in the weakest parts of it (Fig. 11). Then, to a good approximation, we can consider that they are not superposed to any continuum source. In this scenario, the HI absorption peaks seen in the spectra of Fig. 12 are ascribed to the absorption of the warm Galactic HI filling the interstellar medium along the line of sight by the cooler HI embedded in the molecular clouds. If the corresponding cloud were beyond the tangent point, there should not be absorption coincident with the emission peak, since the HI gas at the same radial velocity at the near distance would be emitting too. Therefore, as this is not the case for the three clouds, these are in the foreground of the tangent point and we assign the near distance to all of them. Taking into account the involved uncertainties, the distances are: kpc for cloud A, kpc for cloud B, and kpc for cloud C. Details about this procedure to solve the KDA for molecular clouds from their spectral characteristics can be found in Roman-Duval et al. (2009).
None of the molecular clouds show direct kinematic evidence (like broadenings in the molecular spectra, asymmetries in the profiles, etc) of interaction with the halo in G29.37+0.1. However, these spectral signatures, often associated with perturbations in the velocities field of the molecular gas caused by the passage of a shock front, are not conclusive. Several molecular clouds without kinematic spectral signatures are known to be interacting with SNRs. If this is the case, then the outer radio emitting component in G29.37+0.1 could be explained in terms of a supernova remnant impacting the surrounding material.
For the sake of completeness, we analyzed the physical properties of the molecular gas. In Table LABEL:fit-parameters we summarize for each cloud the central velocity and the FWHM velocity, the peak brightness temperature, the mass, and the corresponding total proton volume density (atomic plus molecular contents). Since the profiles are clearly non-gaussian, the listed parameters are only mean representative values. Additionally, we followed the procedure presented in Castelletti et al. (2013) to calculate the H2 column density of the identified molecular material and used this value, together with the corresponding distance that we derived for each cloud, to compute the total mass of the clouds. For clouds A, B, and C we assumed regions (elliptical for A, and circular for B and C) with physical sizes of approximately 6′, and 3′ in diameter, respectively. The uncertainties in the mass calculation are estimated to be about 30% and arise from the velocity range in which we detect the molecular material that forms the cloud, the definition of the integration region, the estimation of the background temperature, and the assumed distances.
| Cloud | Mass | Density | |||
|---|---|---|---|---|---|
| [K] | [km s-1] | [km s-1] | [M⊙] | [cm-3] | |
| A | 2.3 0.4 | 80.1 1.1 | 4.8 0.7 | 2150650 | 840300 |
| B | 1.7 0.2 | 81.5 1.1 | 8.1 1.7 | 1700500 | 910350 |
| C | 1.7 0.3 | 94.2 1.1 | 8.8 1.3 | 2100600 | 1200400 |
4.3 Plausible origins for the rays from HESS J1844030
In this section we use our findings in order to address the problem of the origin of the -ray emission presumably associated with G29.37+0.1. The extension of the -ray excess in HESS J1844030 is similar to the point-spread function of the H.E.S.S. telescope. This fact favours an extragalactic origin for the production of the TeV emission and is consistent with our interpretation of the radio synchrotron emission from G29.37+0.1 as a new radio galaxy. To date, rays in extragalactic sources have been attributed both to the leptonic process in which relativistic electrons in the lobes of radio galaxies are IC scattered-off by lower-energy ambient photons (CMB or extragalactic background light photons) or hadronic emission from cosmic rays interacting with the lobes (McKinley et al., 2015). There are some indications that the detected rays are predominantly originated in the radio lobes rather than the central core region (e.g. Centaurus A, Abdo et al. 2010). In our case the available TeV data do not allow distinction between -ray contributions from the core and the lobes. In a Galactic context for HESS J1844030, in which the X-ray emitting region could be a pulsar wind nebula, a leptonic origin for the TeV emission via the IC process of accelerated electrons (perhaps from the source PS1) might be a plausible explanation.
Recently, in the region of HESS J1843033 the High Altitude Water Cherenkov (HAWC) observatory has detected, with a post-trial significance of 4.7 , the extended -ray source 1HWC J1844031C (Abeysekara et al., 2016). This emission, whose nature was not identified, is centred at RA18h44m, Dec (RA=, Dec=) and separated by from the HESS source. Although an association with HESS J1843033 was suggested, the morphology of the HAWC source extended toward the -ray pulsar wind nebula HESS J1846029 (Djannati-Ataï et al., 2008) makes this possibility questionable.
5 Concluding remarks
In this work, we utilized new continuum observations from GMRT at 610 MHz together with a MAGPIS image at 1400 MHz to conduct the first detailed study of the radio source G29.37+0.1. In order to obtain a coherent picture of this object, we also analyzed archival X-ray data collected by XMM-Newton and Chandra, and investigated the molecular and atomic gas in the direction of the source. Our study revealed that:
(1) Radio morphology and spectral properties: At radio wavelengths, G29.37+0.1 consists of lobes and jets oriented symmetrically around a bright central nuclear region, which is reminiscent of a radio galaxy morphology. Furthermore, the new radio image at 610 MHz and that at 1400 MHz from MAGPIS for the source clearly reveal an extended region of weak emission, namely the halo, that surrounds the bright components in G29.37+0.1. The astrophysical connection of this structure with the lobes, jets, and the nucleus is not straightforward; its possible interaction with molecular material favours a Galactic origin for this emission. The computed global radio continuum spectrum of the S-feature in G29.37+0.1 (0.6) is unambiguously produced by a synchrotron source. Additionally, the spectral distribution over the source (0.3-0.7) is compatible with values observed in radio galaxies.
(2) Physical properties of the radio continuum emission: Considering an extragalactic origin for G29.37+0.1, the linear size of this source is 370 kpc for a redshift z0.05 estimated using the K-z relation on the optical and infrared counterparts to the candidate radio galaxy nucleus. At the mentioned redshift, the estimated 610 MHz luminosity is 1025 W Hz-1, entirely in concordance with typical luminosities of radio galaxies and thus providing further hints on the extragalactic nature of the source. The uncertainty in these calculations is dominated by our redshift determination. For a range 0.01¡¡1 where most of the radio galaxies are detected, the luminosity at 610 MHz of G29.31+0.1 varies from 1023.5 to 1027.5 W Hz-1. Using simple energetic considerations in a revised equipartition formalism for a plasma dominated by protons (K0=100), the resulting magnetic field of the source varies between 1.20 and 0.32 nT for the quoted redshift range.
(3) X-ray emission properties: The X rays detected in the direction of G29.37+0.1 are suggestive of an association with the radio lobe emission in the northeastern part of the source. Based on the X-ray spectrum alone, a single non-thermal model modified by Galactic absorption proves adequate to explain the observed diffuse X-ray emission. In the case of an extragalactic origin for the X rays, the magnetic field strength is significantly lower than those typically measured in the lobes of radio galaxies, upon the assumption that all of the X-ray flux is originated by IC scattering of CMB photons, and it is also far from the field strength obtained assuming equipartition condition in the northeastern lobe of G29.37+0.1. A Galactic PWN is a more plausible origin for the X-ray emission and the radio halo would represent the shell of a SNR. The source PS1 would be the most likely pulsar candidate powering the proposed nebula. Clearly, explanations in this area deserve further detailed observations and theoretical considerations.
(4) Surrounding environment: On the basis of HI absorption spectra against the S-shaped morphology, we determined a kinematic distance greater than 17.4 kpc for this component in G29.37+0.1. In addition, we have identified a complex of strong molecular emission which lies in projection around G29.37+0.1. The molecular material seems to match (in projection) the faint outer emission around the radio source, which is suggestive of an interaction. Mass and density estimates derived from CO and HI gas components give in each cloud averaged values of 2000 M⊙ and 1000 cm-3.
(5) The shape of the TeV excess at the position of the source G29.37+0.1 is compatible with that expected from a point source given the HESS point-spread function. This fact, together with our interpretation of the observed radio emission as being produced in a new radio galaxy, suggest that HESS J1844030 could represent a new case of an extragalactic -ray emitting source.
Consequently, we propose that G29.37+0.1 is the superposition of a radio galaxy (the S-like feature) and a composite SNR with a shell (the radio halo component), a pulsar powered component (the diffuse X-ray emission), and perhaps even the neutron star (the source PS1). Our results highlight the effectiveness of high-resolution and high-sensitivity low radio frequency observations in resolving down to a few arcsec both morphological and spectral features across all the potential counterparts to the TeV -ray emission. Radio galaxies are, of course, common features on wide-field, low frequency radio images. However, for lines of sight through the inner Galaxy, they are a source of confusion with SNRs since their spectra are similar. Our observations are important for identifying one such confusing source for future observers. Conversely, this newly identified radio galaxy now serves as a good background target, for example for measuring thermal ISM continuum absorption at even lower frequencies. Finally, we point out that next-generation ground-based -ray instruments as the Cherenkov Telescope Array, will have the spatial resolution and sensitivity required to distinguish between the spatial contributions of rays from the different components detected at radio frequencies.
References
- Abdo et al. (2010) Abdo, A. A., Ackermann, M., Ajello, M., et al. 2010, Science, 328, 725
- Abeysekara et al. (2016) Abeysekara, A. U., Alfaro, R., Alvarez, C., et al. 2016, ApJ, 817, 3
- Acero et al. (2016) Acero, F., Ackermann, M., Ajello, M., et al. 2016, ApJS, 224, 8
- Acero et al. (2013) Acero, F., Ackermann, M., Ajello, M., & et al. 2013, ApJ, 773, 77
- Ackermann et al. (2015) Ackermann, M., Ajello, M., Atwood, W. B., et al. 2015, ApJ, 810, 14
- Beck & Krause (2005) Beck, R. & Krause, M. 2005, Astronomische Nachrichten, 326, 414
- Carilli & Taylor (2002) Carilli, C. L. & Taylor, G. B. 2002, ARA&A, 40, 319
- Castelletti et al. (2013) Castelletti, G., Supan, L., Dubner, G., Joshi, B. C., & Surnis, M. P. 2013, A&A, 557, L15
- Condon et al. (1998) Condon, J. J., Cotton, W. D., Greisen, E. W., et al. 1998, AJ, 115, 1693
- Cornwell & Perley (1992) Cornwell, T. J. & Perley, R. A. 1992, A&A, 261, 353
- Crossley et al. (2008) Crossley, J. H., Sjourman, L. O., Fomalont, E. B., & Radziwill, N. M. 2008, in Proc. SPIE, Vol. 7016, Observatory Operations: Strategies, Processes, and Systems II, 70160O
- Croston et al. (2005) Croston, J. H., Hardcastle, M. J., Harris, D. E., et al. 2005, ApJ, 626, 733
- Cutri et al. (2003) Cutri, R. M., Skrutskie, M. F., van Dyk, S., et al. 2003, VizieR Online Data Catalog, 2246, 0
- Djannati-Ataï et al. (2008) Djannati-Ataï, A., deJager, O. C., Terrier, R., Gallant, Y. A., & Hoppe, S. 2008, International Cosmic Ray Conference, 2, 823
- Evans et al. (2010) Evans, I. N., Primini, F. A., Glotfelty, K. J., et al. 2010, ApJS, 189, 37
- Fanaroff & Riley (1974) Fanaroff, B. L. & Riley, J. M. 1974, MNRAS, 167, 31P
- Fich et al. (1989) Fich, M., Blitz, L., & Stark, A. A. 1989, ApJ, 342, 272
- Gopal-Krishna & Wiita (2000) Gopal-Krishna & Wiita, P. J. 2000, A&A, 363, 507
- Grandi et al. (2003) Grandi, P., Guainazzi, M., Maraschi, L., et al. 2003, ApJ, 586, 123
- Green (2014) Green, D. A. 2014, Bulletin of the Astronomical Society of India, 42, 47
- Gregory et al. (1994) Gregory, P. C., Vavasour, J. D., Scott, W. K., & Condon, J. J. 1994, ApJS, 90, 173
- Hardcastle et al. (2004) Hardcastle, M. J., Harris, D. E., Worrall, D. M., & Birkinshaw, M. 2004, ApJ, 612, 729
- Harris & Grindlay (1979) Harris, D. E. & Grindlay, J. E. 1979, MNRAS, 188, 25
- Harwood et al. (2016) Harwood, J. J., Croston, J. H., Intema, H. T., et al. 2016, MNRAS, 458, 4443
- Helfand et al. (2006) Helfand, D. J., Becker, R. H., White, R. L., Fallon, A., & Tuttle, S. 2006, AJ, 131, 2525
- Helfand et al. (1989) Helfand, D. J., Velusamy, T., Becker, R. H., & Lockman, F. J. 1989, ApJ, 341, 151
- Hoppe (2008) Hoppe, S. 2008, International Cosmic Ray Conference, 2, 579
- Isobe et al. (2005) Isobe, N., Makishima, K., Tashiro, M., & Hong, S. 2005, ApJ, 632, 781
- Isobe et al. (2006) Isobe, N., Makishima, K., Tashiro, M., et al. 2006, ApJ, 645, 256
- Isobe et al. (2002) Isobe, N., Tashiro, M., Makishima, K., et al. 2002, ApJ, 580, L111
- Jackson et al. (2006) Jackson, J. M., Rathborne, J. M., Shah, R. Y., et al. 2006, ApJS, 163, 145
- Jamrozy et al. (2008) Jamrozy, M., Konar, C., Machalski, J., & Saikia, D. J. 2008, MNRAS, 385, 1286
- Johanson & Kerton (2009) Johanson, A. K. & Kerton, C. R. 2009, AJ, 138, 1615
- Kalberla et al. (2005) Kalberla, P. M. W., Burton, W. B., Hartmann, D., et al. 2005, A&A, 440, 775
- Kargaltsev & Pavlov (2010) Kargaltsev, O. & Pavlov, G. G. 2010, X-ray Astronomy 2009; Present Status, Multi-Wavelength Approach and Future Perspectives, 1248, 25
- Konar et al. (2008) Konar, C., Jamrozy, M., Saikia, D. J., & Machalski, J. 2008, MNRAS, 383, 525
- Kovács & Szapudi (2015) Kovács, A. & Szapudi, I. 2015, MNRAS, 448, 1305
- Kraft et al. (2003) Kraft, R. P., Vázquez, S. E., Forman, W. R., et al. 2003, ApJ, 592, 129
- Lara et al. (2001) Lara, L., Cotton, W. D., Feretti, L., et al. 2001, A&A, 370, 409
- Lara et al. (2004) Lara, L., Giovannini, G., Cotton, W. D., et al. 2004, A&A, 421, 899
- Li et al. (1991) Li, Z., Wheeler, J. C., Bash, F. N., & Jefferys, W. H. 1991, ApJ, 378, 93
- Machalski & Jamrozy (2006) Machalski, J. & Jamrozy, M. 2006, A&A, 454, 95
- Machalski et al. (2001) Machalski, J., Jamrozy, M., & Zola, S. 2001, A&A, 371, 445
- Mainzer et al. (2011) Mainzer, A., Bauer, J., Grav, T., et al. 2011, ApJ, 731, 53
- McKinley et al. (2015) McKinley, B., Yang, R., López-Caniego, M., et al. 2015, MNRAS, 446, 3478
- Migliori et al. (2007) Migliori, G., Grandi, P., Palumbo, G. G. C., Brunetti, G., & Stanghellini, C. 2007, ApJ, 668, 203
- Monet et al. (2003) Monet, D. G., Levine, S. E., Canzian, B., et al. 2003, AJ, 125, 984
- Morabito et al. (2016) Morabito, L. K., Deller, A. T., Röttgering, H., et al. 2016, MNRAS, 461, 2676
- Orrù et al. (2010) Orrù, E., Murgia, M., Feretti, L., et al. 2010, A&A, 515, A50
- Owen et al. (2000) Owen, F. N., Eilek, J. A., & Kassim, N. E. 2000, ApJ, 543, 611
- Pacholczyk (1970) Pacholczyk, A. G. 1970, Radio astrophysics. Nonthermal processes in galactic and extragalactic sources
- Perley & Butler (2013) Perley, R. A. & Butler, B. J. 2013, ApJS, 204, 19
- Perley & Butler (2016) Perley, R. A. & Butler, B. J. 2016, ArXiv e-prints
- Pirya et al. (2011) Pirya, A., Nandi, S., Saikia, D. J., & Singh, M. 2011, Bulletin of the Astronomical Society of India, 39, 547
- Pollo et al. (2010) Pollo, A., Rybka, P., & Takeuchi, T. T. 2010, A&A, 514, A3
- Roman-Duval et al. (2009) Roman-Duval, J., Jackson, J. M., Heyer, M., et al. 2009, ApJ, 699, 1153
- Skrutskie et al. (2006) Skrutskie, M. F., Cutri, R. M., Stiening, R., et al. 2006, AJ, 131, 1163
- Spergel et al. (2003) Spergel, D. N., Verde, L., Peiris, H. V., et al. 2003, ApJS, 148, 175
- Stil et al. (2006) Stil, J. M., Taylor, A. R., Dickey, J. M., et al. 2006, AJ, 132, 1158
- Tammann et al. (1994) Tammann, G. A., Loeffler, W., & Schroeder, A. 1994, ApJS, 92, 487
- Torii et al. (1998) Torii, K., Kinugasa, K., Katayama, K., Tsunemi, H., & Yamauchi, S. 1998, ApJ, 503, 843
- Watson et al. (2009) Watson, M. G., Schröder, A. C., Fyfe, D., et al. 2009, A&A, 493, 339
- Weżgowiec et al. (2016) Weżgowiec, M., Jamrozy, M., & Mack, K.-H. 2016, Acta Astron., 66, 85
- Willott et al. (2003) Willott, C. J., Rawlings, S., Jarvis, M. J., & Blundell, K. M. 2003, MNRAS, 339, 173
- Wilson et al. (2001) Wilson, A. S., Young, A. J., & Shopbell, P. L. 2001, ApJ, 547, 740
- Zacharias et al. (2004) Zacharias, N., Monet, D. G., Levine, S. E., et al. 2004, in Bulletin of the American Astronomical Society, Vol. 36, American Astronomical Society Meeting Abstracts, 1418