Classical novae vs cataclysmic variables
Abstract:
We present a preliminary comparison of the post-nova population with that of general cataclysmic variables (CVs). We particularly focus on the mass-transfer rate and its potential relation to the nova eruption. We find that the known post-nova sample exclusively consists of high mass-transfer CVs, but that this is more likely to be due to the shorter recurrent time for those systems, rather than the mass-transfer rate being affected by the eruption. Nevertheless, we find evidence for such an effect for specific post-novae, and that it is potentially related to the binary separation and to presence or absence of an accretion disc.
1 Introduction
A statistical comparison of CVs that have undergone a nova eruption (hereafter called ‘post-novae’) and those that are not known to have done that (hereafter referred to as ‘non-novae’) should indicate the physical parameters that are important for the nova eruption as well as the effect of the nova eruption on the parameters. For this, both samples need to be of a size that allows for a statistical significant comparison. However, for most questions, the sample of the post-novae does not fulfil this requirement. On the one hand this is due to the inherent small number of novae. These are comparatively rare events, and the number of registered nova eruptions that occurred before 1986 amounts to little more than 220 (compared to the over 3000 known CVs, e.g. [3]). On the other hand, the usable sample is even much smaller, because more than half of those reported novae still lack the identification of the post-nova system. Over the past few years, our group has conducted a survey of previously unidentified post-novae in order to recover and classify them [27, 30, 31, 5, 6]. In spite of these efforts, an analysis of the sample is still plagued by small-number statistics. Nevertheless, while being aware of this difficulty, in the present, preliminary, study we will investigate the properties of the available sample of post-novae to search for a possible connection to CV parameters.
We here concentrate on the possibly most important parameter for the nova eruption, the mass-transfer rate . It is immediately clear that a high mass-transfer rate will result in a shorter nova eruption recurrence time, as less time is needed to pile up the critical mass on the white dwarf. Additionally, it has been shown that for lower a larger amount of mass needs to be accumulated to trigger the nova eruption, thus augmenting this effect [32, 33]. The influence of on the nova eruption thus appears to be obvious, but in which way and amount does the latter affect the former? In the hibernation model, the eruption-heated white dwarf irradiates the donor star and causes a phase of enhanced [25, 20]. As the white dwarf cools down, decreases, potentially including a prolonged state of a detached system. This model describes a cyclic behaviour from the nova eruption over a high CV (with ; e.g. [34]) to a low CV () and back (see also [35]), with the necessary ingredient that all post-novae have high . The opposite possibility is that the novae originate from the individual pools of high or low CVs, i.e. either pre- and post-nova are high CVs or they are low CVs. In other words, the nova eruption would have negligible influence on the post-nova’s . Also for this model one would expect the large majority of post-novae to have high , because of the much shorter eruption recurrence time, but there should exist a considerable number of low post-novae, since low CVs represent between 70 and 99 per cent of the CV population [26, 13]. Finally, there is the intermediate case, that is affected by the nova eruption only for a certain subsample of CVs, e.g. distinguished by containing a low-mass white dwarf or having a short orbital period [19, 16, 24].
2 Mass-transfer rates in post-novae
The quantitative determination of is difficult, depending on accretion disc models and distance determinations. In the following we list qualitative indicators and the potential pitfalls associated with them.
2.1 Spectral indicators
High discs are optically thick, resulting in weak emission lines superposed on a blue continuum. For a steady-state disc, the spectral energy distribution (SED) for wavelength follows an exponential law as with [14]. For lower , the slope decreases, and once the stellar components begin to significantly contribute to the SED in the visual range, it no longer can be described by the form above. Most novae are located in the Galactic disc [4], and thus the determination of the intrinsic SED is hampered by interstellar reddening. While some attempts have been undertaken to correct for this effect using large-scale reddening maps (e.g. [22] for [27, 30, 31]), this really needs data with high spectral resolution in order to measure interstellar absorption lines.
The strength of the emission lines from the disc is inversely related to the disc brightness and thus to [18]. However, in CVs the lines frequently include contribution from additional emission sources, e.g. from the bright spot. In post-novae, specifically, irradiation of the donor star by the hot white dwarf can result in additional line emission (e.g., [28]). Furthermore, emission from the nova shell will contribute to the optical spectrum for a considerable amount of time after the nova eruption. While we restrict our study to post-novae that are ‘older’ than 30 years in order to minimize this effect, there are some systems that show significant contribution from the shell much longer than that [6].
The problems with using the emission line strengths as an indicator for are best illustrated using the work from Zhao & McClintock on the eclipsing old nova OY Ara (N Ara 1910) [37]. This object is one of the post-novae with the strongest Balmer emission lines, the equivalent width of H amounting to Å. Using Patterson’s relation [18], its disc brightness results to 8.5 mag, placing it among the high dwarf novae like AH Her and Z Cam. However, the time-resolved spectra show a strong dependency of the emission line strengths on the orbital phase, with maximum strength corresponding to orbital phase 0.8. It can thus be assumed that emission from the bright spot contributes significantly to the emission line. In fact, the eruption parameters lead Zhao & McClintock to estimate the disc brightness to 3.6 mag, a value that should correspond to Å.
2.2 Eruption amplitude
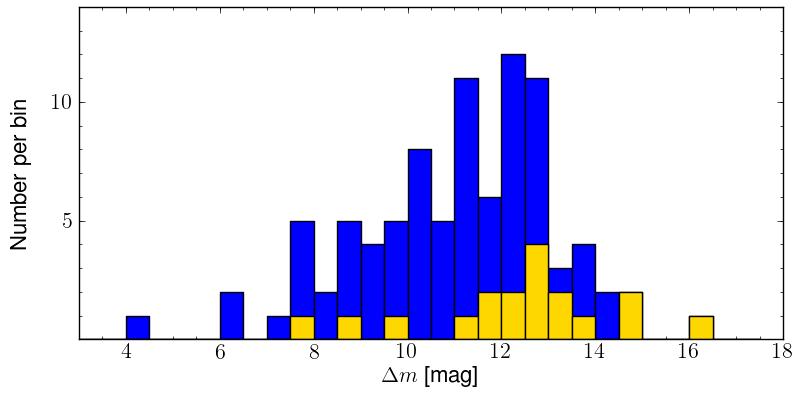
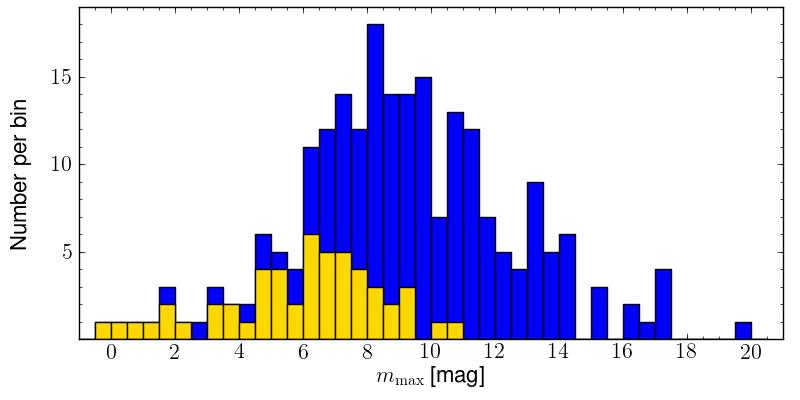
The brightness of accretion discs in CVs spreads over 9 mag [18], while the brightness at maximum for novae ranges from to mag [2, 12, 7]. Thus, the spread in an eruption amplitude , i.e. defined as the difference between the brightness at maximum and the brightness of the post-nova , will mainly reflect the spread in the quiescence magnitude of the post-novae. Essentially, low post-novae will have larger than high systems. Potential pitfalls are here that the post-nova brightness depends on the system inclination (edge-on systems are fainter), and that the nova had not been observed at its actual maximum brightness, resulting in a fainter recorded .
The faint end of the absolute brightness of novae at maximum amounts to roughly 6.5 mag in the visual range [36], while low CVs (dwarf novae) typically have absolute quiescence brightness 8.0 mag. This yields a lower limit of 14.5 mag for the amplitude of a post-nova to reach even only the high end of the dwarf novae. The distribution of the eruption amplitudes of the pre-1986 novae (left plot in Fig. 1) shows that there is no currently known non-magnetic system that passes this limit. However, the shape of the distribution, in particular the abrupt drop in numbers at mag, indicates the presence of an observational bias. It appears reasonable to define a post-nova with a quiescence brightness of about 22 mag as ‘hard to detect’. Thus, all novae with apparent maximum brightness mag and 14.5 mag fall into this category. From the right plot in Fig. 1 we see that this concerns only 37 per cent of the known post-novae, but about 87 per cent of the yet unidentified systems. It is thus possible that the latter sample contains a significant number of large amplitude novae.
2.3 The orbital period distribution
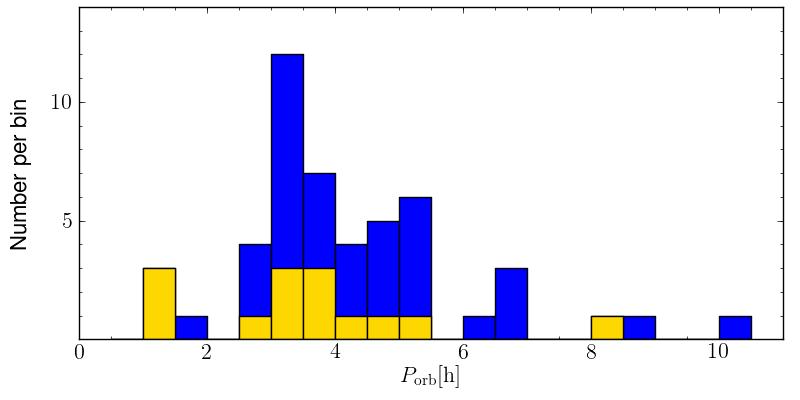
Although there exists a significant spread in mass-transfer rates especially for CVs with orbital periods h, the distribution of the periods can be used as a rough indicator for . In particular, systems below the period gap have typically 1–2 orders of magnitude lower than above the gap, and CVs with the highest lie in the 3–4 h range [34]. The period distribution of post-novae is significantly different from that of non-novae (Fig. 2; see also [21, 33]). First, while the vast majority of non-novae lie below the period gap, less than 10 per cent of post-novae have h. Secondly, the distribution of the post-novae shows a distinctive peak in the 3–4 h range. These two features indicate that the post-nova population is dominated by intrinsically high systems rather than high being a consequence of the nova eruption.
2.4 Long-term light curves
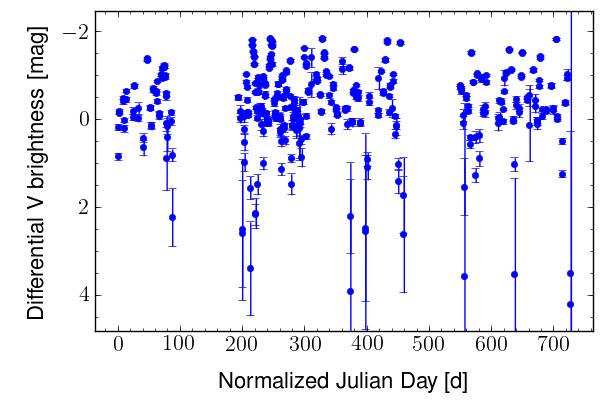
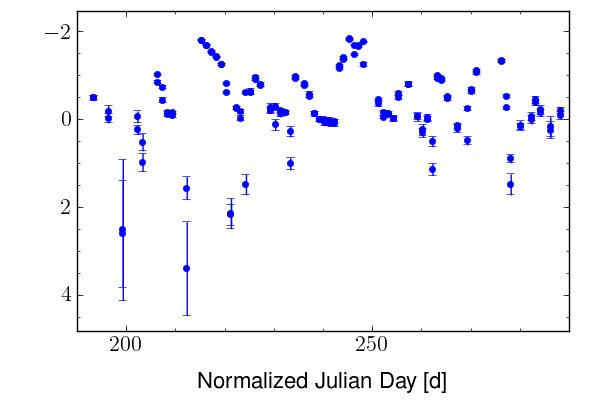
The ultimate test for the mass-transfer rate is the long-term behaviour. Low discs are not in a steady state, but subject to outburst behaviour, with frequency, amplitude and duration being further indicative of [17, 11]. Very few post-novae are known to show disc outbursts, the primary example being V446 Her (Nova Her 1960) [8, 9, 10]. In Fig. 3 we present preliminary long-term data of the eclipsing post-nova V728 Sco (Nova Sco 1862) taken on the 1.3 m SMARTS telescope at Cerro Tololo Inter-American Observatory (Chile) between 2013 August 1st and 2015 July 29th. While the data still have to be corrected for orbital variations, they clearly show variations that strongly resemble disc outbursts. Like in V446 Her, the outbursts are more frequent and have a lower amplitude than those often observed in dwarf novae. Schreiber et al. [23] explained these differences with the presence of a hot ionized inner disc that is the result of irradiation by the eruption-heated white dwarf. Analysis of the eclipse profile in V728 Sco indeed provides evidence for the presence of such a disc [28].
2.5 Brightness before and after the eruption
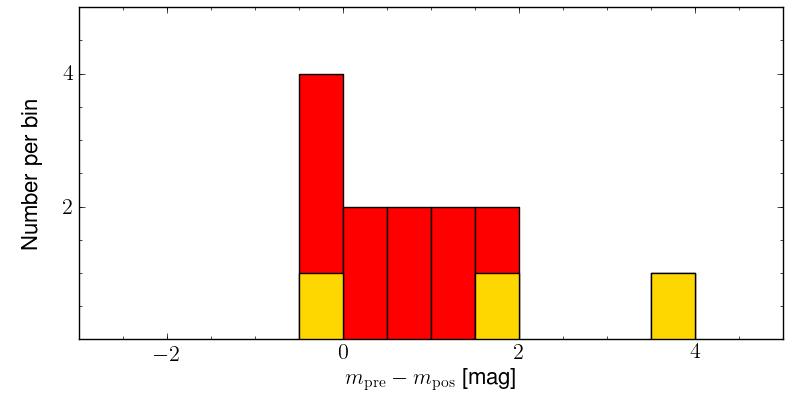
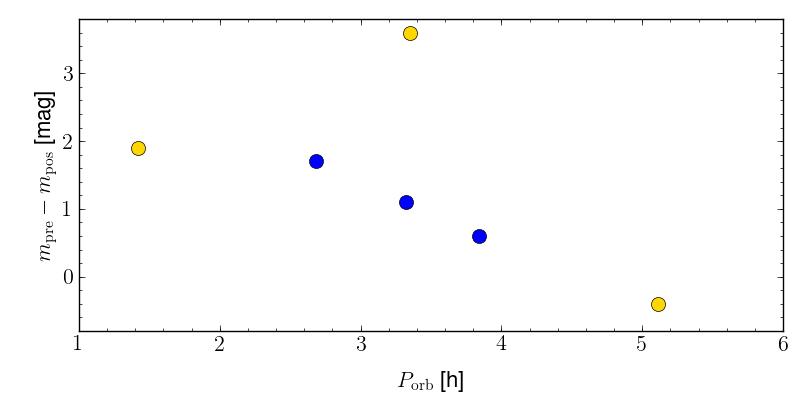
A comparison of the brightness of the pre-nova with that of the post-nova will yield the most immediate indication of the influence of the nova eruption on the CV. However, data on pre-novae are still scarce, with the only comprehensive study being that of Collazzi et al. [1]. The right plot in Fig. 4 shows a histogram of these data for our sample of pre-1986 novae, amounting to just 13 systems. The result is not unambiguous. For about half of the systems the difference is smaller than 0.5 mag, i.e. there appears to be no significant effect of the eruption. Five objects have differences 1 mag, among them the discless post-nova V1500 Cyg with the largest value of almost 4 mag. The left plot of Fig. 4 indicates a possible inverse relation of the brightness difference with the orbital period. The fact that V1500 Cyg as the only discless system represents the only strong exception from this apparent relation could hint that there are two important parameters that soften the impact of the nova eruption on the CV: the binary separation and the presence of an accretion disc. We emphasize that this is based on very few data points and that a more comprehensive study is needed that also takes into account further parameters, e.g. the time that has passed since the nova eruption.
3 Summary
We have conducted a preliminary analysis of the available post-nova sample for novae that erupted before 1986. We have especially explored the potential effect of the nova eruption on the mass-transfer rate of the post-nova. We find that, although the post-nova sample appears to exclusively consist of high systems, that this is potentially due to an observational bias towards low eruption amplitude novae. Furthermore, the orbital period distribution indicates that the post-nova population is dominated by intrinsically high CVs with short eruption recurrence times. In other words, it is the high that causes the nova, rather than the other way round. Still, the comparison of the pre- and post-nova brightnesses shows that for a significant fraction of CVs brightness and thus likely are affected by the nova eruption, most probably due to irradiation by the heated white dwarf, as predicted and required by the hibernation scenario. It appears that the condition of such irradiation being effective is a combination of a small binary separation and the absence of an accretion disc. Thus, short-period magnetic systems should be the most affected by the nova eruption, while the disc appears to block a significant amount of irradiation, perhaps instead resulting in the formation of an ionized inner disc like suspected in V728 Sco.
We point out that the present small size of the post-nova sample potentially affects the result of our analysis, and emphasize the need for more data. The recent results on novae from the Optical Gravitational Lensing Experiment (OGLE, [15]) show that present and future long-term monitoring of the sky will provide a valuable advance especially with respect to the characterization of the pre-nova state.
Acknowledgments.
This research was supported by FONDECYT Regular grant 1120338 and the Centro de Astrofísica de Valparaíso (CT, IFM and NV). AE acknowledges support by the Spanish Plan Nacional de Astrononomía y Astrofísica under grant AYA2012-30789.References
- [1] A. C. Collazzi, B. E. Schaefer, L. Xiao, et al., 2009, The Behavior of Novae Light Curves Before Eruption, AJ, 138, 1846
- [2] M. della Valle, M. Livio, 1995 The Calibration of Novae as Distance Indicators, ApJ, 452,704
- [3] R. A. Downes, R. F. Webbink, M. M. Shara, et al., 2005, A Catalog and Atlas of Cataclysmic Variables: The Final Edition, Journal of Astronomical Data, 11, 2
- [4] A. Ederoclite, C. Tappert, L. Schmidtobreick, N. Vogt, 2011, Old Novae: When New Becomes Old, in: Evolution of Compact Binaries, eds. L. Schmidtobreick, M. R. Schreiber, C. Tappert, ASP Conf. Proc., 447, p.215
- [5] A. Ederoclite, et al., these proceedings
- [6] I. Fuentes-Morales et al., these proceedings
- [7] I. Hachisu, M. Kato, 2015, Light Curve Analysis of Neon Novae, ApJ Suppl., in press, [astro-ph 1511.06819]
- [8] R. K. Honeycutt, J. W. Robertson, G. W. Turner, 1995, Periodic Outbursts in the Old Nova V446 Herculis, ApJ, 446, 838
- [9] R. K. Honeycutt, J. W. Robertson, G. W. Turner, A. A. Henden, 1998, V446 Herculis (Nova Her 1960) Is an Optical Triple: Implications for the Resumption of Dwarf Nova Outbursts following the Nova ApJ, 495, 933
- [10] R. K. Honeycutt, J. W. Robertson, S. Kafka, 2011, The Dwarf Nova Outbursts of Nova Her 1960 (=V446 Her), AJ, 141, 121
- [11] S. Ichikawa, Y. Osaki, 1994, Recurrence time for dwarf nova outbursts: Dependence on mass transfer rate, in: Theory of accretion disks - 2, eds. W. J. Duschl, J. Frank, F. Meyer, et al., NATO ASIC Proc., 417, 169
- [12] M. M. Kasliwal, S. B. Cenko, S. R. Kulkarni, et al., 2011 Discovery of a New Photometric Sub-class of Faint and Fast Classical Novae, ApJ, 735, 94
- [13] C. Knigge, I. Baraffe, J. Patterson, 2011 The Evolution of Cataclysmic Variables as Revealed by Their Donor Stars, ApJ Suppl., 194, 28
- [14] D. Lynden-Bell, 1969, Galactic Nuclei as Collapsed Old Quasars, Nature, 223, 690
- [15] P. Mróz, A. Udalski, R. Poleski, et al., 2015, OGLE Atlas of Classical Novae. I. Galactic Bulge Objects, ApJ Suppl., 219, 26
- [16] G. Nelemans, L. Siess, S. Repetto, S. Toonen, E. S. Phinney, 2015, The formation of Cataclysmic Variables: the influence of nova eruptions, ApJ, in press, [astro-ph/1511.07701]
- [17] , Y. Osaki, 2005, The disk instability model for dwarf nova outbursts, Proceeding of the Japan Academy, Series B, 81, 291
- [18] J. Patterson, 1984, The evolution of cataclysmic and low-mass X-ray binaries, ApJ Suppl., 54, 443
- [19] J. Patterson, H. Uthas, J. Kemp, et al., 2013, BK Lyncis: the oldest old nova and a Bellwether for cataclysmic variable evolution, MNRAS, 434, 1902
- [20] D. Prialnik, M. M. Shara, 1986, Rapid accretion and hibernation in the preoutburst history of classical novae, ApJ, 311, 172
- [21] H. Ritter, U. Kolb, 2003 Catalogue of cataclysmic binaries, low-mass X-ray binaries and related objects (Seventh edition), A&A, 404, 301 (update RKcat7.23, 2015)
- [22] E. F. Schlafly, D. P. Finkbeiner, 2011, Measuring Reddening with Sloan Digital Sky Survey Stellar Spectra and Recalibrating SFD, ApJ, 737, 103
- [23] M. R. Schreiber, B. T. Gänsicke, J. K. Cannizzo, 2000, On the occurrence of dwarf nova outbursts in post novae, A&A, 362, 268
- [24] M. R. Schreiber, M. Zorotovic, T. P. G. Wijnen, 2016, Three in one go: consequential angular momentum loss can solve major problems of CV evolution MNRAS, 455, L16
- [25] M. M. Shara, M. Livio, A. F. J. Moffat, M. Orio, 1986, Do novae hibernate during most of the millenia between eruptions? Links between dwarf and classical novae, and implications for the space densities and evolution of cataclysmic binaries, ApJ, 311, 163
- [26] R. Stehle, U. Kolb, H. Ritter, 1997, Modelling Population II cataclysmic variables A&A, 320, 136
- [27] C. Tappert, A. Ederoclite, R. E. Mennickent, L. Schmidtobreick, N. Vogt, 2012, Life after eruption - I. Spectroscopic observations of 10 nova candidates, MNRAS, 423, 2476
- [28] C. Tappert, N. Vogt, L. Schmidtobreick, A. Ederoclite, J. Vanderbeke, 2013, Life after eruption - II. The eclipsing old nova V728 Scorpii, MNRAS, 431, 92
- [29] C. Tappert, L. Schmidtobreick, N. Vogt, A. Ederoclite, 2013, Life after eruption - III. Orbital periods of the old novae V365 Car, AR Cir, V972 Oph, HS Pup, V909 Sgr, V373 Sct and CN Vel, MNRAS, 436, 2412
- [30] C. Tappert, N. Vogt, M. Della Valle, L. Schmidtobreick, A. Ederoclite, 2014, Life after eruption - IV. Spectroscopy of 13 old novae MNRAS, 442, 565
- [31] C. Tappert, N. Vogt, L. Schmidtobreick, A. Ederoclite, 2015, Life after eruption - V. Spectroscopy of eight candidate old novae with Gemini-South, MNRAS, 450, 943
- [32] D. M. Townsley, L. Bildsten, 2004, Theoretical Modeling of the Thermal State of Accreting White Dwarfs Undergoing Classical Nova Cycles, ApJ, 600, 390
- [33] D. M. Townsley, L. Bildsten, 2005, Classical Novae as a Probe of the Cataclysmic Variable Population, ApJ, 628, 395
- [34] D. M. Townsley, B. T. Gänsicke, 2009, Cataclysmic Variable Primary Effective Temperatures: Constraints on Binary Angular Momentum Loss, ApJ, 693, 1007
- [35] N. Vogt, 1982, The structure and outburst mechanisms of dwarf novae and their evolutionary status among cataclysmic variables, Mitt. Astron. Gesell., 57, 79
- [36] O. Yaron, D. Prialnik, M. M. Shara, A. Kovetz, 2005, An Extended Grid of Nova Models. II. The Parameter Space of Nova Outbursts, ApJ, 623, 398
- [37] P. Zhao, J. E. McClintock, 1997, A Dynamical Study of the Eclipsing Nova OY Arae, ApJ, 483, 899
DISCUSSION
DEANNE COPPEJANS: In the Schreiber et al. (2000) model, the stunted outburst are attributed to an irradiated inner disc. Is the idea that the irradiated inner disc is in a high-state constantly, so that quiescence is brighter and the outburst amplitude is smaller, or is it that the inner disc is dissipated and so can’t take part in the outburst?
CLAUS TAPPERT: The idea is that the inner disc is in an ionized configuration due to irradiation by the hot white dwarf. As such, it is stable and does not participate in the disc outburst. So, the part of the disc being affected by the outburst is smaller, thus accounting for the smaller outburst amplitude. Additionally, the cooling wave cannot traverse through the whole disc, resulting in a higher outburst frequency. The model predicts that, as the white dwarf cools down, the amplitude should increase, and the frequency should decrease with time.