Tidal Distortion of the Envelope of an
AGB Star IRS 3 near Sgr A*
Abstract
We present radio and mm continuum observations of the Galactic center taken with the VLA and ALMA at 44 and 226 GHz, respectively. We detect radio and mm emission from IRS 3, lying NW of Sgr A*, with a spectrum that is consistent with the photospheric emission from an AGB star at the Galactic center. Millimeter images reveal that the envelope of IRS 3, the brightest and most extended 3.8m Galactic center stellar source, consists of two semi-circular dust shells facing the direction of Sgr A*. The outer circumstellar shell at the distance of 1.6 AU, appears to break up into “fingers” of dust directed toward Sgr A*. These features coincide with molecular CS (5-4) emission and a near-IR extinction cloud distributed between IRS 3 and Sgr A*. The NE-SW asymmetric shape of the IRS 3 shells seen at 3.8m and radio are interpreted as structures that are tidally distorted by Sgr A*. Using the kinematics of CS emission and the proper motion of IRS 3, the tidally distorted outflowing material from the envelope after 5000 years constrains the distance of IRS 3 to 0.7 pc in front of or 0.5 pc behind Sgr A*. This suggests that the mass loss by stars near Sgr A* can supply a reservoir of molecular material near Sgr A*. We also present dark features in radio continuum images coincident with the envelope of IRS 3. These dusty stars provide examples in which high resolution radio continuum images can identify dust enshrouded stellar sources embedded an ionized medium.
1 Introduction
The nucleus of our Galaxy hosts a supermassive black hole, Sgr A*, at the dynamical center of the Galaxy. The stellar nuclear cluster surrounding Sgr A* consists of a mixture of an evolved stellar population and a young population of stars at smaller radii. Sgr A* and its neighborhood are subject to intense scrutiny, with potential for long-lasting impact on our understanding of massive black holes in the nuclei of normal galaxies. Understanding the processes occurring in the immediate environment of the massive black hole provides insight into our own Milky Way’s most massive black hole, and presents an unparalleled opportunity to closely study the process by which gas is captured and radiated by supermassive black holes (SMBHs).
Recent OH, CN, CS, HCN and SiO observations suggest that molecular gas is able to survive within 5′′ (0.2 pc) of Sgr A* (Montero-Castano et al. 2009; Martin et al. 2009; Yusef-Zadeh et al. 2013; Moser et al. 2016; Karlsson et al. 2015). One key question is how this gas finds its way so close to Sgr A*. One possibility is the radial infall of giant molecular clouds toward the Galactic center. Another possibility is the highly eccentric orbit of compact clouds, such as G2, bring neutral material close to Sgr A* (e.g., Gillessen et al. 2012, 2013). These clouds experience tidal stripping and provide the supply of accreting material onto Sgr A*.
IRS 3 is the brightest and most extended 3.8m star in the central pc of the Galaxy resembling either a young massive star surrounded by dust (Krabbe et al. 2005; Tanner et al. 2005; Viehmann et al. 2005) or a cool dusty star (e.g., Roche and Aitken 1985; Pott et al. 2008). Recent high resolution 3.8m observations identified IRS 3 as a cool AGB star without any associated OH masers. The 3.8m emission has two components, a compact and bright source, coincident with the central star with an effective stellar temperature of 3K and a dusty shell with a radius of 1′′ or (8000 AU) surrounding the central star (Pott et al. 2008).
Here, we present ALMA and VLA observations of the Galactic center and show that the dusty outer shell of IRS 3 located NW of Sgr A* (projected distance 0.18 pc at the Galactic center distance 8 kpc) is being tidally stretched by Sgr A*. The evidence for tidal distortion of the envelope of IRS 3 implies that dusty, evolved stars with massive envelopes approaching the dynamical center of the Galaxy may supply the fuel for accretion onto Sgr A*.
We also present new observations indicating multiple shells of dust emission at mm extending up to 0.1 pc from the central star. We detect diffuse continuum radio emission from the outermost shell of IRS 3 suggesting external photoionization by the central young star cluster similar to IRS 7. In addition, we show several fingers of dust emission stretched from the outer shell of IRS 3 towards Sgr A* is located. Finally, dark features coincident with the dusty envelopes of IRS 3 in radio continuum images are noted.
2 Observation and Data Reduction
ALMA and Karl G. Jansky Very Large Array (VLA)111Karl G. Jansky Very Large Array (VLA) of the National Radio Astronomy Observatory is a facility of the National Science Foundation, operated under a cooperative agreement by Associated Universities, Inc. observations were carried out as part of a multi-wavelength observing campaign to monitor the flux variability of Sgr A*. Here we focus on observations related to IRS 3 and IRS 7 within a few arcseconds of Sgr A*. Observations were obtained on 2016, July 12 and July 18.
The ALMA 230 GHz data consisted of two spectral windows centered on 218.3 and 238.0 GHz, each 1.87 GHz wide. Bandpass and delay calibration was based on J1924-2914. Cross hand gain calibration was based on Titan and Pallas which were assumed to be unpolarized and subsequent calibration averaged the parallel hand (XX and YY) data sets. Initial amplitude and phase calibration was based on 1744-3116 with an assumed flux density of 0.26 Jy at 234 GHz. Phase self calibration followed by amplitude and phase calibration were applied. The amplitude self-calibration, however, adds uncertainty to the overall amplitude gain calibration. The editing and calibration of the data was carried out using OBIT (Cotton 2008) before all the spectral windows were averaged prior to constructing final images. The July 12 data with a spatial resolution of are presented here.
We also present radio data at 44 GHz and 15 GHz data taken with the VLA in its A configuration. The 44 GHz observations were carried out on 2011, July 8–9, and August 31–September 1. We combined all four days of observations resulting in about 25h of data, self-calibrated in phase and amplitude before final images were constructed. Details of these narrow band observations are given in Yusef-Zadeh et al. (2013). The 15 GHz observation, which was part of a series of measurements at several frequencies between 1.4 and 44 GHz, was carried out on 2013, March 10. Data reduction and observing setup were identical to that described at 8 GHz in Table 1 of Yusef-Zadeh et al. (2016).
3 Results
3.1 Radio and mm Emission from IRS 3
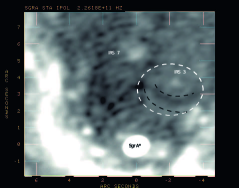
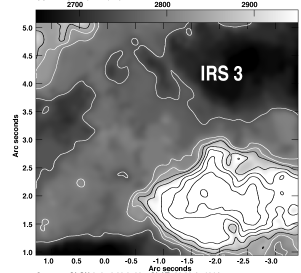
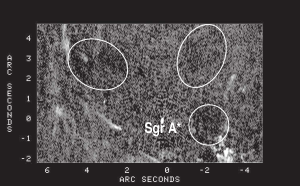
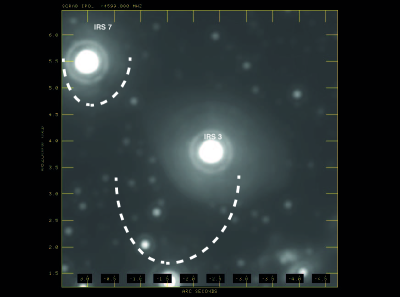
Figure 1a,b show 226 GHz images of the central of the Galactic center at two different spatial resolutions to reveal mm emission from IRS 3 and the newly extended structures. The peak mm emission from IRS 3 coincides with a compact point source at 44 GHz (Yusef-Zadeh et al. 2015). Table 1 shows the comparison of radio and mm emission from IRS 3 based on data taken on July 12, 2016. Columns of Table 1 give the frequency, the telescope and its configuration, RA and Dec, the angular distance from Sgr A* in increasing order, positional accuracy, the spatial resolution, the peak intensity, the spectral index, integrated intensities and references. The intensities are estimated from background subtracted 2D Gaussian fits to IRS 3. Table 1 also includes data taken with the VLA in its A-array configuration on 2014, March 9 and 2014, February 21 at 34 and 44 GHz, respectively (Yusef-Zadeh et al. 2016). The spectral index , where the flux density S, between 44 and 226 GHz as well as between 34 and 44 GHz give values 1.85 and 1.32, respectively. Using the peak flux density of IRS 3 at 350 GHz given by Moser et al. (2016), we find the spectral index is between 226 and 350 GHz. Radio emission from the photosphere of an evolved star has a typical spectral index close to =1.87 (Matthews, Reid and Menten 2015) whereas ionized mass-losing stellar winds are characterized to have (Panagia & Felli 1975). It is clear that radio to mm emission from IRS 3 is optically thick and its spectral index within errors is more consistent with the emission from the photosphere of an evolved star than that of ionized stellar winds emanating from young mass-losing stars. Given the large error in , we can not rule out the possibility that IRS 3 is a young mass-losing star. However, spectral index measurements of a number of radio stars associated with young massive stars near Sgr A* do not show a steep optically thick spectrum with high value of . In addition, the spatially resolved structure of IRS 3 at 3.8m combined with extended mm emission in its vicinity, as discussed below, are detected only toward IRS 3 in the Galactic center. Thus, we assume that IRS 3 is an evolved AGB star.
3.2 Asymmetric Shells and Fingers of Dust Emission
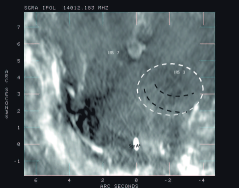
ALMA images reveal extended emission from IRS 3 which includes four new substructures at mm wavelength. The new mm substructures are faint but we detect them in both epoch of our mm observations. First, we detect mm emission from a shell of dust closest to the central star. Figure 1b shows this narrow layer of dust separated from the central peak, facing south towards Sgr A*. The typical flux density of this layer of dust is 100 Jy per beam (PA). Comparison between Figures 1a,b and 1c shows that the innermost mm dust shell traces the southern edge of the dusty and cool AGB star at 3.8 m. The dark dashed lines closest to the central star outline the boundary of the dust shell at mm in Figures 1a,b. The dashed white line outlines schematically the northern and southern boundaries of the EW extended envelope in 3.8m (see Fig. 1c). Second, a thick layer with a dearth of emission is sandwiched between the inner circumstellar shell lying within 1′′ of the central star and an outer shell, about 2.5′′ from the peak mm emission. The intensity in this dark layer ranges from 100 to –400 Jy across the two mm shells. We also note that the southern segment of IRS 7 in Figure 1a,b shows a similar dark feature. The outer dark dashed lines drawn on Figure 1 trace the outer shell of IRS 3. The two shells and the dark layer of IRS 3 face Sgr A* with similar curvature suggesting that these shells are concentric and are associated with the central AGB star. We also note weak 15 GHz continuum emission from the outer shell of IRS 3, as shown in Figure 1d. The mean intensity of the 15 GHz emission is 0.1 mJy per 0.2 beam. Third, the outer mm shell is irregular in its appearance and reveals a number of “fingers” of dust emission in Figure 1a,b. These fingers extend for about 2′′ from IRS 3 towards Sgr A* with a position angle of .
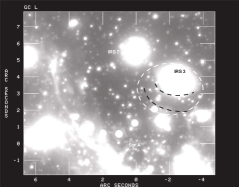
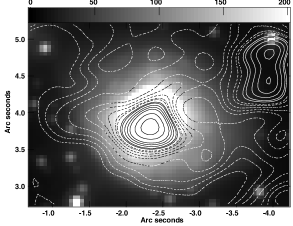
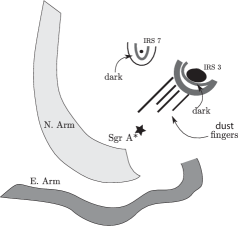
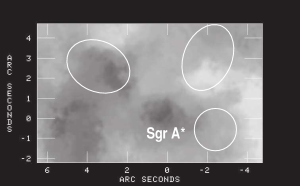
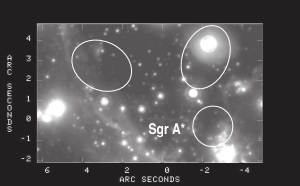
Figure 2a shows a 226 GHz grayscale close-up of the dark layer, the central mm peak emission from the photosphere of IRS 3, and the inner and outer circumstellar shells of IRS 3. The peak emission appears to be extended in the NE-SW direction is similar to that seen in the 3.8m with a PA and angular size of , as seen in Figure 1c. The extended emission to the south of IRS 3 coincides with CS (5-4) emission and spots of compact SiO (6-4) emission with radial velocities between 20 and 100 km s-1 within a region to the south of IRS 3 (Moser et al. 2016). The extinction map based on near-IR observations, as shown in Figure 2b, also reveal a cloud of extinction with an excess of 0.5 magnitudes with respect to its surroundings at 2m (Schödel et al. 2010), coincident with the CS (5-4) emission. Figure 2c shows a close up view of IRS 3 at mm where contours of 226 GHz emission are superimposed on a 3.8m grayscale image. This relatively low-resolution mm image shows that elongation of IRS 3 in the EW direction similar to that seen in Figure 1c. Figure 2d shows a schematic diagram of the new mm substructures, respectively.
3.3 Radio Dark Dusty Stars
Radio continuum images show dark features toward the envelopes of IRS 3 and IRS 7, reminiscent of radio dark clouds (RDCs) that appear in radio continuum images of Galactic center sources (Yusef-Zadeh 2012). Radio dark clouds in continuum images with high dynamic images provide imprints of molecular and dust clouds that are embedded in a bath of ionizing radiation. In regions where thermal radio continuum emission is depressed along the line of sight through a molecular cloud, the cloud appears as a dark feature in radio continuum images. This depression can also be produced by swept up gas by an outflow within an ionized medium.
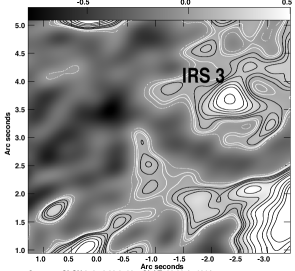
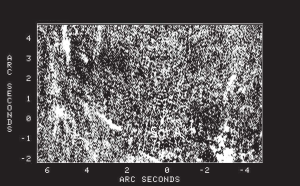
Figure 3a-d present the dark features associated with IRS 3 at 44 GHz and 3.8m. The locations of three dark features are drawn as ellipses. The one to the east coincides with the region surrounding the northern arm of the mini-spiral. The dark features to the southwest and northwest lie in the vicinity of the IRS 13N complex (Muzic et al. 2008) and IRS 3, respectively. The feature close to IRS 3 traces roughly the shells noted in Figures 1 and 2.
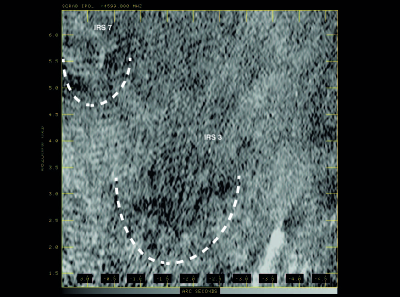
A close-up and high resolution view of the region around IRS 3 and IRS 7 is presented in Figure 4a,b at 44 GHz and 3.8m. A faint radio source which coincides with the central star of IRS 3 (see Table 1) is labeled. We note an extended and elongated dark feature to the southwest of IRS 3. This dark feature, drawn as white broken lines, covers the inner shell and the dark layer detected at mm, as described above. We also note another dark feature in the immediate vicinity of IRS 7. Both these dark features extend to the outer envelope of the dusty stars IRS 3 and IRS 7 and terminate where strong and weak ionized gas is detected, respectively.
Dark features in radio continuum images could result from interferometric errors due to the incomplete sampling of the uv plane (Yusef-Zadeh 2012). However, we detected these dark features in several high frequency images using the VLA in different array configurations. In addition, the dark features correlate with a reservoir of molecular gas in the region between IRS 3, IRS 7 and Sgr A* (Moser et al. 2016). The expected correlation of molecular line emission surrounding IRS 3 and radio dark clouds is consistent with that noted toward radio dark clouds and molecular clouds (Yusef-Zadeh 2012). In addition, dark clouds with excess near-IR extinction (Schödel et al. 2010). The CS (5-4) line emission and an extinction excess in near-IR (Moser et al. 2016; Schödel et al. 2009) coincide with radio dark dusty star IRS 3 and its extension to the south east. The third dark feature to the NE, however, shows no molecular or extinction counterparts. This feature and the one surrounding the inner 2′′ of Sgr A* coincide with dust cavities.
4 Discussion
4.1 Tidal Distortion of the Circumstellar Shells of IRS 3
The most interesting result of this study is the discovery of asymmetric mm dust shells centered on IRS 3 and facing Sgr A*. The shells exhibit a wavy pattern with wavelength along the shell. In addition, the outermost shell of IRS 3 is broken up into fingers of mm emission, pointing toward Sgr A*. The fingers of dust emission appear to coincide with a region where CS (5-4) emission is concentrated (see Fig. 6 of Moser et al. 2016). We first estimate the mass of gas associated with the CS(5-4) emission, and show that it could arise from the envelope of IRS 3. The emission extends over a region with velocities between about 40 and 80 km s-1(Moser et al. 2016). We used the online version of radex222http://home.strw.leidenuniv.nl/ moldata/radex.html (Van der Tak et al. 2007) to estimate the density and column of the emitting molecular gas. Adopting a kinetic temperature of 300 K, consistent with the proximity to hot stars in the central parsec, and a 40 km s-1 FHWM, the observed radiation temperature can be produced by a medium in which the product of hydrogen number density and line-of-sight CS column cm-5 as long as cm-3. Under these conditions the line is sub-thermally excited and optically thin. We assume that the CS abundance relative to H to be , consistent with observations of carbon stars (Woods et al. 2003) and assume that the depth of the source along the line of sight, , is 0.2 pc, consistent with the angle subtended by the CS emission on the sky. Then noting that , we find cm-3. This implies an uncomfortably large envelope mass unless the IRS 3 envelope is clumpy giving with most mass residing in clumps with 5% filling factor (implying cm-3). This would produce the observed CS 5-4 line emission. Although this envelope contains 1/5 the original number of CS molecules, each lies in a clump with five times the original density: the rate of collisional excitation of each CS molecule, and hence the rate of J=5-4 photon emission per CS molecule, is increased fivefold. Individual clumps have magnitudes of extinction at m. This can be reconciled with the observed average extinction (see Fig, 2b) if the beam filling fraction is 0.3. The volume and area filling fractions imply that the envelope consists of clumps with size pc, or . Adopting a dust temperature of 100 K in the envelope implies an average thermal continuum Jy per beam at 226 GHz, similar to the mm enhancement coincident with the CS emission and IR extinction, are broadly consistent with the structure seen in the mm emission.
Infrared 13CO () and H absorption lines have also been detected toward IRS 3 (Goto et al. 2014). One broad velocity component is at 60 km s-1 ranging between 51 and 85 km s-1. This velocity feature has not been detected toward IRS 1W a few arcseconds away from Sgr A*. The physical characteristics of H suggest density and temperature that are consistent with above estimates from CS measurements. Goto et al. (2014) interpret the 60 km s-1feature arising from the inner pc but associated with the circumnuclear molecular ring. Given that the infrared absorption lines have similar characteristics to the CS line emission discussed above, it is possible that absorption features come from the envelope of IRS 3. Based on photospheric modeling, Pott et al. (2008) estimate yr-1. The time scale to eject 0.3 is then yr, implying a terminal wind speed km s-1 to yield an envelope radius pc, consistent with the extent of the CS emission. The envelope may, of course, extend to greater radii but not be visible in CS if molecules are dissociated by the strong external FUV field at the Galactic center. Alternatively, the envelope may be truncated if significant mass loss from IRS 3 has only been taking place over the past 5 000 yrs, or it could be tidally stripped.
Tidal effects may be responsible for the distortion of the envelope as IRS 3 orbiting Sgr A*. Alternatively, the asymmetry may be due to an asymmetric outflow from IRS 3 as numerous post-AGB stars reveal this structure (Lykou et al. 2015; Richards et al. 2011). We can not rule out this possibility but given the elongation of IRS 3 along its proper motion and the presence of extended molecular and dust emission distributed to the south of IRS 3, we consider that the elongation of IRS 3 at 3.8m is due to tidal distortion, as described below.
A simple criterion for tidal extension is that the expansion time scale is of order of the orbital time scale around Sgr A*:
where pc is the distance from Sgr A* and is the shell radius. To explore the envelope’s distortion we model it as a set of fluid elements that are launched radially outwards from IRS 3 as it orbits Sgr A* and subsequently follow their ballistic trajectories in the gravitational field of Sgr A*. In other words, each fluid element follows an independent Keplerian orbit consistent with its launch position and velocity. This ballistic approximation is reasonable as the outflow is supersonic and so the dynamical effect of pressure is negligible until the fluid elements start to intersect an orbital period after launch.
The orbit of IRS 3 is not completely determined a-priori because its line-of-sight velocity and location within the inner parsec along the line of sight are unknown, nor has acceleration in its proper motion across the sky been observed. However, the projected location of IRS 3 relative to Sgr A* and its proper motion are both well determined (Schödel et al. 2009). We adopt km s-1 as the line-of-sight velocity, representative of the mean velocity of the CS emission that we assume arises from its envelope. Then we vary the line-of sight distance relative to the distance to Sgr A*. A particular choice of means that the instantaneous velocity and displacement of IRS 3 relative to Sgr A* are specified, sufficient to specify its orbit. We adopt and 8 kpc as the mass and distance of Sgr A*, and RA and Dec offsets of IRS 3 from Sgr A* as , with velocities km s-1, km s-1(Schödel et al. 2009). We adopt a z-axis directed away from the observer, with km s-1, and at the distance of Sgr A*, so e.g. pc lies 0.1 pc beyond Sgr A*.
We compute the ballistic evolution of fluid elements ejected from IRS 3, 2 500, 5 000, 7 500 yr ago, and plot their position on the the sky relative to Sgr A* as black, blue , and red points in Figure 5, for different choices of . The blue shell should correspond to the extent of the CS envelope, which has an estimated flow time yrs. If pc, or pc, the tidal distortion of the shell is too small, whereas if pc the tidal distortion is too severe. We therefore conclude that if the CS emission arises from the envelope of IRS 3 and IRS 3 currently lies either pc in front of Sgr A*, or pc behind it.
According to Viehmann et al. (2005), the 3.8m isophotes of IRS 3 have major axis orthogonal to the direction towards Sgr A*, and have a bow shock morphology perhaps caused by winds from the cluster of massive stars orbiting Sgr A* or an outflow from Sgr A*. However, this morphology is very dissimilar to the head-tail ionized structure associated with the bow shock source IRS 7 (Yusef-Zadeh, Morris and Ekers 1989; Rieke and Rieke 1989; Yusef-Zadeh & Melia 1992). There is no evidence of an envelope of ionized gas surrounding the innermost mm shell of IRS 3. There is weak radio continuum emission from the outer distorted shell (see Fig. 2b). Thus, it seems unlikely that the the NE-SW structure of IRS 3 at 3.8m is produced by external winds. Instead, we suggest that the outer shell asymmetry is produced by tidal effects tending to stretch the envelope along the orbit of IRS 3. It is also possible that the dust shells to the south of IRS 7 could be generated by the tidal tails from an earlier episode of mass loss from IRS 3 (see the z=+0.4 panel in Fig. 5).
In summary, mm and radio images of the inner 10′′ of Sgr A* reveal stellar and circumstellar emission from IRS 3. The envelope of this AGB star is argued to be distorted and disrupted by the tidal force of Sgr A*. We also showed that dusty envelope of stars could have their imprints on radio continuum images. These dark radio stars are produced the same way that radio dark clouds are originated by being embedded within an ionized medium.
References
- Cotton (2008) Cotton, W. D. 2008, PASP, 120, 439
- Gillessen (2012) Gillessen, S., Genzel, R., Fritz, T. K., Quataert, E., Alig, C., et al. 2012, Nature, 481, 51
- Gillessen (2013) Gillessen, S., Genzel, R., Fritz, T. K., Eisenhauer, F. et al. 2013, ApJ, 763, 78
- Goto et al. (2014) Goto, M., Geballe, T. R., Indriolo, N., et al. 2014, ApJ, 786, 96
- Karlsson et al. (2015) Karlsson, R., Sandqvist, A., Fathi, K., & Martin, S. 2015, A&A, 582, A118
- Krabbe & Copetti (2005) Krabbe, A. C., & Copetti, M. V. F. 2005, A&A, 443, 981
- Lykou et al. (2015) Lykou, F., Hron, J., Paladini, C., et al. 2015, Why Galaxies Care about AGB Stars III: A Closer Look in Space and Time, 497, 203
- Martin et al. (2012) Martin, S., Martin-Pintado, J., Montero-Castaño, M., Ho, P. T. P., & Blundell, R. 2012, A&A, 539, A29
- Matthews et al. (2015) Matthews, L. D., Reid, M. J., & Menten, K. M. 2015, ApJ, 808, 36
- Montero-Castaño et al. (2009) Montero-Castaño, M., Herrnstein, R. M. & Ho, P. T. P. 2009, ApJ, 695, 1477
- Moser et al. (2016) Moser, L., Sánchez-Monge, Á., Eckart, A., et al. 2016, arXiv:1603.00801
- Murray-Clay (2012) Murray-Clay, R. A. & Loeb, A. 2012, Nature Communications, 3, 1049
- Muzic et al. (2008) Muzic, K., Schödel, R., Eckart, A., Meyer, L., & Zensus, A. 2008, A&A, 482, 173
- Panagia & Felli (1975) Panagia, N., & Felli, M. 1975, A&A, 39, 1
- Pott et al. (2008) Pott, J.-U., Eckart, A., Glindemann, A., et al. 2008, A&A, 487, 413
- Richards et al. (2011) Richards, A. M. S., Assaf, K. A., Bains, I., et al. 2011, Asymmetric Planetary Nebulae 5 Conference,
- Rieke & Rieke (1989) Rieke, G. H., & Rieke, M. J. 1989, ApJ, 344, L5
- Roche & Aitken (1985) Roche, P. F., & Aitken, D. K. 1985, MNRAS, 215, 425
- Schödel et al. (2007) Schödel, R., Eckart, A., Alexander, T., Merritt, D., Genzel, R., Sternberg, A., Meyer, L., Kul, F., Moultaka, J., Ott, T., and Straubmeier, C. 2007, A&A, 469, 12
- Schödel et al. (2010) Schödel, R., Najarro, F., Muzic, K., & Eckart, A. 2010, A&A, 511, A18
- Schödel et al. (2009) Schödel, R., Merritt, D., & Eckart, A. 2009, A&A, 502, 91
- Tanner et al. (2005) Tanner, A., Ghez, A. M., Morris, M. R., & Christou, J. C. 2005, ApJ, 624, 742
- van der Tak et al. (2007) van der Tak, F. F. S., Black, J. H., Schöier, F. L., Jansen, D. J., & van Dishoeck, E. F. 2007, A&A, 468, 627
- Viehmann et al. (2005) Viehmann, T., Eckart, A., Schödel, R., et al. 2005, A&A, 433, 117
- Woods et al. (2003) Woods, P. M., Schöier, F. L., Nyman, L.-Å., & Olofsson, H. 2003, A&A, 402, 617
- Yusef-Zadeh & Melia (1992) Yusef-Zadeh, F., & Melia, F. 1992, ApJ, 385, L41
- Yusef-Zadeh (2012) Yusef-Zadeh, F. 2012, ApJ, 759, L11
- Yusef-Zadeh et al. (1989) Yusef-Zadeh, F., Morris, M., & Ekers, R. 1989, The Center of the Galaxy, 136, 443
- Yusef-Zadeh et al. (1990) Yusef-Zadeh, F., Morris, M., & Ekers, R. D. 1990, Nature, 348, 45
- Yusef-Zadeh et al. (2013) Yusef-Zadeh, F., Royster, M., Wardle, M., et al. 2013, ApJ, 767, L32
- Yusef-Zadeh et al. (2015) Yusef-Zadeh, F., Bushouse, H., Schödel, R., et al. 2015, ApJ, 809, 10
- Yusef-Zadeh et al. (2016) Yusef-Zadeh, F., Wardle, M., Schödel, R., et al. 2016, ApJ, 819, 60
| Freq. | Telescope | RA | Dec | Sgr A* | Pos. | (PA) | Peak | Spectral | Integrated | Refs |
|---|---|---|---|---|---|---|---|---|---|---|
| (GHz) | (Config) | (J2000) | (J2000) | Offset | Accuracy | masmas(deg) | Intensity | Index | Flux | |
| () | () | (arcsec) | (mas) | (mJy beam-1) | () | (mJy) | ||||
| 44.5 | VLA(B) | 39.8614 | 24.2147 | 4.50 | 50.24 | 223127(3.8) | 0.109 0.052 | – | 0.121 0.096 | |
| 226 | ALMA | 39.8644 | 24.2573 | 4.44 | 101.29 | 442341(-70.8) | 0.8410.021 | 1.32aa between 44.5 and 226 GHz | 1.2150.400 | |
| 350 | ALMA | 490 | 1.4 | 1.17bb between 226 and 350 GHz | 1.22 | c | ||||
| 34.5 | VLA(A) | 39.8619 | 24.2522 | 4.47 | 10.93 | 8542(-5.3) | 0.081 0.012 | – | 0.108 0.025 | |
| 44.5 | VLA(A) | 39.8624 | 24.2520 | 4.46 | 7.55 | 7434(-4.0) | 0.132 0.034 | 1.85 | 0.111 0.052 |