Primeval very low-mass stars and brown dwarfs – II. The most metal-poor substellar object
Abstract
SDSS J010448.46+153501.8 has previously been classified as an sdM9.5 subdwarf. However, its very blue colour () suggests a much lower metallicity compared to normal sdM9.5 subdwarfs. Here, we re-classify this object as a usdL1.5 subdwarf based on a new optical and near-infrared spectrum obtained with X-shooter on the Very Large Telescope. Spectral fitting with BT-Settl models leads to = 2450 150 K, [Fe/H] = 2.4 0.2 and log = 5.5 0.25. We estimate a mass for SDSS J010448.46+153501.8 of 0.086 0.0015 M☉ which is just below the hydrogen-burning minimum mass at [Fe/H] = 2.4 (0.088 M☉) according to evolutionary models. Our analysis thus shows SDSS J0104+15 to be the most metal-poor and highest mass substellar object known to-date. We found that SDSS J010448.46+153501.8 is joined by another five known L subdwarfs (2MASS J05325346+8246465, 2MASS J061640066407194, SDSS J125637.16022452.2, ULAS J151913.03000030.0 and 2MASS J16262034+3925190) in a ‘halo brown dwarf transition zone’ in the –[Fe/H] plane, which represents a narrow mass range in which unsteady nuclear fusion occurs. This halo brown dwarf transition zone forms a ‘substellar subdwarf gap’ for mid L to early T types.
keywords:
brown dwarfs – stars: chemically peculiar – stars: individual: SDSS J010448.46+153501.8 – stars: low-mass – stars: Population II – subdwarfs1 Introduction
Theoretical studies have shown that primordial Pop III stars were predominantly very massive ( 100 M☉; Bromm, Coppi, & Larson, 2002; Yoshida et al., 2006). However, Chieffi et al. (2001) and Siess, Livio, & Lattanzio (2002) have reported a mechanism to form metal-free intermediate and low-mass stars ( = 1–8 M☉), and more recently numerical simulations have demonstrated that metal-free stars with masses down to 0.1 M☉ can form due to recurrent/periodic gravitational instability (Clark et al., 2011; Greif et al., 2011; Basu, Vorobyov, & DeSouza, 2012). The initial mass function at 0.01–4 M☉ (including brown dwarfs and stars) is likely independent of metallicity within 0.01–3 Z☉, according to numerical simulations of star formation from turbulent cloud fragmentation (Bate, 2014).
Searches for very metal-poor (VMP, ; Beers & Christlieb, 2005) and Pop III stars have to-date generally focused on F- and G-type dwarfs, and G- and K-type turn-off stars, which are bright and can be studied fairly easily with high-resolution optical spectra (for metallicity determination). The majority of known VMP dwarf and giant stars have masses of 0.6–0.8 and 0.8–1.0 M☉, respectively. Very low mass stars (VLMS; 0.08–0.5 M☉) that are 4–10 mags fainter, have not previously been specifically targeted for VMP and Pop III stars in general. Although VLMS is the most numerous population, the number of known M-type VMP stars (Gizis, 1997; Burgasser & Kirkpatrick, 2006; Lépine & Scholz, 2008; Zhang et al., 2013; Kirkpatrick et al., 2016; Lodieu et al., 2017) is significantly smaller than that of F- and G-type VMP stars (e.g. Soubiran et al., 2016). Meanwhile, substellar object with [Fe/H] –2.0 has not been reported in the literature to-date.
The nuclear fusion in VLMS is dominated by the pp I chain reaction, which fuses hydrogen in the central part of VLMS, and the reaction efficiency is lower in stars with lower masses. Therefore, VMP VLMS reflecting the chemical composition of the gas from which they formed. They could provide crucial clues to the star formation history and the synthesis of chemical elements in the early Universe. M subdwarfs have masses in the range 0.09–0.5 M☉ and represent the majority of metal-deficient VLMS, according to the mass function of the Galactic halo (e.g. fig. 8 of Chabrier, 2003). L subdwarfs are expected to be a mixture of the least massive metal-deficient stars and brown dwarfs across the hydrogen-burning minimum mass (HBMM; 0.08–0.087 M☉, depending on metallicity; Baraffe et al., 1997; Chabrier & Baraffe, 1997). The most metal-poor L subdwarfs are particularly interesting, because they represent low-mass stellar and substellar formation within an extremely low-metallicity environment.
There are currently 36 L subdwarfs reported in the literature (see table 4 in Zhang et al. 2017 and table 4 in Lodieu et al. 2017). L subdwarfs are classified into three metallicity subclasses, subdwarf (sdL), extreme subdwarf (esdL) and ultra subdwarf (usdL), based on optical and near-infrared (NIR) spectra (Zhang et al., 2017), that extends and follows the nomenclature of subclasses of M subdwarfs (Lépine, Rich, & Shara, 2007). The metallicity ranges of usdL, esdL, and sdL subclasses are: [Fe/H] –1.7, –1.7 < [Fe/H] –1.0 and –1.0 < [Fe/H] –0.3, respectively. The five most metal-poor objects were re-classified as L ultra subdwarfs (usdLs), including 2MASS J16262034+3925190 (2MASS J1626+39, usdL4; Burgasser, 2004b), SSSPM J10130734–1356204 (SSSPM J1013–13, usdL0; Scholz et al., 2004), SDSS J125637.16022452.2 (SDSS J125602, usdL3; Sivarani et al., 2009), ULAS J135058.86+081506.8 (usdL3; Lodieu et al., 2010) and WISEA J213409.15+713236.1 (usdL0.5; Kirkpatrick et al., 2016). Using the most advanced ultracool model atmospheres (e.g. BT-Settl; Allard, Homeier, & Freytag, 2014), it is possible to constrain the metallicity ([Fe/H]) of VLMS at a precision of 0.2 dex, by fitting models to the full optical–NIR spectra with . 2MASS J1626+39, SSSPM J1013–13, and SDSS J125602 all have [Fe/H] = –1.8 0.2 according to the BT-Settl model fits (Zhang et al., 2017).
SDSS J010448.46+153501.8 (SDSS J0104+15) was selected from the Sloan Digital Sky Survey (SDSS; York et al., 2000) and the UKIRT Infrared Deep Sky Survey (UKIDSS; Lawrence et al., 2007). It was classified as sdM9.5 based on a low-resolution optical spectrum (Lodieu et al., 2017), according to an M subwarf classification scheme (Lépine, Rich, & Shara, 2007). However, metallicity consistency across the subclasses of this scheme has not been tested for the later M subtypes, and Zhang et al. (2017) found that the late type sdMs (within the Lépine, Rich, & Shara 2007 scheme) are actually more metal-poor than early type sdMs. By comparing the and colours of SDSS J0104+15 to an expanded M and L subdwarf sample in Zhang et al. (2017), we found that SDSS J0104+15 could have a significantly lower metallicity than suggested by the sdM9.5 type. We therefore obtained a new high-quality optical to NIR spectrum of SDSS J0104+15 to re-address its metallicity and classification.
This is the second paper of a series under the title ‘Primeval very low-mass stars and brown dwarfs’. In the first paper of the series, we reported the discovery of six new L subdwarfs, defined a new classification scheme for L subdwarfs and derived the atmospheric properties of 22 late type M and L subdwarfs (Zhang et al., 2017). The observations of SDSS J0104+15 are presented in Section 2 of this paper. Section 3 presents constraints of characteristics of SDSS J0104+15, and discussions on the HBMM and the halo brown dwarf transition zone. Finally Section 4 presents a discussion of our results.
2 Observations
2.1 Photometry
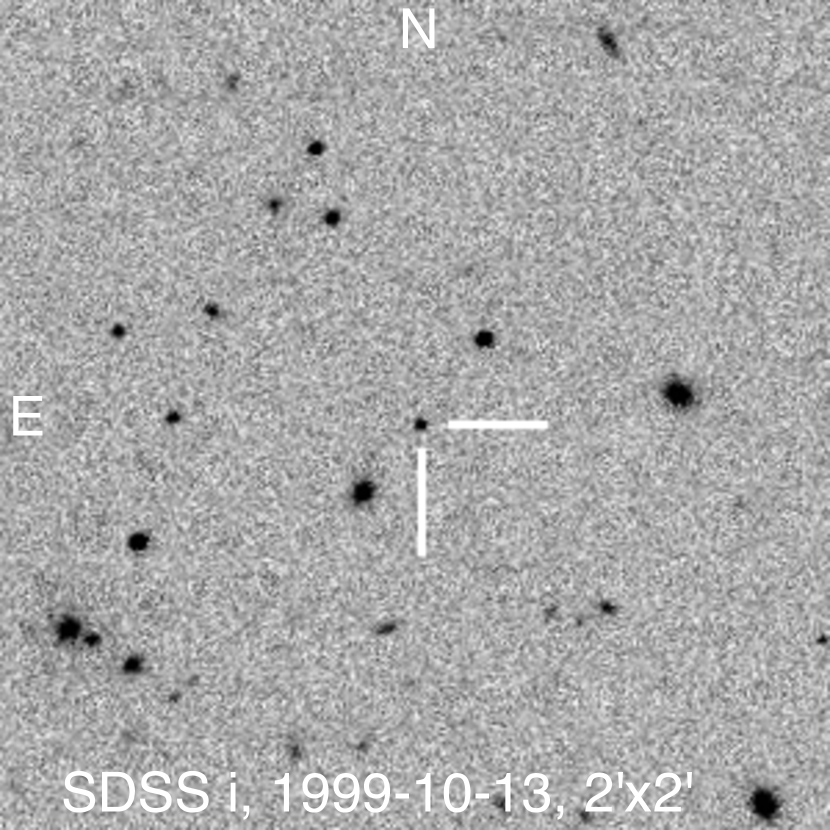
SDSS J0104+15 was first detected in the IR band by the Digitized Sky Survey II on 1992 September 25. It was also detected by the SDSS in the , and bands on 1999 October 13, and by the UKIDSS Large Area Survey (ULAS) in the and band on 2008 October 20, and in the and bands on 2007 November 25. It was detected by the Wide-field Infrared Survey Explorer (WISE; Wright et al., 2010) in the and bands on 2010 July 13. It was observed by the Pan-STARRS1 (PS1; Chambers et al., 2016) in the , , and bands with a mean epoch on 2012 December 27. Fig. 1 shows the SDSS -band finder chart of SDSS J0104+15. It was selected as an ultracool subdwarf candidate by its red and blue colours, and was classified as an sdM9.5 subdwarf based on an optical spectrum () obtained with the FOcal Reducer and low dispersion Spectrograph 2 (FORS2; Appenzeller et al., 1998) on the Very Large Telescope (VLT) on 2012 November 07 (Lodieu et al., 2017).
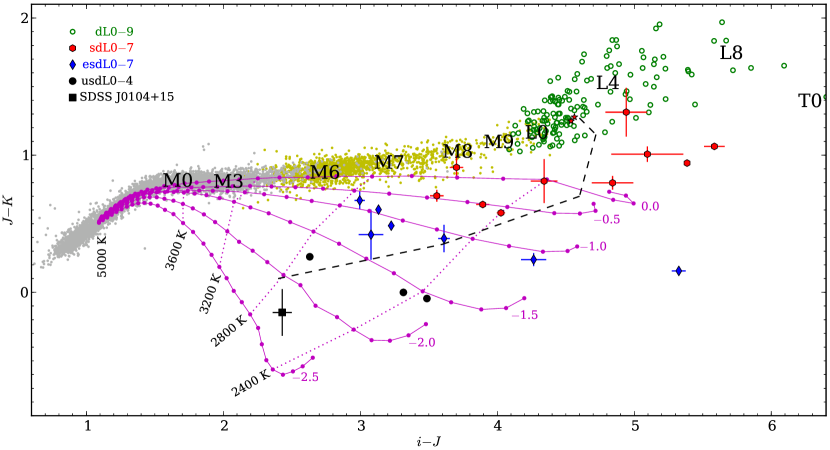
Fig. 2 shows the and colours of L subdwarfs compared to those of main sequence stars and brown dwarfs, with BT-Settl model colours (Allard, Homeier, & Freytag, 2014) over plotted. SDSS J0104+15 is located below and to the left of the three previously known usdL subdwarfs, indicating that SDSS J0104+15 could have a lower metallicity. However, the low-resolution FORS2 optical spectrum is not good enough (in terms of wavelength coverage and resolution) for tight constraints of , [Fe/H] and radial velocity (RV) of SDSS J0104+15.
2.2 VLT spectroscopy
We obtained an optical to NIR spectrum of SDSS J0104+15 with X-shooter (Vernet et al., 2011) on the VLT on 2016 September 10 under excellent seeing conditions (0.43 arcsec as measured by differential image motion seeing monitor) and an average airmass of 1.7. The X-shooter spectrum was observed in an ABBA nodding mode with a 1.2 arcsec slit which provides a resolving power of 6700 in the VIS arm and 4000 in the NIR arm. The total integration time was 3480 s in the visible (VIS) and 3600 s in the NIR. A wavelength and flux calibrated 2D spectrum of SDSS J0104+15 was reduced with European Southern Observatory (ESO) Reflex (Freudling et al., 2013). The 1D spectrum was extracted from the 2D spectrum with IRAF111IRAF is distributed by the National Optical Observatory, which is operated by the Association of Universities for Research in Astronomy, Inc., under contract with the National Science Foundation. task APSUM. Telluric correction was achieved using the B9 star HD182719 which was observed a few minutes before SDSS J0104+15 at an airmass of 1.64. The spectrum of SDSS J0104+15 has signal-to-noise (SNR per pixel) of 29 at 800 and 10 at 1300 nm. Spectra plotted in Fig. 3 are smoothed by 101 pixels (boxcar smooth with IRAF SPLOT), which increased the SNR by a factor of 10 and reduced the resolving power to 600–400.
| Parameter | Value | |
|---|---|---|
| SDSS (J2000) | ………………………… | |
| SDSS (J2000) | ………………………… | |
| SDSS epoch | ………………………… | 1999 October13 |
| SDSS | ………………………… | 22.25 0.17 |
| SDSS | ………………………… | 20.37 0.05 |
| SDSS | ………………………… | 19.28 0.06 |
| Pan-STARRS1 | ………………………… | 20.52 0.02 |
| Pan-STARRS1 | ………………………… | 19.49 0.02 |
| Pan-STARRS1 | ………………………… | 19.09 0.03 |
| UKIDSS | ………………………… | 18.48 0.05 |
| UKIDSS | ………………………… | 17.93 0.05 |
| UKIDSS | ………………………… | 18.06 0.11 |
| UKIDSS | ………………………… | 18.08 0.17 |
| ………………………… | 16.61 0.08 | |
| ………………………… | 16.36 0.25 | |
| Spectral type | ………………………… | usdL1.5 0.5 |
| Distance (pc) | ………………………… | 228 |
| (mas yr-1) | ………………………… | 206.2 4.2 |
| (mas yr-1) | ………………………… | 179.1 4.6 |
| (km s-1) | ………………………… | 276 75 |
| RV (km s-1) | ………………………… | 26 16 |
| (km s-1) | ………………………… | 98 40 |
| (km s-1) | ………………………… | 261 79 |
| (km s-1) | ………………………… | 100 46 |
| (K) | ………………………… | 2450 150 |
| ………………………… | 2.4 0.2 | |
| ………………………… | 2.1 0.2 | |
| Mass (M☉) | ………………………… | 0.086 0.0015 |
| Age (Gyr) | ………………………… | 11–13 |
3 Characteristics
3.1 Spectral classification
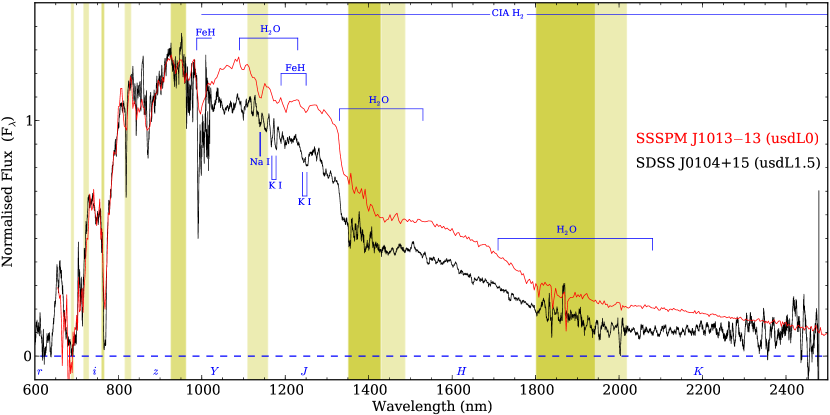
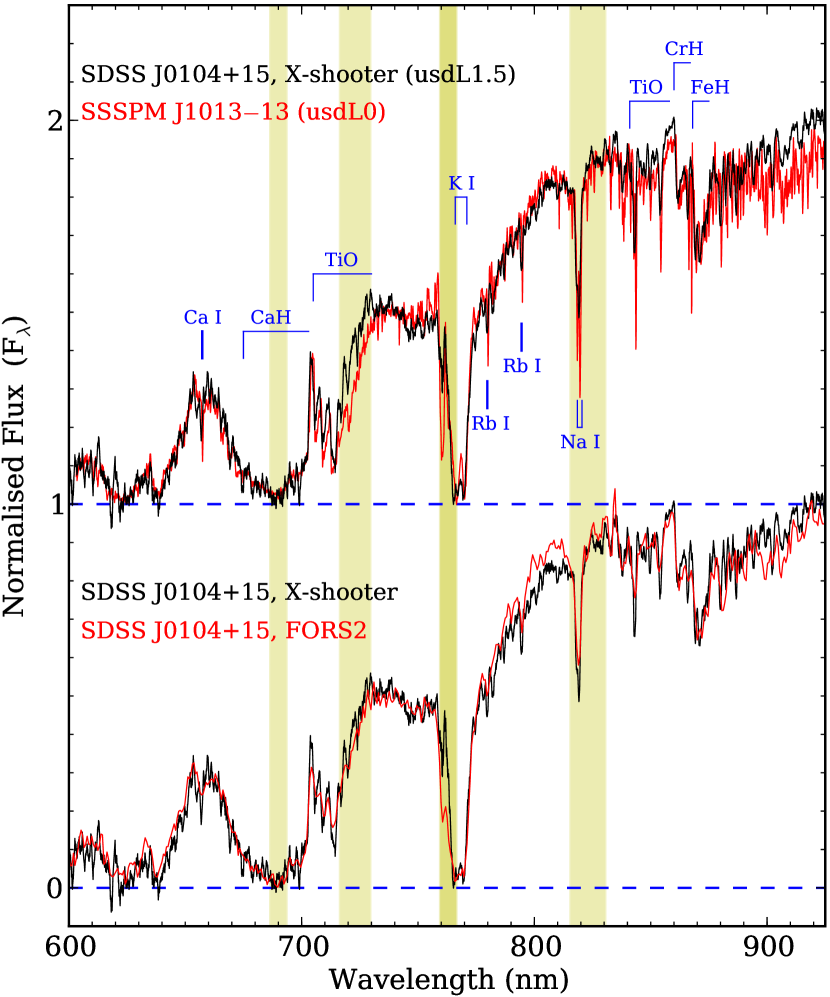
Fig. 3 shows the new optical–NIR spectrum of SDSS J0104+15 compared to that of a usdL0 subdwarf (SSSPM J101313; Burgasser, 2004b; Scholz et al., 2004; Zhang et al., 2017). SDSS J0104+15 has stronger overall suppression in the NIR as well as a flatter -band morphology, both of which can be accounted for (according to the model atmospheres) by stronger enhanced collision-induced H2 absorption (CIA H2; Bates, 1952; Saumon et al., 2012). This is consistent with SDSS J0104+15 being more metal-poor than SSSPM J101313. Fig. 4 shows only the optical spectrum of SDSS J0104+15 compared to that of SSSPM J1013-13. These objects have similar optical spectral profiles, however SDSS J0104+15 has weaker TiO absorption bands at around 710 and 850 nm, offering further evidence that SDSS J0104+15 is lower metallicity than SSSPM J101313. Therefore, SDSS J0104+15 is likely an early type usdL subdwarf.
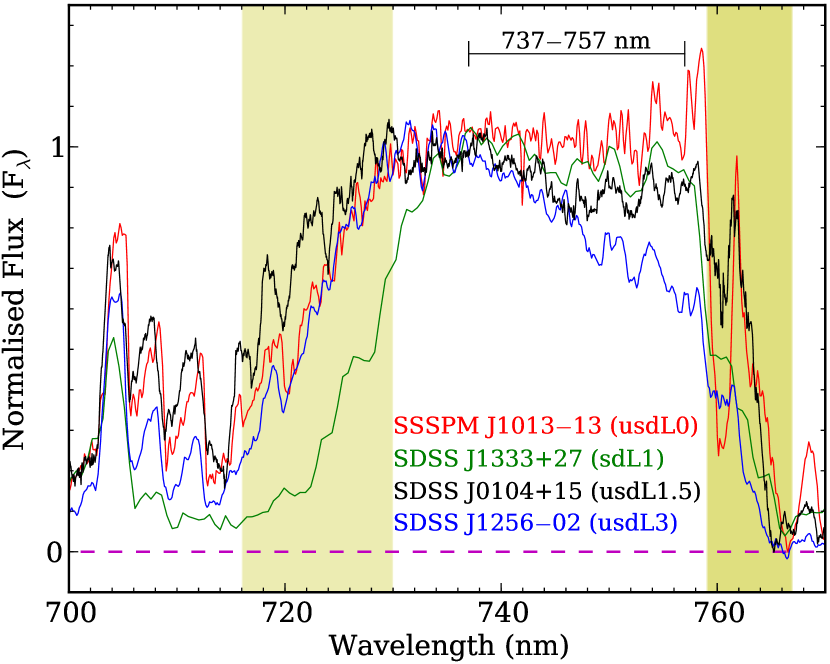
The slope of the spectra at 737–757 nm wavelength is used to assign spectral types of early L subdwarfs (Kirkpatrick et al., 2014; Zhang et al., 2017). In the 737–757 nm range, the slope of the spectrum is positive (i.e., the spectrum is red) for L0, flat for L0.5, and negative for L1 and later types (see fig. 10 in Zhang et al., 2017). In the 737–757 nm wavelength range, the slope of the spectra of early L-type objects is bluer at both lower [Fe/H] and . Therefore, a esdL0.5 type spectrum has a higher than an sdL0.5 type spectrum. Meanwhile, a usdL subclass spectrum has a later subtype than an sdL subclass spectrum with the same . For instance, a usdL2 type object would have similar as an sdL0 type object (see fig. 20 in Zhang et al., 2017). Fig. 5 compares the 737–757 nm wavelength range in the spectrum of SDSS J0104+15 to those of SSSPM J1013-13 (usdL0), SDSS J133348.24+273508.8 (SDSS J1333+27, sdL1; Zhang et al., 2017)s SDSS J125602 (usdL3), with the spectra normalized at around 737 nm. The slope of the spectrum of SDSS J0104+15 in the 737–757 nm wavelength range is approximately intermediate between the usdL0 and usdL3 comparison objects, and slightly bluer than the sdL1. The slope is clearly much closer to that of the sdL1 than to the usdL3, so we chose a spectral classification of usdL1.5 0.5 for SDSS J0104+15.
In retrospect we note that SDSS J0104+15 (usdL1.5) and the earlier usdL0 SSSPM J101313 have similar flux ratios between 740 and 810 nm, despite this ratio increasing with increasing . However, this ratio is also sensitive to metallicity, increasing with decreasing [Fe/H]. So the 740 to 810 nm similarity could be explained if SDSS J0104+15 has lower metallicity and cooler compared to SSSPM J101313. This will be discussed further in Section 3.3.
3.2 Halo kinematics
We derived spectroscopic distance estimates for SDSS J0104+15 using the relationship between spectral type and - and - band absolute magnitude shown in fig. 16 of Zhang et al. (2017). We obtained distance constraints of pc and pc in the and bands, respectively. We adopt the average distance estimate and uncertainty of these and band estimates, giving pc. We estimated the - band magnitude of SDSS J0104+15 to be 20.93 0.21 using the relationship between and colours (Jordi, 2014). This is close to the limit (; Gaia Collaboration et al., 2016)s SDSS J0104+15 is thus a borderline object. It may be detected by in its final data release, but with a somewhat lower parallax accuracy compared to brighter ( < 20) objects.
The proper motion of SDSS J0104+15 was measured from SDSS and PS1 -band images which have a baseline of 13.2 yr. We used the IRAF task GEOMAP to derive spatial transformations from the SDSS into the PS1 -band image. Thirteen reference stars around SDSS J0104+15 were used for the transformation. These transforms allowed for linear shifts and rotation. We then transformed the SDSS pixel coordinates of SDSS J0104+15 into the PS1 image using GEOXYTRAN, and calculated the change in position (relative to the reference stars) between the two epochs. This analysis yield mas yr-1 and mas yr-1. The errors on proper motion are computed from the root mean square of the position shifts of reference stars between SDSS and PS1 fields.
To facilitate RV determination for SDSS J0104+15 we obtained an X-shooter spectrum of an L1 dwarf (DENIS-P J14410945; Martín et al., 1999) with known RV (27.9 1.2 km s-1; Bailer-Jones, 2004). We then cross correlated strong absorption lines (Rb I, Na Is K I) in the optical and NIR between SDSS J0104+15 and DENIS-P J14410945. The RV of SDSS J0104+15 was found to be 85 6 km s-1. The RV error is from the standard deviation of RV measurements from different absorption lines.
The Galactic space motions of SDSS J0104+15 were determined using our spectroscopic distance, RV and proper motion following Clarke et al. (2010). It has typical halo velocities: km s-1, km s-1 and km s-1 [see fig. 17 of Zhang et al. (2017) for comparison; here is positive in the direction of the Galactic anti centre, is positive in the direction of Galactic rotations is positive in the direction of the North Galactic Pole (Johnson & Soderblom, 1987)]. Table 1 summarises the properties of SDSS J0104+15.
3.3 Atmospheric properties
We used the BT-Settl models (Allard, Homeier, & Freytag, 2014) to constrain the atmospheric parameters of SDSS J0104+15. The BT-Settl atmospheric models can reproduce the overall observed spectra of M and L subdwarfs, and can closely reproduce a variety of optical and NIR spectral features. BT-Settl models are able to reproduce observed spectra rather better for M and L subdwarfs with [Fe/H] < 1.0 than for [Fe/H] > 1.0 (Zhang et al., 2017).
The model grids we used cover 2000 K 2600 K, [Fe/H] and 5.0 log 5.75, with intervals of 100 K for , 0.5 dex for [Fe/H], and 0.25 dex for log , and account for -enhancement ([/Fe] = +0.4 is adopted for [Fe/H] 1.0, and [/Fe] = +0.2 is adopted for [Fe/H] = 0.5). The relation between [M/H] and [Fe/H] is [M/H] [Fe/H] + 0.3 for scaled solar compositions with [/Fe] = +0.4, and [M/H] [Fe/H]+0.15 for [/Fe] = +0.2. We used linear interpolation between some models if this yielded a significantly improved fit.
Surface gravity has the least effect on the spectral profile of L subdwarfs compared to temperature and metallicity. Zhang et al. (2017) has shown that esdM7–esdL4 subdwarfs have a similar log of 5.5 dex, with their spectra being mainly affected by and metallicity. Therefore, we used model spectra with log = 5.5 dex for our comparisons with SDSS J0104+15 to find the closest model-fit and [Fe/H]. While the BT-Settl models can reasonably reproduce the overall spectral profile of early L dwarfs, some detailed features are not reproduced that well (Zhang et al., 2017). Furthermore, some wavelength ranges are more sensitive to and/or [Fe/H] than others. We therefore performed a by-eye comparison between model spectra and SDSS J0104+15, focusing on a set of sensitive well modelled wavelength regions.
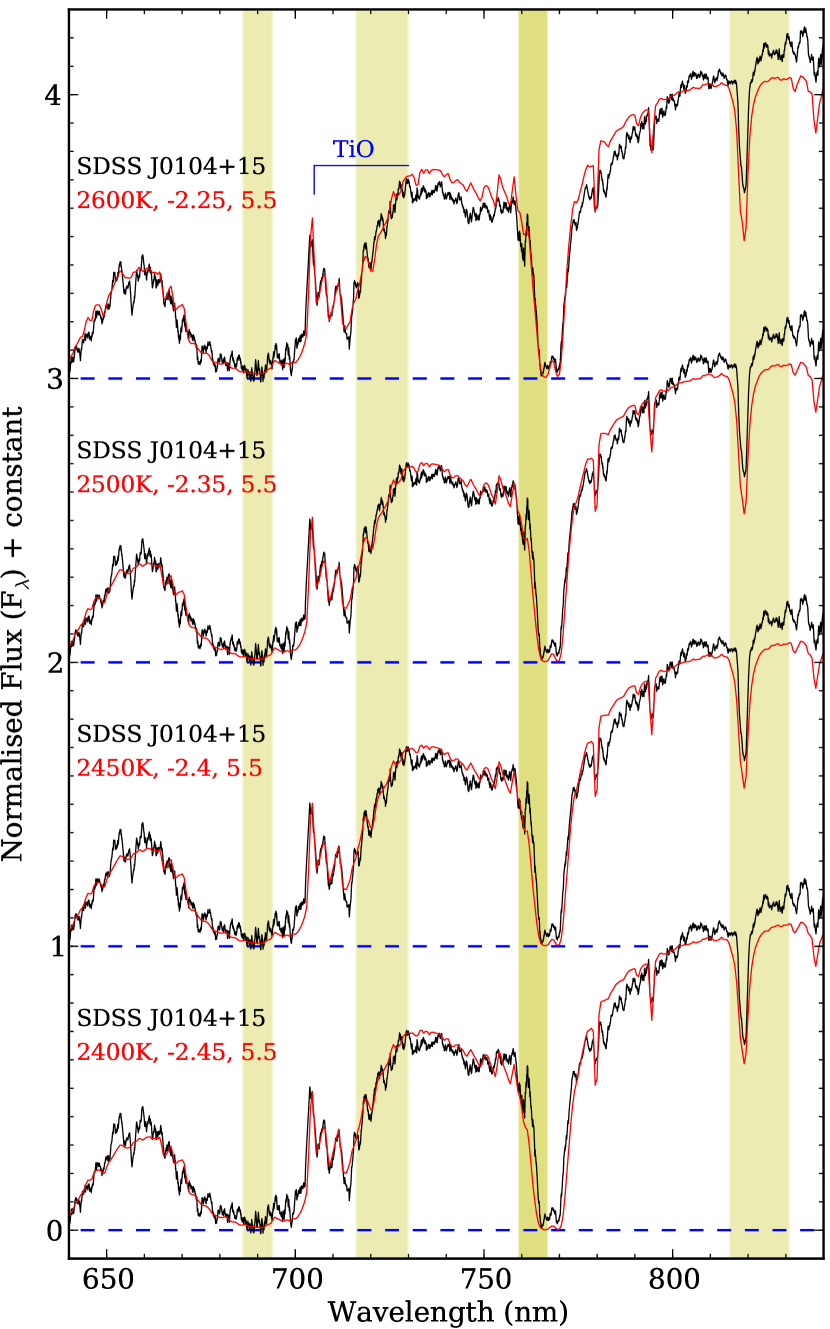
The 640–680 nm wavelength region and TiO absorption band at 705–730 nm are particularly sensitive to [Fe/H] for early type L subdwarfs with [Fe/H] < 2.0 (see fig. 6 of Zhang et al., 2017). The 705–730 nm TiO absorption band is weakening rapidly from [Fe/H] = 2.0 to 2.5, and responses to small changes of [Fe/H] (e.g. 0.05 dex). Also the 730–760 nm wavelength region is very sensitive to [Fe/H] and (figs 10 and 13 of Zhang et al., 2017). We followed a two-step approach for our by-eye model-fitting. First we considered the 705–730 nm TiO absorption band and the 640–680 nm wavelength region, and identified a set of good-fitting models with 2600 K (with step sizes of 50 K on and 0.05 dex on [Fe/H]). We then compared this good-fitting model set to the 730–760 nm wavelength and the NIR regions, and further refined our best-fitting model selection to obtain and [Fe/H] constraints.
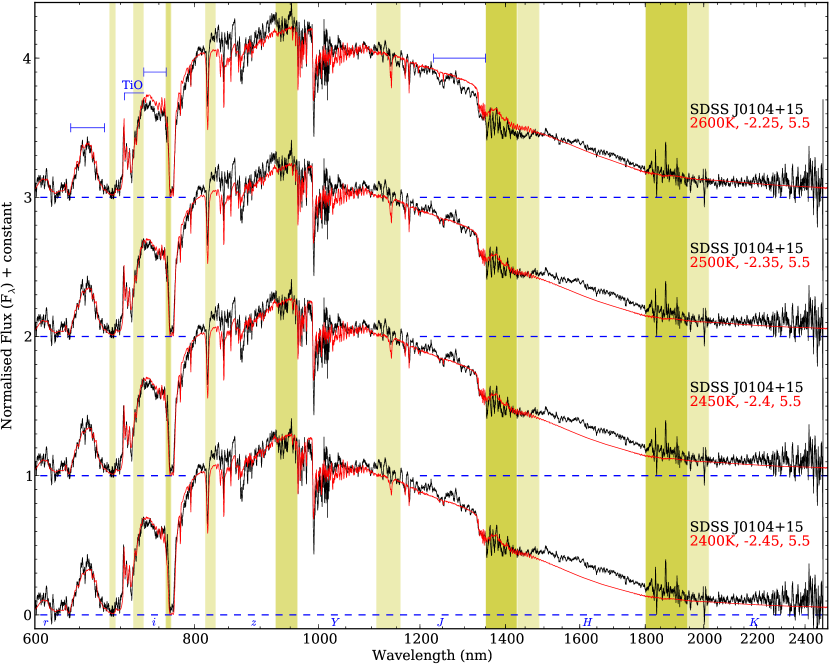
Fig. 6 shows the optical–NIR spectrum of SDSS J0104+15 compared to our four good-fitting models in the 710 nm TiO absorption band and the 640-680 nm wavelength region. Four model spectra all fit well with the overall spectral profile of SDSS J0104+15. Fig. 7 shows a zoom-in of Fig. 6 at 640–840 nm. The 2600 K model spectrum has more flux at 730–760 nm than SDSS J0104+15, and does not fit well with the steep shoulder at 1227 nm, which is also sensitive to . Therefore, SDSS J0104+15 should have a below 2600 K. The other three model spectra have a bit less flux at band, however they fit well with SDSS J0104+15 at these metallicity and sensitive regions from 600 to 1350 nm, and thus constitute our refined best-fitting model selection. In this way, we estimate that SDSS J0104+15 has = 2450 150 K and [Fe/H] = 2.4 0.2, accounting for possible systematic uncertainties. The total metallicity of SDSS J0104+15 is [M/H] = 2.1 0.2. SDSS J0104+15 would have an age of 11–13 Gyr according to ages of stars with similar metallicity in globular clusters and the Galaxy’s halo (Jofré & Weiss, 2011; Dotter et al., 2010).
We can now compare the observed colours of SDSS J0104+15 directly to model predictions using Fig. 2, which shows the and colours calculated for model atmospheres with of 2000–5000 K, [Fe/H] , and log of 5.5. The best-fitting models predict a bluer colours than SDSS J0104+15. We suggest that the detailed continuum shape of the BT-Settl model spectra could still be improved in this VMP domain ([Fe/H] < 2.0).
3.4 The hydrogen-burning minimum mass
The central temperature () of VLMS with 0.1–0.3 M☉ is independent of metallicity. Fig. 6 of Chabrier & Baraffe (1997) shows that the mass– relationships at 0.1–0.3 M☉ are the same for [M/H] = 0 and 1.5. The lower the metallicity, the lower the opacity and the more transparent the atmosphere, and the same optical depth lies at deeper layers with higher temperature in more metal-poor stars. Therefore, more metal-poor stars have higher than metal-rich stars with same mass. However, a 10 Gyr metal-poor brown dwarf could have cooler than a metal-rich star with the same mass. This is because the HBMM is lower at higher metallicity than at lower metallicity, and the higher metallicity means higher opacity, which in turn produces higher by steepening the temperature gradient. For the same reason, a massive metal-poor brown dwarf could have the same mass as a least massive metal-rich star (Burrows et al., 2001).
Evolutionary models show that nuclear ignition still takes place in the central part of stars with mass slightly below 0.083 M☉ at [M/H] = 1.0, but cannot balance steadily the ongoing gravitational contraction, which defines the massive brown dwarfs (Chabrier & Baraffe, 1997). The same occurs in stars with mass slightly below 0.072 M☉ at [M/H] = 0. Therefore, the HBMMs are 0.072 M☉ at [M/H] = 0 and 0.083 M☉ at [M/H] = 1.0. The exact HBMM at [M/H] < 1.0 is not explicitly stated in Chabrier & Baraffe (1997) and Baraffe et al. (1997). The HBMM at primordial metallicity () is 0.092 M☉ according to Burrows et al. (2001). In this section we use the mass– relations given by evolutionary models to try to deduce the HBMM at various metallicities.
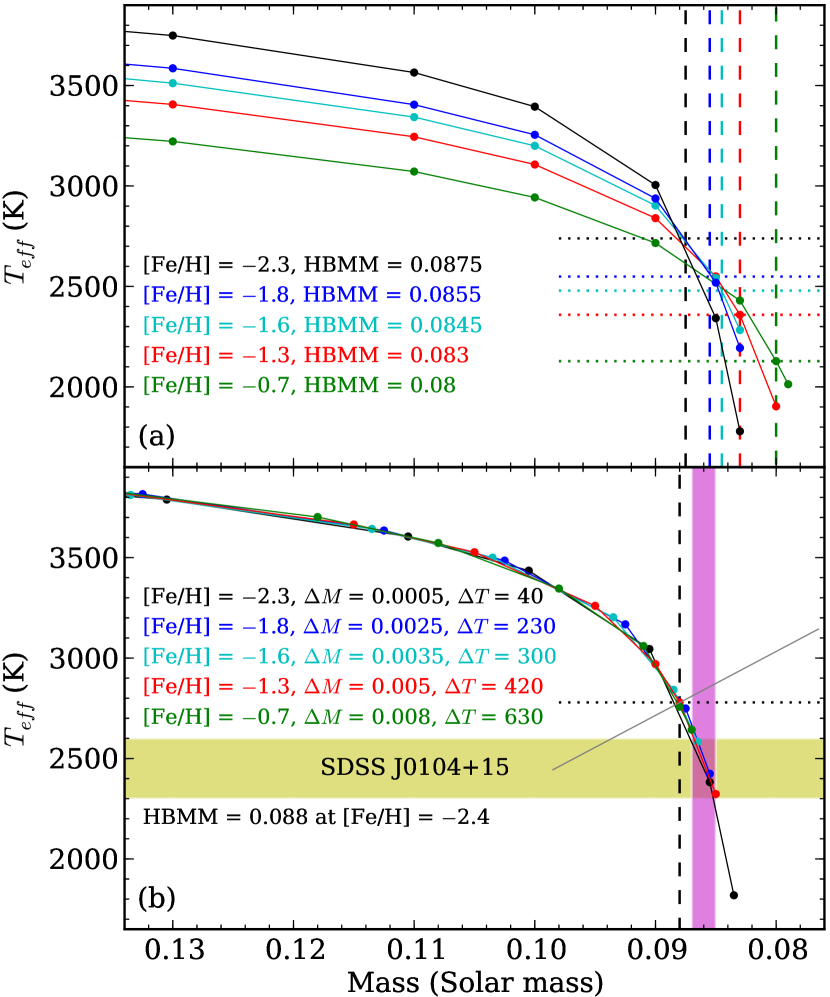
Fig. 8 (a) shows the 10 Gyr mass– relationships derived from evolutionary models of low-mass stars with [M/H] of 0.5, 1.0, 1.3, 1.5, and 2.0 (Chabrier & Baraffe, 1997; Baraffe et al., 1997). Note that the [M/H] scale is not calibrated for -enhancement. We converted the [M/H] to [Fe/H] scale with [M/H] = [Fe/H]+0.3 ([/Fe] = +0.4) for [M/H] 1.0 and [M/H] = [Fe/H]+0.2 ([/Fe] = +0.3) for [M/H] = 0.5. These evolutionary models employed the base atmospheric models of Allard & Hauschildt (1995). The steepening of the mass– relationship near the lower mass end reflects the onset of ongoing electron degeneracy in the stellar interior, which is the characteristic of the transition between the stellar and sub-stellar domains. is a decreasing function of metallicity above the HBMM, but an increasing function of metallicity below the HBMM. A mass– relationship at a certain [Fe/H] intersects with other relationships at different [Fe/H]. The intersection points with the relationships at higher [Fe/H] provide upper limits on the HBMM at the certain [Fe/H]. For example, the mass– relationships at [Fe/H] = 1.3 and [Fe/H] = 0.7 intersect around 0.084 M☉. Therefore, the HBMM at [Fe/H] = 1.3 is expected to be below 0.084 M☉.
Fig. 8 (b) shows mass– relationships that have been shifted along mass and axes to best match with each other, at a projected position at [Fe/H] = 2.4. We shifted these relationships with steps of 0.0005 M☉ and 10 K. These shifted final values of mass (in M☉) and (in K) are indicated on the plot. These relationships of different [Fe/H] have very similar profiles at 0.08–0.3 M☉. This is likely because that the mass– and mass–radius relationships at 0.1–0.3 M☉ are very similar at different metallicity, and the steepening of the mass– relationship near the lower-mass end are caused by the same physical reason, which is electron degeneracy in the stars at stellar-substellar transition. Therefore, the cross points of HBMMs on these relationships at different [Fe/H] are overlapped in Fig. 8 (b). The perpendicular line at the HBMM on these relationships is marked in Fig. 8 (b). The mass shift of a relationship at a certain [Fe/H] to match the relationship profile at [Fe/H] = 1.3, is also the HBMM shift relative to the HBMM at [Fe/H] = 1.3, which is 0.083 M☉. Therefore, the HBMMs are 0.0875, 0.0855, 0.0845, 0.083, and 0.08 M☉ at [Fe/H] = 2.3, 1.8, 1.6, 1.3, and 0.7, respectively, according to Fig. 8 (b). The corresponding at 10 Gyr are 2739, 2549, 2479, 2359, and 2128 K, respectively. The HBMMs and at these five [Fe/H] values are indicated as vertical dashed lines and horizontal dotted lines in Fig. 8 (a), respectively. The projected HBMM at [Fe/H] = 2.4 is around 0.088 M☉. SDSS J0104+15 has a = 2450 150 K, indicated with the shaded-yellow belt in Fig. 8 (b). The corresponding mass of SDSS J0104+15 derived from the mass– relationship at [Fe/H] = 2.4 is between 0.085 and 0.087 M☉, which is indicated with a shaded-magenta belt. The mass uncertainty caused by error (150 K) is 0.001 M☉. The mass uncertainty caused by [Fe/H] error (0.2 dex) is around 0.008–0.001 M☉, as the mass– relationship at [M/H] = 1.5 was shifted by 0.002 M☉ to match with the relationship at [M/H] = 2.0 (Fig. 8 b). Age uncertainty may affects our mass estimation by up to 0.0005 M☉. Because the of a massive brown dwarf drop by 50–100 K from 10 Gyr to 11–13 Gyr (e.g. Baraffe et al., 2003). The square root of the sum of squares of all uncertainties is 0.0015 M☉. Therefore, SDSS J0104+15 has a mass of 0.086 0.0015 M☉.
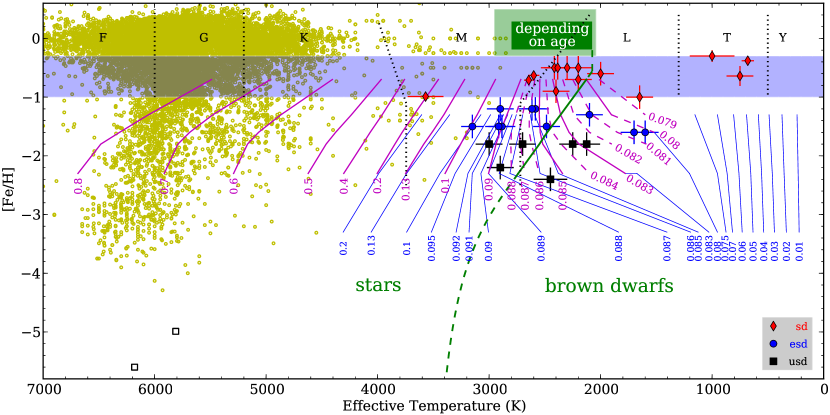
Fig. 9 explores how the most metal-poor subdwarf population distribution maps on to the [Fe/H]– plane for F, G, K, M, L and T types. 10 Gyr iso-mass contour lines are plotted to better visualize the HBMM at different [Fe/H]. Solid magenta contour lines are from Chabrier & Baraffe (1997) and Baraffe et al. (1997). We also show some interpolated contours (dashed magenta lines) based on mass– relationships at different metallicity (which have very similar profiles; see Fig. 8 b). Blue contour lines are from Burrows et al. (1998), and will further aid discussion in Section 3.5. Guided by these model contour lines we have generated a HBMM limit in the [Fe/H]– plane over the range [Fe/H] , which is shown as a solid green line that is well approximated by the straight line function:
| (1) |
A green box area indicates the overlapped region for young brown dwarfs and older VLMS in the solar neighbourhood. VLMS just above the HBMM have 2075 K (Dieterich et al., 2014). Meanwhile, PPl 15 AB (Basri, Marcy, & Graham, 1996), a young binary brown dwarf confirmed by the lithium test (Magazzu, Martin, & Rebolo, 1993) in the Pleiades open cluster, has a of 2800 150 K (Rebolo et al., 1996). The corresponding of the HBMM (0.092 M☉) at primordial metallicity is 3600 K (Burrows et al., 2001). We have thus extended our HBMM line to lower metallicity ([Fe/H] < 2.3) following a tangent function. This extended (green dashed) line approaches 3600 K at [Fe/H] = , and is described by:
| (2) |
The corresponding 10 Gyr at [Fe/H] =2.4 is around 2777 K according to equation (2). We also conservatively extend the HBMM line to higher metallicity by joining it on to the right side of the green box, which provides a reference of for the HBMM at [Fe/H] > 0.7. It can be seen that the 10 Gyr iso-mass lines for 0.085 and 0.083 M☉ turn to cooler below the HBMM limit at [Fe/H] = 1.7 and [Fe/H] = 1.3, respectively. This is consistent with the steep decent in the mass– relationship below the HBMM, that is seen at different metallicities in Fig. 8.
SDSS J0104+15 is clearly on the substellar side of the HBMM limit, and according to our analysis joins five other halo L subdwarfs that are brown dwarfs; 2MASS J1626+39, SDSS J125602, ULAS J151913.03000030.0 (ULAS J151900; Zhang et al., 2017), 2MASS J061640066407194 (2MASS J061664; Cushing et al., 2009), and 2MASS J05325346+8246465 (2MASS J0532+82; Burgasser et al., 2003). SDSS J0104+15 appears to be the most metal-poor brown dwarf identified to-date, and is also the most massive brown dwarf yet known.
To aid early identification of metal-poor brown dwarfs we have transferred our stellar–substellar boundary line on to the versus colour-colour diagram, based on the observed colours of SDSS J0104+15 and the other objects with constrained and [Fe/H] (from Zhang et al., 2017) in Fig. 9. This approximate stellar–substellar boundary is indicated in Fig. 2 as a black dashed line.
3.5 The halo brown dwarf transition zone
Returning to Fig. 9 the 10 Gyr iso-mass contours of Burrows et al. (1998, blue lines) span a very interesting region of the metallicity– plane. These models were calculated across 0.01–0.2 M☉ at = 0.1, 0.01, and 0.001 Z☉ (i.e. [Fe/H] = 1.3, 2.3, and 3.3, respectively; [/Fe] = +0.4 is adopted), with base atmospheric models from Allard & Hauschildt (1995). Each of these contour lines has three data points at [Fe/H] = 1.3, 2.3, and 3.3, and we note that the 0.08 and 0.083 M☉ iso-mass lines join almost seamlessly on those of Chabrier & Baraffe (1997) (with differences of only 10 K in at [Fe/H] = 1.3). The mass– relationship (in the range 0.01–0.2 M☉) shown by the Burrows models (e.g. fig 5; Burrows et al., 2001) leads to a ‘transition zone’ below the HBMM and above 1200 K, where object is very sensitive to mass and metallicity. The internal energy of halo brown dwarfs in this transition zone is partially provided by unsteady nuclear fusion (e.g. fig. 8; Chabrier & Baraffe, 1997). This transition zone is also manifest as a substellar subdwarf gap between the evolutionary tracks of low-mass stars and brown dwarfs (e.g. fig. 8; Burrows et al., 2001), which should lead to a sparsity of objects in this region (e.g. fig. 10; Burgasser, 2004a) due to the narrow mass range across a broad .
The transition zone region is clear in our Fig. 9, lying between the green HBMM limit and 1200 K. The width of the range of the transition zone increase from 1000 K at [Fe/H] = 1.0 to 1800 K at [Fe/H] = 3.3. Most of the esdL and usdL subdwarfs are in the transition zone except for some early type L subdwarfs that are VLMS just above the HBMM. SDSS J0104+15, 2MASS J1626+39, SDSS J125602, ULAS J151900, 2MASS J061664, and 2MASS J0532+82 are all in the transition zone.
Halo brown dwarfs with mass of 0.075–0.01 M☉ should have evolved to T and Y types after over 10 Gyr of cooling. However, we have not found such objects to-date (with expected K and [Fe/H] 1.0). T and Y dwarfs have significantly higher number density in the solar neighbourhood (e.g. fig. 11; Kirkpatrick et al., 2012). If the dependence of substellar formation on metallicity is negligible (as suggested by numerical simulations; Bate, 2014), the ratio between T/Y and L subdwarfs in the halo should be much higher than that of T/Y and L dwarfs, since old halo L subdwarfs cover a much narrower mass range. This points towards a large population of undiscovered T and Y subdwarfs in the local volume.
4 Summary and conclusions
We have presented an X-shooter optical–NIR spectrum of SDSS J0104+15, and re-classified this object as a usdL1.5 subdwarf. We measured its astrometry and kinematics and determined and [Fe/H] by fitting the spectrum to the BT-Settl models. With [Fe/H]=2.4 0.2 SDSS J0104+15 is the most metal-poor L subdwarf known to-date. We also constructed a metallicity– diagram, within which we identified the location of the HBMM limit and a halo brown dwarf transition zone beneath this limit down to 1200 K. This transition zone is caused by a steep decline in the mass– relationships across the stellar–substellar boundary, due to unsteady nuclear fusion. It covers a narrow mass range but spans a wide range, leading to a substellar subdwarf gap over the mid L to early T type range. Our and [Fe/H] estimates for SDSS J0104+15 place it below the HBMM boundary making it the most metal-poor (and highest mass) brown dwarf yet known. Joining SDSS J0104+15 in the transition zone we identify 2MASS J0532+82, 2MASS J061664, SDSS J125602, 2MASS J1626+39, and ULAS J151900. The existence of substellar objects that are as metal poor as SDSS J0104+15 supports formation theories for stars in this mass and metallicity domain (Clark et al., 2011; Greif et al., 2011; Basu, Vorobyov, & DeSouza, 2012; Bate, 2014).
Large scale NIR surveys, such as the ‘Visible and Infrared Survey Telescope for Astronomy’ (VISTA; Sutherland et al., 2015) Hemisphere Survey (VHS; McMahon et al., 2013) have great potential to identify additional objects that are more metal poor and cooler than SDSS J0104+15. Improvements in ultra-cool model atmospheres will guide future searches for VMP VLMS and brown dwarfs. Accurate theoretical predictions of -band flux are particularly important, because it is more difficult to detect these objects in the band that is largely suppressed due to enhanced CIA H2. Further more, the future ESA (Laureijs et al., 2011) spectroscopic survey covers a wavelength range of 1100-2000 nm (approximately covering the and bands), and information from band spectra will be very important for the characterization of these objects with .
Acknowledgements
This work is based in part on data obtained as part of the UKIRT Infrared Deep Sky Survey. The UKIDSS project is defined in Lawrence et al. (2007). UKIDSS uses the UKIRT Wide Field Camera (WFCAM; Casali et al., 2007). The photometric system is described in Hewett et al. (2006), and the calibration is described in Hodgkin et al. (2009). The pipeline processing and science archive are described in Irwin et al. (2004) and Hambly et al. (2008). This publication makes use of data products from the Sloan Digital Sky Survey (York et al., 2000), the Two Micron All Sky Survey (Skrutskie et al., 2006), the Wide-field Infrared Survey Explorer (Wright et al., 2010), the VLT Survey Telescope ATLAS survey (Shanks et al., 2015), and the Pan-STARRS1 survey (Chambers et al., 2016). This publication has made use of data from the VISTA Hemisphere Survey, ESO Progamme, 179.A-2010 (PI: McMahon) and the VIKING survey from VISTA at the ESO Paranal Observatory, programme ID 179.A-2004. Data processing has been contributed by the VISTA Data Flow System at CASU, Cambridge and WFAU, Edinburgh.
Research has benefited from the M, L, and T dwarf compendium housed at DwarfArchives.org and maintained by Chris Gelino, Davy Kirkpatrick, and Adam Burgasser. This research has benefited from the SpeX Prism Spectral Libraries, maintained by Adam Burgasser at http://www.browndwarfs.org/spexprism.
ZHZ and NL are partially funded by the Spanish Ministry of Economy and Competitiveness (MINECO) under the grants AYA2015-69350-C3-2-P. DH is supported by Sonderforschungsbereich SFB 881 ‘The Milky Way System’ (subproject A4) of the German Research Foundation (DFG). FA received funding from the French ‘Programme National de Physique Stellaire’ (PNPS) and the ‘Programme National de Planétologie’ of CNRS (INSU). The computations of atmosphere models were performed in part on the Milky Way supercomputer, which is funded by the Deutsche Forschungsgemeinschaft (DFG) through the Collaborative Research Centre (SFB 881) ‘The Milky Way System’ (subproject Z2) and hosted at the University of Heidelberg Computing Centre, and at the Pôle Scientifique de Modélisation Numérique (PSMN) at the École Normale Supérieure (ENS) in Lyon, and at the Gesellschaft für Wissenschaftliche Datenverarbeitung Göttingen in collaboration with the Institut für Astrophysik Göttingen.
References
- Aganze et al. (2016) Aganze C., et al., 2016, AJ, 151, 46
- Allard & Hauschildt (1995) Allard F., Hauschildt P. H., 1995, ApJ, 445, 433
- Allard, Homeier, & Freytag (2014) Allard F., Homeier D., Freytag B., 2014, ASInC, 11, 33
- Appenzeller et al. (1998) Appenzeller I., et al., 1998, Messenger, 94, 1
- Bailer-Jones (2004) Bailer-Jones C. A. L., 2004, A&A, 419, 703
- Baraffe et al. (1997) Baraffe I., Chabrier G., Allard F., Hauschildt P. H., 1997, A&A, 327, 1054
- Baraffe et al. (2003) Baraffe I., Chabrier G., Barman T. S., Allard F., Hauschildt P. H., 2003, A&A, 402, 701
- Basri, Marcy, & Graham (1996) Basri G., Marcy G. W., Graham J. R., 1996, ApJ, 458, 600
- Basu, Vorobyov, & DeSouza (2012) Basu S., Vorobyov E. I., DeSouza A. L., 2012, AIPC, 1480, 63
- Beers & Christlieb (2005) Beers T. C., Christlieb N., 2005, ARA&A, 43, 531
- Bate (2014) Bate M. R., 2014, MNRAS, 442, 285
- Bates (1952) Bates D. R., 1952, MNRAS, 112, 40
- Bowler, Liu, & Cushing (2009) Bowler B. P., Liu M. C., Cushing M. C., 2009, ApJ, 706, 1114
- Bromm, Coppi, & Larson (2002) Bromm V., Coppi P. S., Larson R. B., 2002, ApJ, 564, 23
- Burgasser et al. (2003) Burgasser A. J., et al., 2003, ApJ, 592, 1186
- Burgasser (2004a) Burgasser A. J., 2004a, ApJS, 155, 191
- Burgasser (2004b) Burgasser A. J., 2004b, ApJ, 614, L73
- Burgasser & Kirkpatrick (2006) Burgasser A. J., Kirkpatrick J. D., 2006, ApJ, 645, 1485
- Burgasser, Cruz, & Kirkpatrick (2007) Burgasser A. J., Cruz K. L., Kirkpatrick J. D., 2007, ApJ, 657, 494
- Burgasser et al. (2009) Burgasser A. J., Witte S., Helling C., Sanderson R. E., Bochanski J. J., Hauschildt P. H., 2009, ApJ, 697, 148
- Burrows et al. (1998) Burrows A., et al., 1998, ASPC, 134, 354
- Burrows et al. (2001) Burrows A., Hubbard W. B., Lunine J. I., Liebert J., 2001, RvMP, 73, 719
- Caffau et al. (2011) Caffau E., et al., 2011, Nature, 477, 67
- Gaia Collaboration et al. (2016) Gaia Collaboration, et al., 2016, A&A, 595, A2
- Casali et al. (2007) Casali M., et al., 2007, A&A, 467, 777
- Chabrier & Baraffe (1997) Chabrier G., Baraffe I., 1997, A&A, 327, 1039
- Chabrier (2003) Chabrier G., 2003, PASP, 115, 763
- Chambers et al. (2016) Chambers K. C., et al., 2016, arXiv, arXiv:1612.05560
- Chieffi et al. (2001) Chieffi A., Domínguez I., Limongi M., Straniero O., 2001, ApJ, 554, 1159
- Clarke et al. (2010) Clarke J. R. A., et al., 2010, MNRAS, 402, 575
- Clark et al. (2011) Clark P. C., Glover S. C. O., Klessen R. S., Bromm V., 2011, ApJ, 727, 110
- Cushing et al. (2009) Cushing M. C., Looper D., Burgasser A. J., Kirkpatrick J. D., Faherty J., Cruz K. L., Sweet A., Sanderson R. E., 2009, ApJ, 696, 986
- Freudling et al. (2013) Freudling W., Romaniello M., Bramich D. M., Ballester P., Forchi V., García-Dabló C. E., Moehler S., Neeser M. J., 2013, A&A, 559, A96
- Dieterich et al. (2014) Dieterich S. B., Henry T. J., Jao W.-C., Winters J. G., Hosey A. D., Riedel A. R., Subasavage J. P., 2014, AJ, 147, 94
- Dotter et al. (2010) Dotter A., et al., 2010, ApJ, 708, 698
- Frebel et al. (2005) Frebel A., et al., 2005, Nature, 434, 871
- Gizis (1997) Gizis J. E., 1997, AJ, 113, 806
- Greif et al. (2011) Greif T. H., Springel V., White S. D. M., Glover S. C. O., Clark P. C., Smith R. J., Klessen R. S., Bromm V., 2011, ApJ, 737, 75
- Hambly et al. (2008) Hambly N. C., et al., 2008, MNRAS, 384, 637
- Hewett et al. (2006) Hewett P. C., Warren S. J., Leggett S. K., Hodgkin S. T., 2006, MNRAS, 367, 454
- Hodgkin et al. (2009) Hodgkin S. T., Irwin M. J., Hewett P. C., Warren S. J., 2009, MNRAS, 394, 675
- Irwin et al. (2004) Irwin M. J., et al., 2004, SPIE, 5493, 411
- Johnson & Soderblom (1987) Johnson D. R. H., Soderblom D. R., 1987, AJ, 93, 864
- Jofré & Weiss (2011) Jofré P., Weiss A., 2011, A&A, 533, A59
- Jordi (2014) Jordi C., 2011, Photometric relationships between Gaia photometry and existing photometric systems, http://www.rssd.esa.int/cs/livelink/open/2760608
- Kirkpatrick et al. (2012) Kirkpatrick J. D., et al., 2012, ApJ, 753, 156
- Kirkpatrick et al. (2014) Kirkpatrick J. D., et al., 2014, ApJ, 783, 122
- Kirkpatrick et al. (2016) Kirkpatrick J. D., et al., 2016, ApJS, 224, 36
- Laureijs et al. (2011) Laureijs R., et al., 2011, arXiv, arXiv:1110.3193
- Lawrence et al. (2007) Lawrence A., et al., 2007, MNRAS, 379, 1599
- Lépine, Rich, & Shara (2007) Lépine S., Rich R. M., Shara M. M., 2007, ApJ, 669, 1235
- Lépine & Scholz (2008) Lépine S., Scholz R.-D., 2008, ApJ, 681, L33
- Lodieu et al. (2010) Lodieu N., Zapatero Osorio M. R., Martín E. L., Solano E., Aberasturi M., 2010, ApJ, 708, L107
- Lodieu et al. (2017) Lodieu N., Espinoza Contreras M., Zapatero Osorio M. R., Solano E., Aberasturi M., Martín E. L., Rodrigo C., 2017, A&A, 598, A92
- Mace et al. (2013) Mace G. N., et al., 2013, ApJ, 777, 36
- Magazzu, Martin, & Rebolo (1993) Magazzu A., Martin E. L., Rebolo R., 1993, ApJ, 404, L17
- Martín et al. (1999) Martín E. L., Delfosse X., Basri G., Goldman B., Forveille T., Zapatero Osorio M. R., 1999, AJ, 118, 2466
- McMahon et al. (2013) McMahon R. G., Banerji M., Gonzalez E., Koposov S. E., Bejar V. J., Lodieu N., Rebolo R., VHS Collaboration, 2013, Messenger, 154, 35
- Murray et al. (2011) Murray D. N., et al., 2011, MNRAS, 414, 575
- Pavlenko et al. (2015) Pavlenko Y. V., Zhang Z. H., Gálvez-Ortiz M. C., Kushniruk I. O., Jones H. R. A., 2015, A&A, 582, A92
- Pinfield et al. (2012) Pinfield D. J., et al., 2012, MNRAS, 422, 1922
- Rebolo et al. (1996) Rebolo R., Martin E. L., Basri G., Marcy G. W., Zapatero-Osorio M. R., 1996, ApJ, 469, L53
- Saumon et al. (2012) Saumon D., Marley M. S., Abel M., Frommhold L., Freedman R. S., 2012, ApJ, 750, 74
- Scholz et al. (2004) Scholz R.-D., Lehmann I., Matute I., Zinnecker H., 2004, A&A, 425, 519
- Shanks et al. (2015) Shanks T., et al., 2015, MNRAS, 451, 4238
- Siess, Livio, & Lattanzio (2002) Siess L., Livio M., Lattanzio J., 2002, ApJ, 570, 329
- Sivarani et al. (2009) Sivarani T., Lépine S., Kembhavi A. K., Gupchup J., 2009, ApJ, 694, L140
- Skrutskie et al. (2006) Skrutskie M. F., et al., 2006, AJ, 131, 1163
- Soubiran et al. (2016) Soubiran C., Le Campion J.-F., Brouillet N., Chemin L., 2016, A&A, 591, A118
- Spagna et al. (2010) Spagna A., Lattanzi M. G., Re Fiorentin P., Smart R. L., 2010, A&A, 510, L4
- Sutherland et al. (2015) Sutherland W., et al., 2015, A&A, 575, A25
- Vernet et al. (2011) Vernet J., et al., 2011, A&A, 536, A105
- West et al. (2008) West A. A., Hawley S. L., Bochanski J. J., Covey K. R., Reid I. N., Dhital S., Hilton E. J., Masuda M., 2008, AJ, 135, 785
- Woolf & Wallerstein (2005) Woolf V. M., Wallerstein G., 2005, MNRAS, 356, 963
- Wright et al. (2010) Wright E. L., et al., 2010, AJ, 140, 1868
- Yoshida et al. (2006) Yoshida N., Omukai K., Hernquist L., Abel T., 2006, ApJ, 652, 6
- York et al. (2000) York D. G., et al., 2000, AJ, 120, 1579
- Zhang et al. (2013) Zhang Z. H., et al., 2013, MNRAS, 434, 1005
- Zhang et al. (2017) Zhang Z. H., et al., 2017, MNRAS, 464, 3040