Traffic Lights with Auction-Based Controllers:
Algorithms and Real-World Data
Abstract
Real-time optimization of traffic flow addresses important practical problems: reducing a driver’s wasted time, improving city-wide efficiency, reducing gas emissions and improving air quality. Much of the current research in traffic-light optimization relies on extending the capabilities of traffic lights to either communicate with each other or communicate with vehicles. However, before such capabilities become ubiquitous, opportunities exist to improve traffic lights by being more responsive to current traffic situations within the current, already deployed, infrastructure. In this paper, we introduce a traffic light controller that employs bidding within micro-auctions to efficiently incorporate traffic sensor information; no other outside sources of information are assumed. We train and test traffic light controllers on large-scale data collected from opted-in Android cell-phone users over a period of several months in Mountain View, California and the River North neighborhood of Chicago, Illinois. The learned auction-based controllers surpass (in both the relevant metrics of road-capacity and mean travel time) the currently deployed lights, optimized static-program lights, and longer-term planning approaches, in both cities, measured using real user driving data.
keywords:
Traffic Lights, Traffic Flow, Signal Timing, Traffic Estimation, Adaptive Traffic Management, Light Schedule Estimation, Machine Learning, Stochastic Search1 Introduction
Traffic congestion is a practical problem resulting in substantial delays, extra fuel costs, and unnecessary harmful gas emissions. In urban areas, traffic is largely controlled by traffic lights. Improving their control and responsiveness to existing travel flows holds immense potential for alleviating congestion and its associated problems.

Inefficient configuration of traffic lights remains a common problem in many urban areas – one of the largest complaints of commuters in the Mountain View, California area is the amount of traffic they face during the morning and evening rush hours. One of the problem areas, controlled by seven main lights, is shown in Figure 1 (Top). The goal of our project is to evaluate the timing of the traffic lights on these intersections and also improve them through either better control algorithms or improved sensors. For example, many traffic lights are based on “fixed cycles”, which means that they are set to green, yellow and red for fixed amounts of time. Rarely is this an optimal solution, as real-time traffic situations are not considered, and can leave cars waiting in long queues to satisfy shorter queues or even empty queues. Nonetheless, even assuming fixed-length, non-traffic-responsive lights, it is possible to optimize the light timings to utilize historic knowledge of average (or worst case) flows that have been observed. Such approaches are often tackled through the use of genetic algorithms to optimize the light timings (phases and offsets) [1, 2, 3, 4]. An alternate approach to the learning/optimization approaches of stochastic search algorithms are methods that use reinforcement learning to discover optimal policies for the lights and/or cars [5, 6, 7, 8].
The methods referenced above have not only been applied to fixed-policy lights, but also to lights that use vehicle sensors to provide real-time traffic state information to the light controllers. Additionally, many researchers have looked into future possibilities where car-to-car, light-to-car, and car-to-light communication exists [9, 10, 11]. Such communication allows for better light control through the possibility of explicitly and directly communicating light schedules to cars and car arrival times to lights. Further, if we consider communication from lights to other lights, such that each light could communicate its schedule as well as the flows it is observing, more detailed planning and scheduling schemes can be created [12, 13, 14]. A good overview can be found in [15].
It should be mentioned that approaches relying on a centralized controller or hierarchies of controllers have also been explored in the research literature. However, the more coordination that is assumed, the greater the difficulties encountered in scalability. Further, the problem of system “nervousness” grows when central coordination is assumed — small changes in the overall state of the system may require large changes at the lower levels [16]. For scalability, we concentrate only on local-decision making in this paper.
In the bidding-based traffic light controllers presented here, external information is provided solely through local sensors (the most common being physically nearby in-roadway induction loop sensors111Induction loop sensors are placed inside the roadway’s pavement and, at a high-level, work by creating an electromagnetic field around the loop area. As vehicles enter and exit the field, fluctuations in the field are recorded as an indication that a car has passed over [17]. They are widely deployed, and have been in use since the 1960s. or cameras). Rather than creating ad hoc rules for controlling light-changes, the sensor information is placed within the framework of a micro-auction. When a light (phase) change is permitted, the light controller collects bids from all the phases and conducts a micro-auction to determine the next phase. Each phase’s bids are set by current readings from local induction-loop sensors. The bidding process and the weights of the bids are learned by our system through the use of large-scale, real, historic data collected from opted-in Android cell phone users.
This paper builds upon two branches of work: our initial studies with micro-auction based controllers [18] and the data-driven estimation of deployed traffic lights [19]. To avoid potential confusion, it should be remarked that the auctions in this paper substantially differs from auction-related approaches in which drivers and/or automated cars bid for the right of way [20, 21, 22] to gain favorable light timings. In this work, the micro-auctions serve as a unifying internal mechanism to handle the complexities of prioritizing the different phases (colors/settings) of the lights.
There are two primary contributions of this work. The first, as described above, is the introduction of an auction-based controller that relies primarily on currently deployed sensors and does not assume the existence of future communication between sensors. The proposed controller is tested on months of real data in two large cities. The second contribution of this paper is to provide a novel method for establishing a realistic baseline of performance based on the currently deployed traffic controllers. This addresses an often overlooked pragmatic issue — in many real environments, access to the programs of the existing light deployed throughout cities is not available. Without this information, however, realistically assessing improvements over baselines is impossible. We address this problem through a novel method of creating models of the behavior of the currently deployed lights based on observed traffic data. This yields a realistic baseline of performance with which to compare proposed improvements — including those of our own traffic controllers.
To provide the necessary background for understanding traffic light control, in the next section, we briefly describe how to simulate unconstrained transitioning between light phases, which is fundamental for fully responsive controllers. We also describe a powerful recent state of the art planning-based traffic controller [12] which was has been successfully deployed in Pittsburgh, Pennsylvania. This provides a strong competitor to our approach. Section 3 details our micro-auction controller. All of the methods presented in this paper require learning many parameters. A simple learning/optimization procedure, termed Next Ascent Stochastic Hillclimbing (NASH), is presented in Section 4. Experiments with alternative optimization procedures, such as Genetic Algorithms and Probabilistic Model Based Optimization, are also described.
As mentioned earlier, a real baseline of performance, one which considers the programs/schedules of the currently deployed lights, is difficult to obtain. Before we present our final results, in Section 5, we describe a practical method to estimate the behavior of the currently deployed traffic light schedules based on collected traffic data. Although this section is not part of the auction-based algorithm itself, the procedures presented in this section are vital to accurately estimate the real expected differences in performance over current traffic-light programs.
With the baselines obtained through the methods described in Section 5, we can provide confident measurements of the effects of bidding-based traffic controllers. Large scale, extensive, empirical results are presented in Sections 6 & 7, for Mountain View California and Chicago, Illinois. The auction-based controllers yield improvements in the both the important measurements of road-capacity and mean travel time within both urban environments. The paper concludes with directions for future work in Section 8.
2 Background Context: Traffic Light Control with Unconstrained Transitions
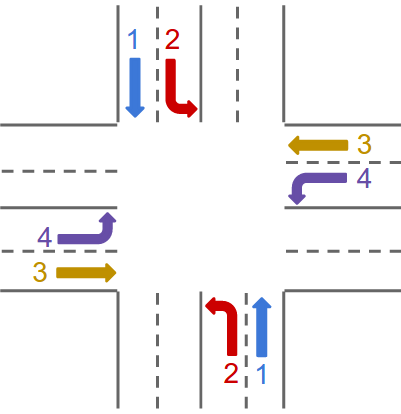
At a high level, whenever there is a transition from one traffic-light phase to another, where some of the lights that were green become red, there is the need for an intermediate phase, a yellow phase, to provide warning to the affected drivers to stop or to proceed, based on their speed and distance to the intersection. In static traffic lights, the sequence of green phases is simply round-robin (e.g., in Figure 2, repeatedly going through the four indicated green phases in counting order). In the case of round-robin transitions, since the sequence of greens is fixed and pre-defined, it follows that there is only one yellow phase that will follow any given green phase. However, when we employ traffic sensor inputs, we are given the flexibility for out-of-sequence transitions (e.g., phase 1, then phase 3, and so on), based on the readings of the current intersection’s local induction loops. This may yield improved traffic flow, but it also introduces the need for additional yellow-phase logic.
In our experiments, both with planning-based lights and micro-auction based lights, in order to be responsive to sensed-traffic, we allow lights to make out-of-sequence transitions between green phases. This allows more complete use of the intersection capacity. In addition, when the traffic-light logic includes advance planning, there is a second advantage to out-of-sequence transitions by shortening the planning horizon. With planning-based logic, forcing a round-robin sequencing necessitates long planning horizons to avoid making short-sighted decisions — the light must plan ahead for the combined duration of all the phases in the cycle. In contrast, with unconstrained sequences, the light only needs to plan ahead for the duration of a single yellow phase.
Which of the signal lights needs to be yellow depends on the specific combination of the previous and subsequent green phases. Since we allow out-of-sequence transitions between green phases, we create a grid of the correct yellow phases to place between each transition. During the simulation setup [23], for each pair of green phases, if any green state needs to change to a red state, the intermediate yellow phase is simply constructed by setting those soon-to-be-red states as yellow. The second step is setting the duration of the yellow. We can look at the states that are marked as yellow and trace backwards from them to the maximum of the speed limits for the lanes that those signal states control. The yellow for that pair is set to the maximum speed divided by the Department Of Transportation (DOT)-recommended safe deceleration rate of 3 m/s2 [24] plus a reaction time of 1 second.
As an implementation note, we remark here that all experiments were conducted within the SUMO [23] simulator. SUMO (Simulation of Urban MObility) is a traffic micro simulation package [25], that uses discrete time steps (1 msec each) in its simulations but keeps a continuous representation of location, distance, and speed. 222Two important considerations in selecting SUMO were: (1) SUMO is written in a combination of C++ and Python that can be easily modified; this was important for being able to handle non-standard light logic. (2) The free license allows us to parallelize it on multiple machines; in our tests, thousands of tests have been carried out simultaneously — allowing deeper exploration than would be possible with more restrictive licenses. This continuous spatial representation improves simulations that include congested surface streets, compared to many discrete-space alternatives [26].
2.1 Prior Work: Long-Term Planning Based Approaches
The micro-auction based traffic lights that are the focus of this paper are reactive by design; they do not have a planning mechanism for future events. Complementary approaches, such as planning based traffic lights that attempt to anticipate the traffic that will arrive in the future, provide additional avenues to explore. We have implemented planning based lights to compare their effectiveness with micro-auction lights. One implementation of planning based lights is described here.
Inspired by the exemplary results of the Carnegie Mellon University Pittsburgh traffic-light deployment [12], we implemented a traffic light controller that uses remote sensors and planning for controlling when traffic phase switches occur. With the planning-based approach, we solve the phase scheduling problem by collecting the traffic data from a sequence of induction loops that are tied to a given phase of the traffic light, with the loops spaced at about 3 seconds of expected travel time apart from each other. The sensors are placed in the roadway, spaced at distances dictated by the speed limit and this target separation time. In the planning-based approach, we use these sensors for both occupancy and speed data [27]. We assume that they have been placed on all lanes that could lead traffic to the controlled intersection in 15 seconds (or less) of travel. When intersections are closely spaced, these non-local sensors may be on the other side of other intersections, leading to a large web of sensors and distributed communication. While this likely includes more sensors (and communication) than is minimally required, it enables us to create a detailed speed and occupancy profile for each section of road, which is useful for planning.
Internal to our planning-based traffic lights, we maintain time lines of when we expect cars (observed by local and remote induction loops) to arrive at the controlled intersection. The car counts (from induction loops) are scaled by a learned weighting factor, based on the historically observed turning ratios between the sensor and the traffic light, as well as the historically observed rates for which the phase will be needed by the incoming traffic (e.g., straight or left turn at the controlled intersection itself). The distance-to-time mapping used to put the car onto the time line is based on the observed speed profile for the road (also from the known induction loops). Finally, we use dynamic programming to solve for the best phase sequence and transition times. Since this is a crucial part of the planning process, it is described in more detail.
The dynamic-programming search is initialized with a single potential schedule that has the start time of the current phase as its (already past) starting point. If there are cars waiting at the traffic light on other phases, it increases the solution space by considering a phase change to each of the other phases that are in demand, taking into account the yellow-duration lead time needed for scheduling. For example, considering Figure 2, if phase 3 is the current phase and there is traffic waiting for phase 1 and phase 2, the space of possible solutions will expand to three possibilities: (a) remaining on phase 3; (b) changing to phase 1; and (c) changing to phase 2. This expansion of the possible solution space continues with new possible branches being introduced each time a new car arrives.
The timing of the phase changes is restricted so that the minimum time given for each phase of the light (plus the yellow duration) is respected: e.g. if phase 4 requires a minimum duration of 3 seconds, then the next possible phase change will be postponed until 3 seconds plus the yellow duration after the start of phase 4. Also, if the current phase is expected to be “empty” before the arrival of the new traffic (that is, no cars waiting as measured by the local induction loop sensors and no cars arriving as measured by the remote induction loop sensors), the proposed phase change for the newly arriving traffic is moved up to be as early as possible, such that the yellow will start just after the current phase is empty. This early change has the advantage of reducing the amount of time that the intersection remains under utilized.
Given the complete description of how phases can change, the scheduling solution is then selected based on minimizing a combination of three penalties (the automatic setting of the weights of these penalties is described in Section 4).
-
1.
Speed-loss penalty: This is the penalty for forcing a car to stop. The penalty is scaled by the speed limit of the road that the car will be traveling onto. That speed was chosen since it best reflects the acceleration that the car will require, that it otherwise would not have needed had it not been forced to stop.
-
2.
Waiting-time penalty: This is a penalty that is linear in the amount of time that each car must wait at a red light.
-
3.
Phase-change penalty: This is a penalty that is added for each proposed phase change. It increases the penalty on the schedules that unnecessarily cycle through the different phases when there is no waiting or incoming traffic.
The solution space is repeatedly expanded and then pruned, using the approach described in [14]. It is expanded by moving forward through all of the arrival times of incoming traffic. After each expansion, the solution space is checked for schedules that can be pruned. Pruning of candidate solutions happens with solutions that end on the same phase and have the same number of waiting cars as other solutions, but have higher associated partial costs (longer times). Experiments with the planning-based controllers are presented in Section 6.
In contrast to the approaches described in this section, the alternatives that we propose, auction-based controllers, do not create plans and are purely reactive. They are described next.
3 Auction-Based Controllers
In this section, a detailed description of the new auction-based controllers is provided. In contrast with the planning-based traffic-light control [14], the auction-based approach does not require the use of remote sensors since no planning is required. Instead, only the typical induction loops that are placed at the entrance lanes to the controlled intersection are used. Because we rely only on existing roadway infrastructure, these controllers should be easier to deploy than those that require remote communication.
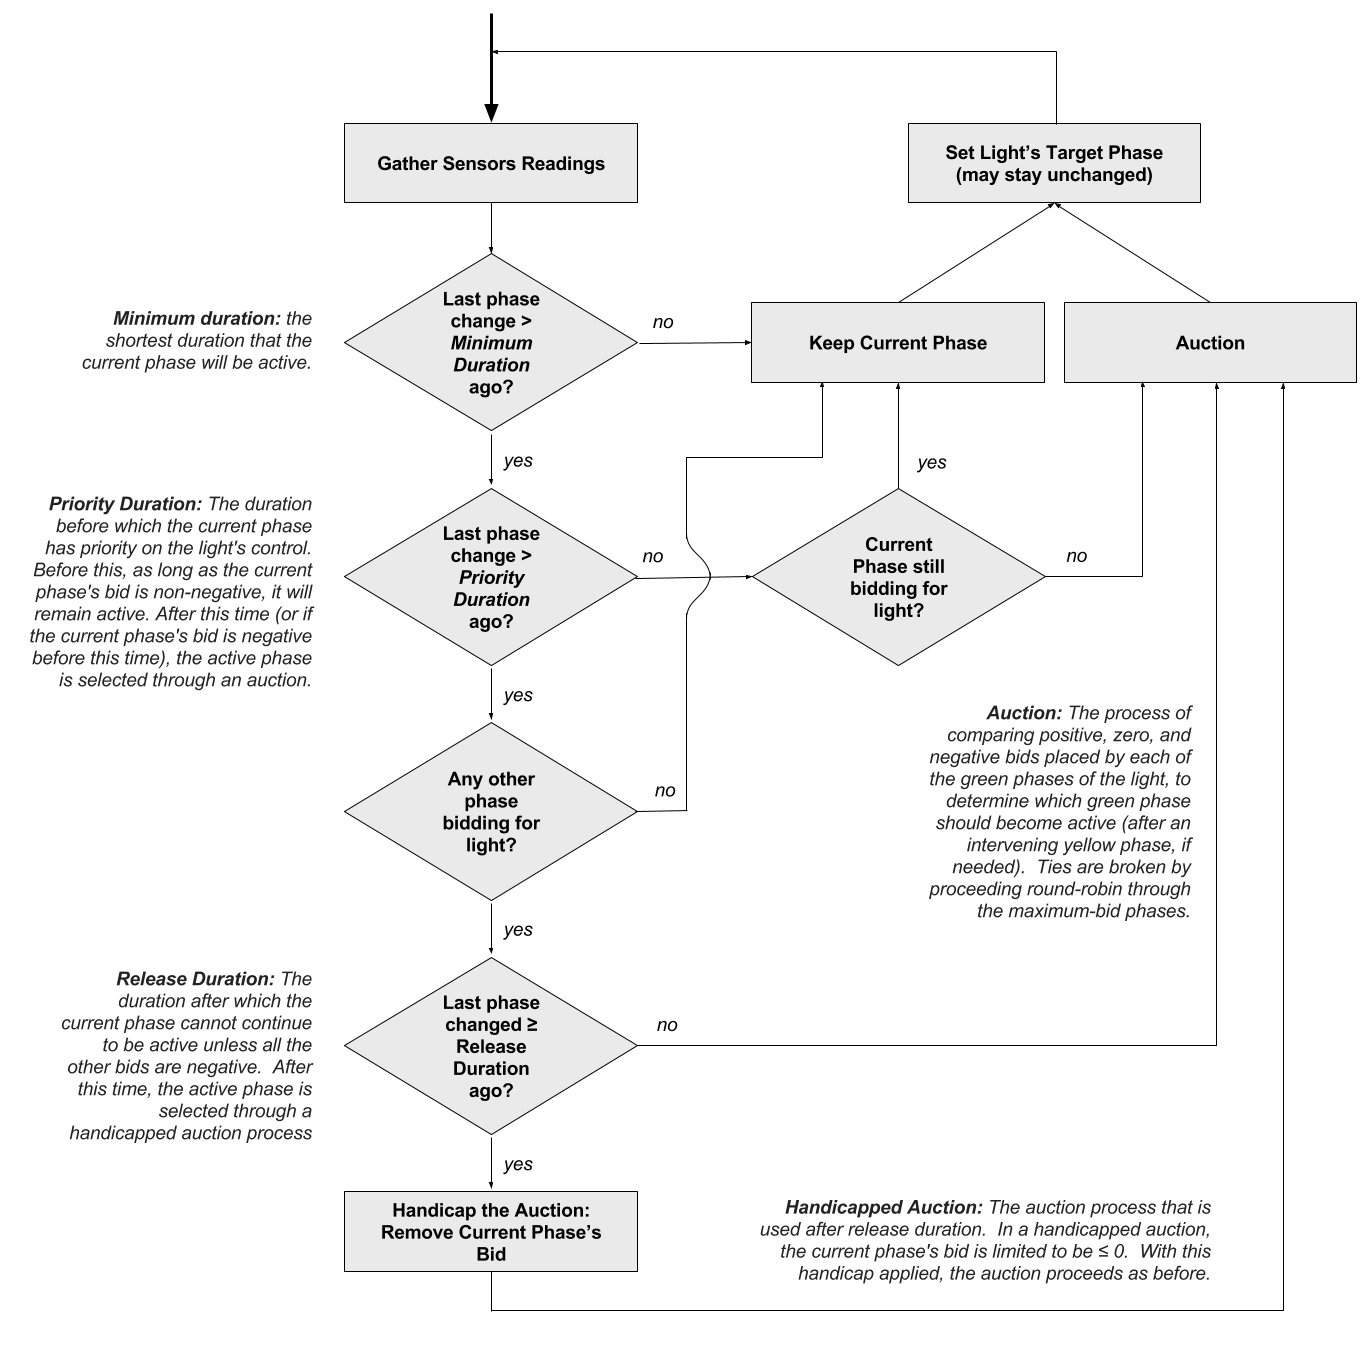
At a high level, each phase of the auction-based traffic light logic has three time-separated behaviors (see Figure 3). The timing and inputs used for these behaviors are optimized to the general traffic patterns that are expected a given time of day (e.g., morning commute hours). Based on our tests, it is the combination of these three behaviors along with the parameter optimization that are responsible for the improved efficiency witnessed over static timed and planning-based approaches. The behaviors are described below and the parameter optimization is explained in the next section.
In auction-based logic, each traffic-light phase definition includes a weighted list of sensors that is to be used by that phase to determine its bid for the cycle at any given time. The weights can be positive or negative and are used to effectively scale the number of cars observed on that sensor. For example, a phase for a lower-priority road could include in its sensor list a negative-weighted induction loop from in front of the higher-priority road, so that the lower-priority road would be more likely to release the phase when cars arrive from the higher-priority direction. Similarly, a more heavily-used phase could use a larger positive weight for some of its own sensors, to allow it to out-bid the lighter-traffic direction. Instead of having these weighted lists of sensors be given as a fixed input that is manually specified, the learning procedure selects both which of the local sensors to use and their associated weight for each phase. Formally, a bid is the weighted sum of the current, local induction-loop measurements (): the bid for phase is . The weights () are selected in the learning process (see Section 4). When the learning process sets , we refer to that as having removed sensor from phase .
As shown in Figure 3, the way in which the traffic light decides whether to change phase depends on how long the current phase has been active. We use the terms minimum duration, priority duration, and release duration to separate the time intervals for these different behaviors. As suggested by its name, minimum duration is the minimum amount of time that a phase must be green before possibly changing to yellow. The minimum duration is given as an input to the simulation and can be set to be different for each phase of the light. For simplicity, we start with all of the minimum durations as 3 seconds but allow the learning procedure to adjust that to be larger, if needed to avoid too-fast switching between phases in light traffic. No phase changes can occur before minimum duration.
For each second between minimum duration and priority duration, the current phase has priority on the traffic light. If its bid for the cycle is non-negative (indicating that it would like to have the cycle), then it will keep the cycle, no matter what the bids of the other phases are. While this greedy approach may seem to be suboptimal, it has the advantage of increasing the average duration of the cycles and reducing the amount of time spent switching between green phases (and thereby reducing amount of time wasted on yellow lights). Again, we allow the learning procedure to adjust the priority duration to the expected traffic demands.
For each second between priority duration and release duration, an auction is held between the different phases. Each phase bids according to the weighted sum of the sensors that have been selected for that phase. If the highest bid is negative, then the current phase is the default winner of the cycle until one or more of the bids change. Otherwise, the phase with the highest bid will get the cycle (after the appropriate yellow). If multiple phases have the same winning bid, the winner is selected by simple round-robin selection.
For each second after the release duration, it is important to make phase switching less restrictive. The same type of auction is held with the added constraint that the current phase cannot bid an amount above zero. This non-positive bid by the current phase likely releases the cycle. Any other phase that would like to have the cycle will win the auction away from the current phase. If more than one of the other phases have positive bids, the auction process will pick the strongest bidder. Only if all the bids are strongly negative, is it possible for the current phase to stay green.
The progression restarts after the start of each green phase, progressing from non-negotiable (below minimum duration) to greedy (below priority duration) to auctioned (below release duration) to a handicapped auction (above release duration).
Because the learning procedure is allowed to remove any or all of the sensor inputs to any given phase’s bid, we designed our control logic to handle these cases. When a phase has no sensor inputs, it will continually place a zero bid for the light. If the learning procedure removes all sensor inputs from all phases of the traffic light, the auction logic results in the light behaving as a static light, using round-robin cycling and using each phase’s priority duration. Interestingly, in practice, the no-sensor configuration is automatically instantiated through our learning procedure for multiple lights; this will be discussed in the results sections.
4 Learning/Optimization Algorithms and Data Gathered
No matter which approach is used for traffic light control, fixed-schedule, long term planning, or micro-auctions, each has numerous internal parameters that must be set. For example, even with a simple fixed-schedule controller, the length of the phase and offsets of each light have a large impact on the performance of the overall system. Table 1 summarizes the parameters that characterize the behavior for a given traffic light in each of the three approaches explored here. Genetic Algorithms (GA) [28] have been most commonly used to set the numeric and enumerable values associated with traffic lights [1, 2, 3, 4].
| Fixed-Schedule | Planning | Micro-Auctions |
|---|---|---|
| Phase Lengths | Speed Loss Penalty Weight | Detector Weights |
| Phase Offsets | Waiting Time Penalty Weight | Detectors to Use |
| Phase-Change Penalty Weight | Durations (Minimum, Priority, Release) |
Following the published research, genetic algorithms were first attempted. A thorough overview of GAs can be found in [28]. Since genetic algorithms are themselves characterized by a number of control parameters, over 40 different combinations were tried. In the GA variants explored, the control parameters that were varied included: the mutation rate was varied between 0.5% - 10%, crossover type employed: uniform and single/multi point, the use of elitist selection (preserving best solution from one generation to the next), population sizes were set between 10-1000, and numerous crossover rates were attempted. Two settings consistently had the largest impact. The largest effect on the performance of the algorithm was observed in the setting of the mutation rate. Regardless of the other parameters, the entire population converged to far from-optimal candidate solutions that were then substantially improved through random mutations. Even when crossover was turned off (probability = 0.0%), the results were not statistically different than when crossover was used. The other control parameter, whether elitist selection was turned on, was important. In the runs where it was used, the final solutions found were consistently better than when it was not used.
In addition to GAs, probabilistic optimization approaches such as Population Based Incremental Learning (PBIL) [29], and variants that include explicit modeling of inter-parameter dependencies were also attempted [30, 31]. These probabilistic models provide a method to explicitly maintain the statistics that a genetic algorithm’s population implicitly maintains. A good overview of probabilistic optimization techniques is provided in [32]. For our experiments, the inter-parameter dependencies that were modeled were pair-wise dependencies using tree-shaped networks. As shown in [33], a simple algorithm can be employed to select the optimal tree-shaped network for a maximum-likelihood model of the data (in our case, the data is the high performing parameter settings found through search). This tree-model is then sampled to generate the next candidate solution in an analogous step to the crossover operation in a GA. Like the GAs attempted, a large driver of improvement was the mutation operator. 333Brief attempts with other heuristic optimization procedures were also conducted. Although they sometimes outperformed the GAs used, they did not provide any statistical benefit over simple hillclimbing. For simplicity, we use only hillclimbing throughout the remainder of this paper.
Based on the consistently large effects of the mutation operator on the quality of the solution obtained, a simpler search method Next-Ascent Stochastic Hillclimbing (NASH), was tried. It is described below.
Formally, we define to be the set of parameters that fully specify a given scenario. For instance, a micro-auction simulation containing 10 traffic lights would require setting parameters (5 parameters per light). Since different lights will (in general) employ different parameter settings, their behavior will not be identical. The goal of our optimization is to identify parameter set that minimizes the total travel time for the cars in the simulation (detailed more formally below). NASH operates in a manner similar to other stochastic hillclimbing methods:
-
1.
Perturb : Since is an aggregation of parameters, we randomly select a parameter (drawn with uniform probability) to perturb as:
where denotes a draw from the uniform distribution and denotes the set of legal values for a discrete parameter. In other words, we perturb continuous parameters by and assign a random legal value to enumerable parameters. We do not simultaneously perturb every parameter in ; the number of parameters changed in one operation is given by sampling (i.e., perturb no more than 5% of the total parameters in the simulation in each iteration). The perturbed parameter set is denoted as .
-
2.
Project onto valid subspace: Since the perturbation operation described above operates independently over parameters in , it can generate a setting that violates constraints over parameter subsets. For instance, increasing a phase length in a given fixed-schedule traffic light controller will break synchronization unless another phase length for the same light is reduced to keep the overall cycle constant. To address this, we employ an approach-specific repair operation over to adjust parameter settings (e.g., normalizing parameters for each light).
-
3.
Evaluate objective: With the parameter modifications, the new is evaluated with the desired objective function. The standard objective functions that have been used in the literature include: minimizing the overall or average wait time, maximum wait time, emissions, stop time, or maximizing throughput, speed, etc. For our studies, we set the objective function to minimize total travel time of all the cars that enter the region of interest during the observation interval.
Our implementation assigns a pre-generated route and entry time for each car in the simulation. These are drawn directly from the (anonymized) real gathered data of Android users, as will be described next, in Section 4.1. The exit time for the car depends on the traffic flow in the region of interest; in general, poor settings of result in the car exiting the region of interest later. Thus, the objective of total travel time is given by
where and denote the entry and exit times for car . Since is constant across iterations (deterministic arrival times and routes), and is determined by the parameter settings , our optimization problem can be concisely stated as
-
4.
Accept S’: If the perturbed parameters result in an improvement over on the objective, we accept the perturbed settings, . Otherwise, we discard .
This process is iterated until either a satisfactory solution is found or time expires. Though extremely simple, NASH worked as effectively as the other optimization methods tried, consistently outperforming GAs. Further, it was simpler to implement and faster in practice than GAs and building probabilistic models. This somewhat counter-intuitive result has also been observed by other researchers in exploring the trade-offs between genetic algorithms and stochastic hillclimbing techniques [34, 35, 36, 37]. This finding is especially pronounced in problems in which mutation (as opposed to the Genetic Algorithm’s primary search operator, crossover) is the main driver for improvement in the solution — as we have empirically found to be the case in this problem.
We employed a straightforward objective function that meets the goal of minimizing overall travel times. However, it is worth noting that many other objective functions could have been used. Two common ones include minimizing driver idle or wait-times and minimizing emissions. Although both of these can be used here with no change to the algorithms or optimization procedures (other than the objective function); their effects can be large. For example, in minimizing emissions, reducing stop times at lights and consistency of speed may take higher precedence than minimizing overall travel time. Although this may also reduce overall travel time, that reduction will be a side-effect of reducing the emissions. Additionally, other interesting, more specialized objective functions can be used as well, such as minimizing travel times on specified roads or routes, or even minimizing congestion at a specific light.
4.1 Anonymous Real-World Traffic Data
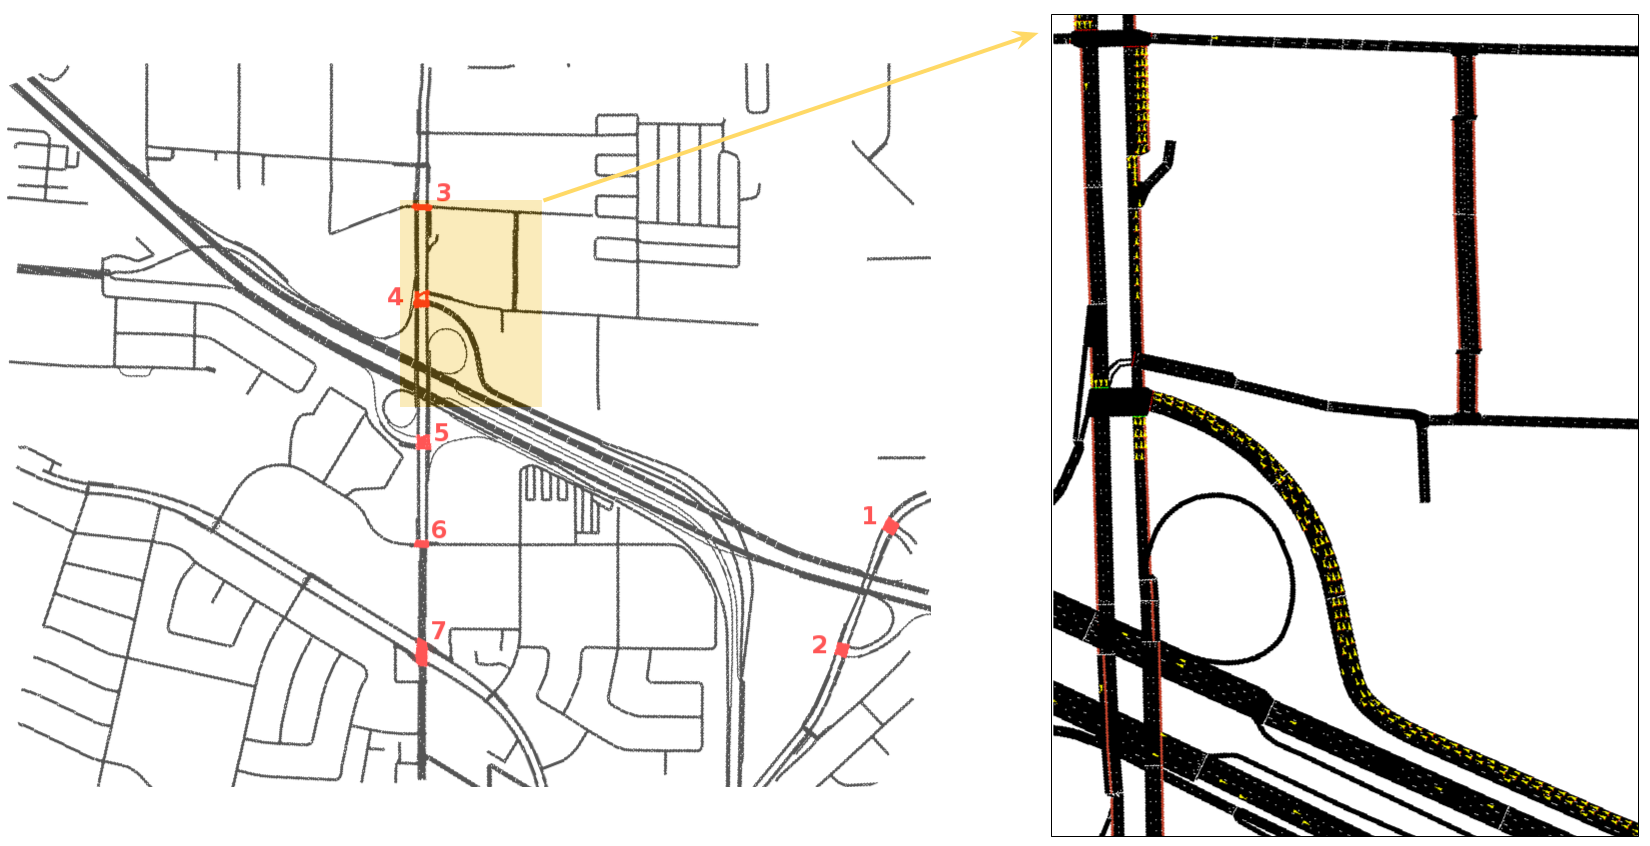
For the real-world experiments presented in this paper, two sets of data are needed: the roadway information (layout, speed limits, etc.), and travel-track information. To gather the road information, we combined the data available from Google maps and OpenStreetMap [38]. The results provided roadways as well as traffic light locations, as shown in Figure 4.
In addition to accurate road information, demand for each road section must be modeled. We created a demand profile through anonymized location data collected from opted-in Android cell phone users [39][40]. The data was collected over several months. The raw data, which itself does not include personally identifiable information, was additionally scrubbed by segmenting the travel-tracks to prevent association of trip origins and destinations to even further reduce identifiability risks. See Figure 4(Enlarged Section) for a sample of the data collected.
From this data, we further sub-select the data with travel-tracks that intersect with the map area shown. We also filter by time, limiting to looking at a given start and end date — in particular around rush hour periods. We then filter all the given times down to the weekday and time of day (e.g., Tuesday 7am local time). This provides a close-to-realistic profile of the road demand for Android users. By folding/overlapping the gathered data over weeks, we compensated for the fact that all travelers are not Android users who provide their data.
5 Establishing a Baseline: Modeling the Behavior of Currently Deployed Lights
Before conducting the experiments, we need a method of determining whether the new controllers will improve real traffic flow beyond the currently deployed traffic light controllers. In this section, we step away from discussing algorithms for traffic light control and examine the pragmatic issue of how to obtain the existing traffic light schedules and behaviors from which to create a realistic baseline of performance.
Unfortunately, for deployed traffic lights, the running light schedules/programs are often not known. Rarely are they kept in a central database, and even when they are, they are often not easily obtainable. The most straight-forward solution is to manually watch and time each traffic light in the city to be optimized. For lights on fixed schedules this may be theoretically feasible, but will likely be prohibitively expensive and time-consuming to do at scale. Nonetheless, without the existing schedule information, it is difficult to ascertain any real-improvements that new traffic light algorithms and approaches will have in reality.
We take a behaviorist approach to discover lights’ currently deployed schedules. We attempt to discover the light schedules for all the lights in the system we wish to model. This is done by creating models that match known car travel paths and timings that were observed in a large collection of gathered travel-tracks. If we can determine the lights’ programs accurately, when simulating the known travel-tracks through the city, the timings will match observed timings. With this derived model, we can simulate their performance light’s programs with varying traffic conditions to test how they will scale in comparison to any of the alternative light controllers that we propose.
Unlike the rest of this paper, in which which we use NASH to optimize controllers to improve traffic lights’ schedules, in this section, the goal is to obtain a light schedule that matches, as closely as possible, the behavior of the current pre-existing schedule. Recall that NASH relies on a repeated stochastic generation and evaluation methodology to guide search. The evaluation of the candidate traffic light schedules is controlled by setting an objective function (in the description of the NASH algorithm presented in Section 4, see step 3). Instead of using the commonly employed traffic-optimization objective functions to improve some aspect of flow throughput, we specify the following objective function based on similarity (formulated as a minimization task):
| (1) |
where and are the hypothesized and actual light settings, respectively, and denotes the set of cars in the simulation.
Minimizing this objective allows us to determine light settings that generate a simulated traffic flow that closely mirrors the actual flow. Note that although the constraint is not explicitly specified in Eqn. 1, the cars are all introduced into the system in the same order and at the same times as they were observed in the actual data; this is crucial to ensure that traffic jams and roadway usage are emulated correctly. As a reminder, note that this similarity measurement is suitable only for determining the currently deployed light schedules. Similarity is not the correct measurement to use when optimizing the light controllers to minimizing wait time, emissions, total travel time, etc. For those objectives, we will simply minimize the specific objective instead.
5.1 Validating the Estimates on Controlled Data
Because estimating deployed traffic light parameters is a novel part of this study, we validate the approach with a series of experiments using synthetic data before turning to real-world data. Using a smaller, synthetic, data set has the advantages of being noise-free and completely within our control to modify in order to examine different aspects of matching. For the synthetic data, 3200 cars were instantiated over a period of 4000 seconds to travel along the simple grid shown in Figure 5. The speed limit for each segment was chosen independently and randomly, and seven types of car were instantiated, with differing profiles in terms of acceleration/deceleration, following distance, length, etc.
Each simulated car’s path was chosen to start and end at randomly selected edge nodes. The path was constrained such that no intersection was visited twice. Vehicle launch times were uniformly randomly distributed over the 4000 seconds.
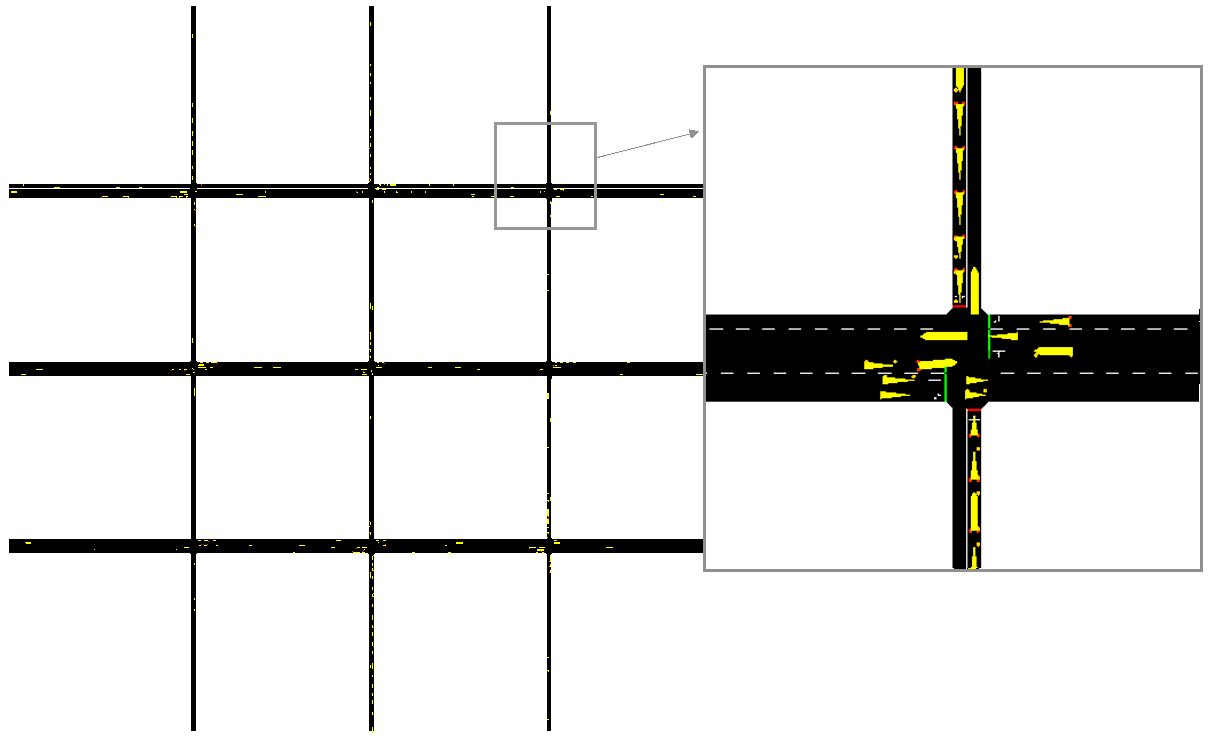
The 3200 cars were simulated in SUMO with a pseudo-randomized 444This light setting was significantly perturbed from SUMO’s default light setting to ensure that it could not “accidentally” be found by NASH by initializing SUMO and making tiny perturbations to their default light settings. light setting, this is referred to as the Target-Light-Setting. For the synthetic data experiments, the Target-Light-Setting corresponds to the settings for traffic lights that we seek to estimate using the procedures in this section. For simplicity of exposition, here we assume that the actual traffic lights can be modeled with fixed schedules. As discussed later, more complex controllers that incorporate induction loop sensors also fit naturally within this procedure.
NASH was then applied to the uncalibrated, randomly initialized, lights to adjust them such that the cars had approximately the same travel times as in the original distribution. The objective function was to match, for each travel path, the arrival time of the car as closely as possible to what SUMO yielded with the Target-Light-Setting. Recall that because we want to emulate not having any a priori information about the actual light settings, we start NASH with random settings for all the lights in the system. The hope is that through learning, the light settings that are found will behave the same as those in Target-Light-Setting. It is interesting to note that there may be many possible light settings that generate similar aggregate traffic flow behaviors. As will be shown in later experiments, when multiple NASH runs are conducted, different, but equally well matching, light settings are found.
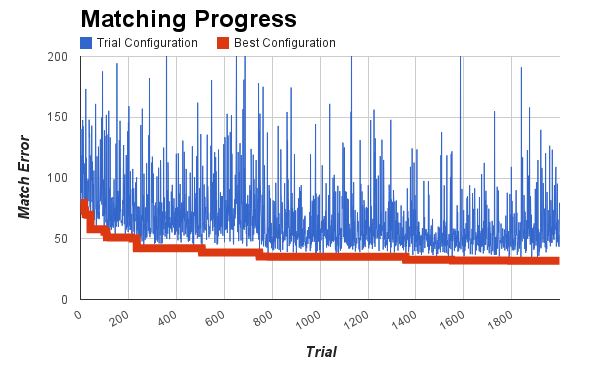
The progress of the matching algorithm is shown in Figure 6. Two lines are shown, the bottom line (in red) shows the best light setting that was found in the search to that point. The top line (in blue) shows the evaluation of each candidate light setting as search progresses. From the red line, observe that in the beginning of learning, the average difference (in seconds) between when a car reaches its destination with the original Target-Light-Setting and the approximated light-setting was over 80 seconds. By the end of learning, this is reduced to 31.8 seconds. Also notice that the blue line is riddled with spikes. This means that the majority of perturbations to the best-light setting found to that point yielded matches that performed significantly worse; small mutations in the light settings caused drastic changes in the overall traffic flow. Only a few trials, those where the red line took a step downwards, revealed an improved performance. These are the steps in which the NASH algorithm accepted a new baseline from which the learning then proceeded.
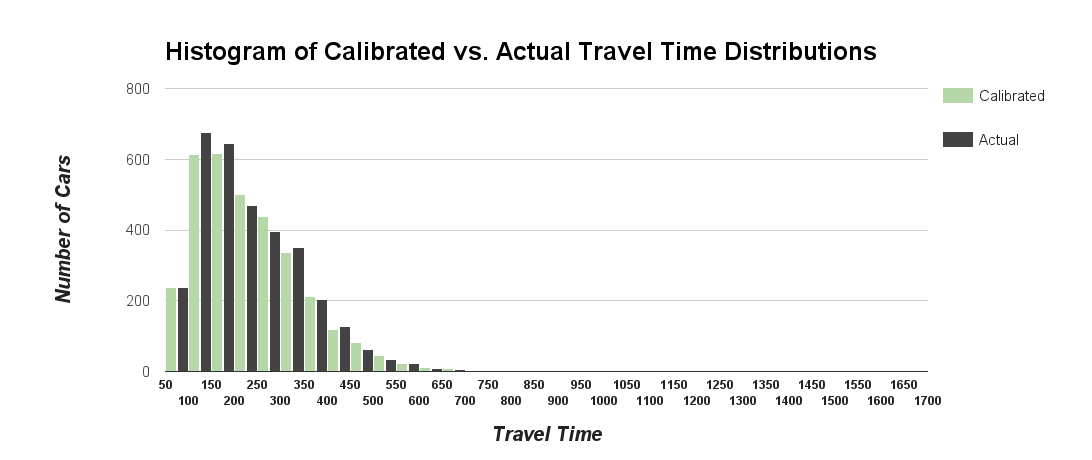
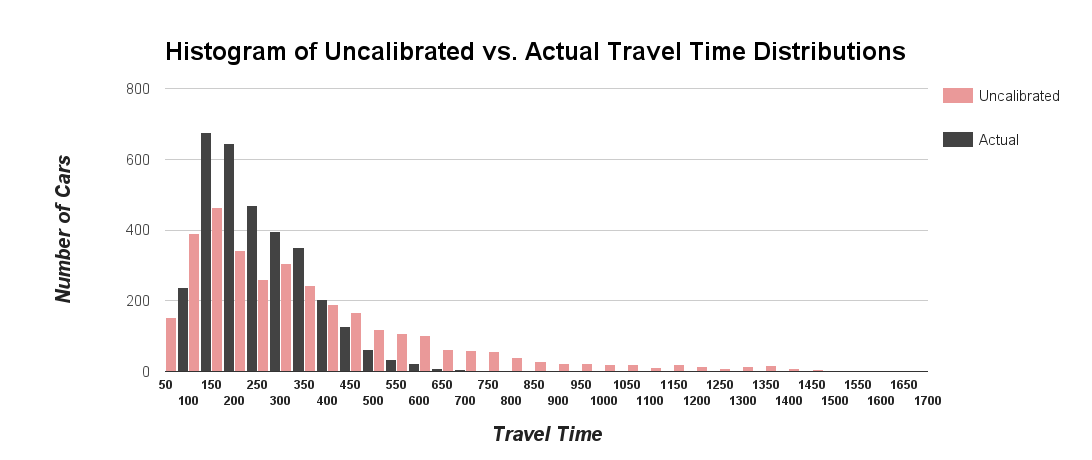
To compare the distributions of travel times to the actual travel times, see Figure 7 (Top). The actual travel time distribution is shown with dark bars, the travel time distribution obtained with the calibrated light settings is shown with lighter (green) bars. As can be seen, the distribution of travel time appear similar. For comparison, if we plot the travel times for random light settings (uncalibrated), the distributions appear quite different Figure 7 (Bottom).
We can also measure the correlation of journey times under the hypothesized light system and the target light system. Here, we correlate each car’s travel times under both scenarios. Results are shown in Figure 8. Instead of just correlating a single trial, Figure 8 also shows the results of 24 additional tests. We reran the entire NASH-matching algorithm from scratch 25 times. Because NASH is stochastic and is initialized with random seeds, we fully expect different schedules to be found in each run; the hope is that at the end of each run, the aggregate behavior approximates the target light system — even if the light settings themselves are not the same. The correlations to the actual travel times of all 25 calibrated systems (found through NASH) remains high for all trials.
For comparison, also shown in Figure 8 are the correlation of 25 uncalibrated (random) light systems to actual travel times. It might seem surprising that for random systems there is any correlation; however, since we are measuring travel times, even with random light settings, as cars travel through the entire system, longer paths are likely to have longer travel times, regardless of the light settings. Nonetheless, as can be seen, by matching the lights through NASH, the correlation of travel times increases dramatically.
Next we posit the question: how robust are these matches? What happens when we severely alter the underlying traffic profile? If we change all the routes and their distributions, how do the travel times of the new cars compare in the NASH-calibrated light systems to the original Target-Light-Setting? If the NASH calibrated light systems were truly close to the Target-Light-Setting, we would expect a high correlation to remain under any traffic load, not just the load on which it was trained.555This additional test is only possible for the data in Section 5, since we are using purely synthesized traffic, and we therefore have the actual traffic light settings that we are trying to discover with NASH. In real usage (e.g. the next two sections) this test would not be possible without having ground-truth light settings. To test this, all of the routes are replaced with randomly created new routes. We measure the correlation of timings of the cars under the target-light-schedule and the NASH-derived-light schedules, and the uncalibrated light schedules (random). The results are shown in Figure 9.
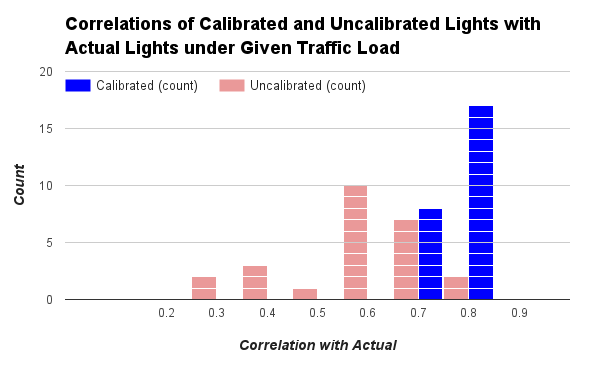
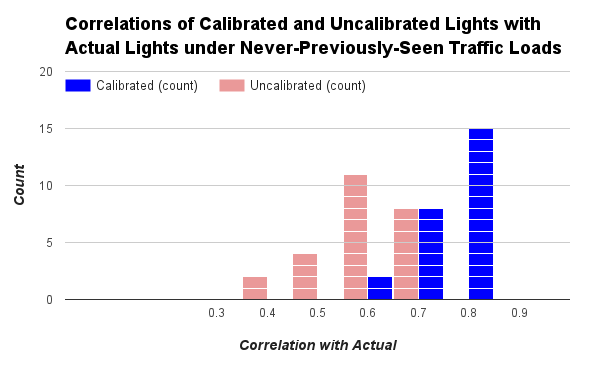
The results are positive: under both seen (Figure 8) and unseen traffic loads (Figure 9), after NASH is used to estimate the settings of the lights, we observe that the correlation of travel times to the original Target-Light-Setting remains high.
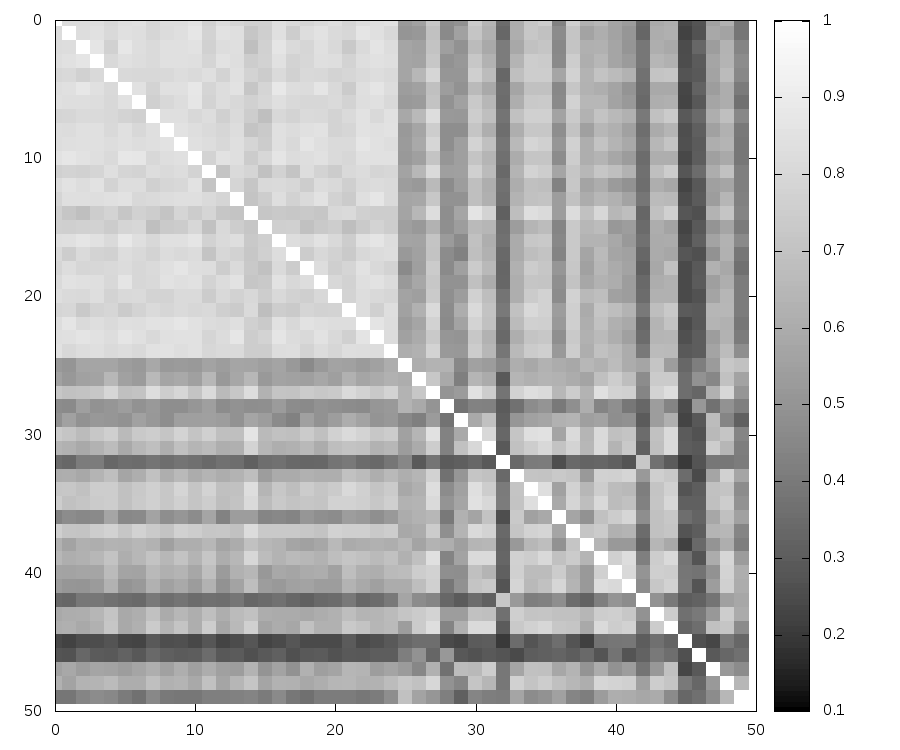
As a final test, we visualize how correlated the light settings are with each other. If they all capture the same conditions well, they should exhibit high correlation to each other. We also compare how correlated the 25 uncalibrated light settings are to both the calibrated lights and uncalibrated lights. The results are shown in Figure 10. The upper-left quadrant (brighter) shows the 25x25 correlations with the calibrated lights. As can be seen, they exhibit high correlations with each other. When they are compared to the non-calibrated lights, the correlations drop precipitously. The bottom-right corner shows the correlations between the uncalibrated lights; far less correlation is present.
In summary, the results are what we hoped: despite not being optimized to be exactly the same light-programs (since the true light program may not be known), the behavior of the calibrated lights are highly correlated with each other and also highly correlated to the actual observed timings. This is precisely what is required to obtain a realistic baseline performance.
Next, we return our attention to optimizing the traffic lights to improve capacity and throughput. To measure our performance, we use the methods described in this section to establish credible baseline performances in both cities examined.
6 Results: Mountain View, California
In this section, we examine the performance of static lights, long-term planning based lights, and auction based lights, on real traffic from Mountain View, California.
6.1 Calibrating to Real Lights
The results from Section 5 revealed that matching the behavior of lights was possible, at least with simulated data. In this section, we apply the same approach to the seven traffic lights in Mountain View, California. This is a significantly larger and more complex simulation than the synthetic data use earlier. In the previous section, the synthetic simulations used 3200 travel-tracks. For these experiments, we use approximately 67,000 tracks. Additionally, unlike in the synthetic experiments, the distribution of paths is far from uniform. Backups happen non-uniformly — only on certain streets and in certain directions. Small perturbations in a single critical traffic light’s schedule can lead to drastic changes in throughput while large perturbations to the schedule of a less busy traffic light may generate little observable impact.
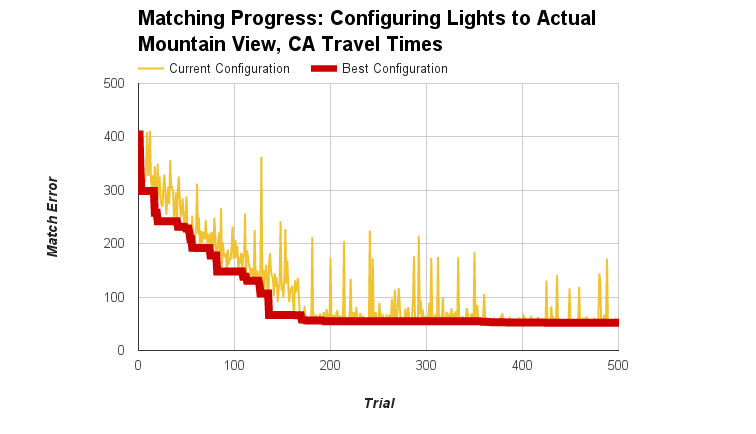
We begin the calibration procedure similarly to the synthetic case — we use NASH to match the timings. The progress is shown in Figure 11. Note that the mean error in times drops quickly. In the beginning of the learning process, the error was over over 400 seconds (in this case, the default SUMO traffic light settings were used for initialization). By completion, NASH lowered the error between actual and matched times to approximately 51 seconds.
Next, similar to the analysis conducted with synthetic data, we examine the distribution of travel times for the 67,000 tracks. Figure 12 shows the distributions of the tracks for the real data and the times obtained through a simulation in SUMO using the NASH-calibrated lights.
As can be seen the distributions are similar, but as expected, not as close a match as with the simulated data. The correlation between the predicted and real times is 0.5. For reference, when a random light setting is used (the default SUMO settings), the correlation with the real data is only 0.18. Recall that with the synthetic data, the correlation of NASH-Calibrated lights to the actual timings was 0.8 and the random light settings to the actual timings was 0.5.
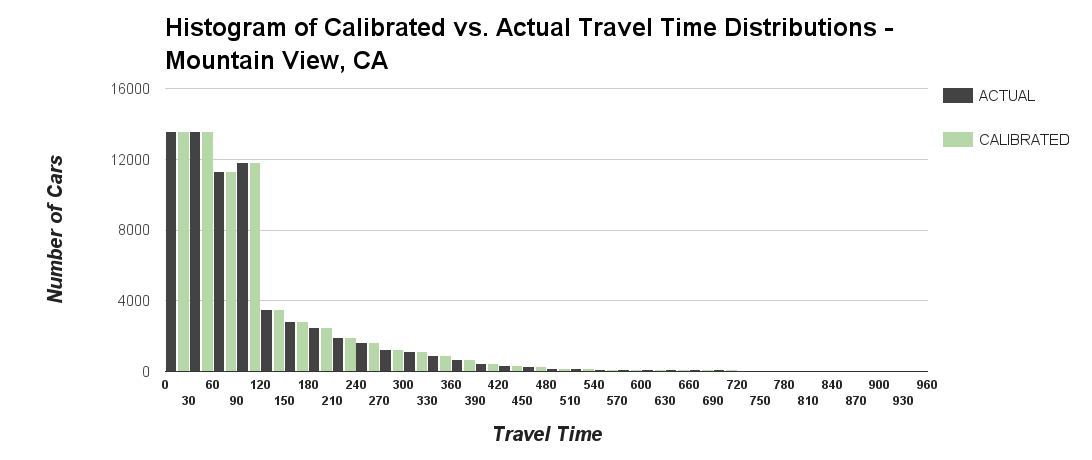
There are several distinguishing attributes of this data that explain why it was possible to correlate the synthetic data better than the real data. First, in the synthetic data, drivers did not have unnecessary delays in start/stop times due to exogenous factors such as distraction, change of plans, etc. Second, in the synthetic data, drivers behaved uniformly at yellow and red lights; this was not the case for real drivers. Even if the exact correct light settings were found, these factors would lead to lower correlations since they would not be modeled. Third, the real data is significantly more noisy; a problem we did not have with synthetic data. Recall how the data was acquired and aggregated over the period of many months (done to account for the fact that not all drivers are opted-in Android phone users). This aggregation process leads to noise in the real data which we are trying to mimic. Fortunately, as usage of cell-phone GPS/maps increases and more travel-track data becomes available, these estimates will improve. Despite the above difficulties, we were able to significantly reduce the average discrepancy between actual and predicted times from approximately 7 minutes to 51 seconds.
As a final test to ensure that NASH actually learned something about the lights and did not overfit the exact traffic on which it was trained, we repeated the experiment with a more difficult setup. For NASH, we only looked at the data from the first 1.5 months of collection. Then, for testing the timings we tested on a non-overlapping, subsequent, 1.5 months of data. This also represents another common use and test scenario where a period of time is devoted to training and then the learned model is used in the future. What we found indicated that NASH captured the behavior of the lights and did not overfit the data. The results did not change from using the entire 3 months of data. Both the mean error and overall correlation remained the same as when the entire 3 month period was used for modeling the lights.
6.2 Testing the New Traffic Light Controllers
Thus far, we have used NASH to match the timings of the lights in simulation to those actually deployed on the roadways. Now, we use NASH in a manner that is more familiar — to optimize the internal parameters of the light controllers to reduce the mean travel times. NASH is used to optimize the parameters of the three types of controllers. For fixed-schedule controllers, the phase lengths and offsets are optimized, for long-term planning controllers the penalty weights are optimized, and for micro-auction based controllers the detector weights and their durations (minimum, priority and release) are optimized. The objective function (step 3 in the NASH algorithm) is set to minimizing the mean travel time of the cars. Each learning run is given a total of 2000 simulations – that is, 2000 perturbations of the traffic controller’s parameters were tested in simulation.
The traffic-data used for the learning process were based on the data collected over months in Mountain View, California. Rather than using this exact data for the learning, multiple new, reality-based, data sets were created based on this data. Each new data set was created by perturbing the original data in the number of cars released on each route and the car-release schedules. Small changes in the order of car release or in the number of cars can have very large effects on the overall traffic and timings of the cars in the simulation. Therefore, instead of optimizing the signal timings on a single data set, simulations were run for all the data sets (10 dataset perturbations were created and used). The lights were optimized to work well on all the data sets by incorporating them into the objective function. During the learning process, to determine whether a candidate light setting was better than its predecessor (Steps 4 & 5 in the NASH algorithm), not only did the average travel times across data sets have to be lower than its predecessor, but of the data sets that were used, at least had to have a lower mean travel times. This ensured that if a candidate light setting worked exceedingly well on a single data set at the expense of working well on the rest, it was discarded, despite potentially having a lower overall average across all data sets.
The benefits of using the multiple reality-based data sets were two-fold. First, multiple data sets helps account for naturally occurring variability in traffic patterns on different days. Since small changes cause large distortions in traffic flow, this is vital. Second, by not using the actual data for training the signals, this left the pristine, real, data for the final round of tests. The clean data was used only as a final test to measure effects of improved controllers on capacity and mean time of travel.
The results, comparing mean travel times, and expected capacity, are shown in Tables 2 and 3, respectively. We compare different approaches to traffic light control during different commuter-traffic profiles. We perform the comparison by considering as our baseline the travel times under the NASH-calibrated light controls.
| Peak rush (8:00–9:30 am) | Average rush (9:00–10:30 am) | Low rush (9:30–11:00 am) | ||||
|---|---|---|---|---|---|---|
| 21861 observed cars | 20139 observed cars | 18154 observed cars | ||||
| 668.68 sec observed MTT | 173.65 sec observed MTT | 110.37 sec observed MTT | ||||
| Optimized static lights | 44% faster | (376.56 sec MTT) | 30% faster | (121.37 sec MTT) | 6% faster | (103.58 sec MTT) |
| Planning-based lights | 21% faster | (525.82 sec MTT) | 8% slower | (187.18 sec MTT) | 6% slower | (116.54 sec MTT) |
| Learned Auction lights | 79% faster | (140.87 sec MTT) | 38% faster | (108.01 sec MTT) | 10% faster | (99.57 sec MTT) |
| Peak rush (8:00–9:30 am) | Average rush (9:00–10:30 am) | Low rush (9:30–11:00 am) | ||||
|---|---|---|---|---|---|---|
| 21861 observed cars | 20139 observed cars | 18154 observed cars | ||||
| 668.68 sec observed MTT | 173.65 sec observed MTT | 110.37 sec observed MTT | ||||
| Optimized static lights | +16% | (25306 cars) | +9% | (22037 cars) | +8% | (19661 cars) |
| Planning-based lights | +3% | (22473 cars) | -4% | (19253 cars) | -2% | (17736 cars) |
| Learned Auction lights | +47% | (32082 cars) | +46% | (29499 cars) | +11% | (20204 cars) |
When comparing an alternative approach (e.g., optimized static-phase controls) to the baseline, we run the simulation using the alternative control approach, always using the same distribution of routes as was used for the baseline. For Table 2, we keep the same number of cars as well and simply compare the mean travel-time (MTT) changes. For Table 3, we scale the number of cars up or down (with the same distribution of routes), until we match its average travel time to the baseline travel time.
The first lines of Tables 2 and 3 report the results of our comparison of optimized static control to the NASH-calibrated control. The optimized static control uses the phase durations and relative offsets that were found to be best for an average-morning commute period (weekday 7am–11am), using NASH. There is improved throughput throughout the commute cycle, with the largest improvements seen when it is most needed, during the 8:00-9:30am peak period. For example, we could increase the peak period load by as much as 16% without increasing the travel times, using this learned static controller instead of the NASH-calibrated controller. This improvement demonstrates the power of the learning procedure. It is interesting to see this level of improvement using static light timing, even after the light synchronization work was done on Shoreline Blvd. in 2012–13 [41]. It may be that the increase in traffic in those two years is enough to change the best choices for the traffic light durations.
A potential concern with the witnessed improvements is whether the improvements come at the expense of infrequently traveled routes experiencing severe delays that they previously did not? These trade-offs were examined in detail. The vast majority of cars reduced their travel times. Of the ones that did not, most increased their travel times by under 4 seconds. Only a few cars experienced longer delays under the optimized controllers; however, even with the extra delays, their resulting times were in the lowest 10% of the times experienced without learning.
For planning-based lights (Table 3), we did not see a consistent change in capacity across the commute periods: the implied changes in capacity, compared to the NASH-calibrated control, were all small and likely not to be significant. This is most probably due to the situation that was studied. The majority of the traffic that was involved in the simulation were cars exiting from a freeway onto a congested arterial road. Most of the traffic was not in “clusters”, as observed in the Pittsburgh study [12]. Another potential contributing factor is that there were only three parameters (the penalty weights) that were optimized. We made this choice because of the obvious physical correlates for all of the other parameters (e.g. observed speed profiles for sensor-to-light delays and turning ratios for sensor-to-phase weights).
Finally, our auction-based traffic lights provided the largest gains in capacity over the matched-to-current controls. The biggest gains were during the peak rush period, when it is most needed: we were able to allow 47% more traffic into the road network (using the same distribution of routes) during these times, without increasing travel times, when we used auction-based traffic controls compared to the matched-to-current lights, a significant accomplishment. In contrast, if we increased the traffic load during peak hours by 47%, the currently deployed lights (as modeled by the procedures described in Section 5), we expect to see the travel times increase by over 200% (to 2203.6 sec). Similarly, impressive reduction in travel times were achieved across the board, especially during peak rush hour.
6.3 Detailed Discussion
Because of the stochastic nature of NASH, as well as the complex interactions possible between a system of traffic lights and real traffic, it is difficult to a priori predict what behaviors will emerge after learning. From the previous tables, it was clear that throughput and mean travel time improvements were found. In this section, we attempt to give some intuition into (the sometimes non-obvious) ways in which they were achieved.
Somewhat surprisingly, the planning-based approach was the least successful of the systems that we tested. Due to the strong physical interpretation of each of the parameters (physical distances, etc), it was the one that least lent itself to optimization. A future research direction is to test this approach using fully optimized parameters that may not correspond to physical interpretations, but may reveal improved performance within the context of the full system.
Examining the auction-based lights in more detail, the decisions learned are both interesting and revealing. In four of the seven lights, the learning procedure removed all sensors from all the phases, resulting in the lights acting as static lights: lights 1, 2, 5, and 7 (see Figure 4 for numbering). The phase durations seen on all of these lights except light 5 were nearly identical to the durations found when we optimized static-control lights: the other three were within 2 sec (out of 86 sec total cycle length) of the optimized static-control light durations. At least this small amount of variation (if not more) is expected from a stochastic search process, such as NASH.
The learning procedure also found several different ways to, in effect, remove dedicated-left phases, especially at the most congested intersections (for example, lights 3 and 6 in Figure 4).666The largest amount of congestion is at light 4. However, due to the complexity of that intersection, there was no dedicated-left phase to remove. This behavior seems especially interesting, given the reduced capacity that is generally seen at intersections with many dedicated lefts [42].
One approach that the system automatically discovered to remove dedicated lefts from the less-used roads was to match the bids of the dedicated left to the direct-through phase that was just before it, in the round-robin ordering. Specifically, on light 6 (Figure 4), phases 1 and 2 share a matched set of sensor weights and phases 3 and 4 share another matched set of sensor weights. This means that the direct-through/dedicated-left pair will always tie on any auctions. Since the direct-through phases are always before the dedicated left phases in the round-robin cycle when starting from an opposing direction (e.g., phase 1 will be before phase 2, when starting from either phase 3 or phase 4), this has the interesting property that cycling between directions (cycling from north-south to east-west or vice-versa) will always go to the through phase.
In visual examination of this intersection during simulation, it often happened that phases 1 and 2 started giving high bids for the light, while phase 3 (east-west direct-through) was active but still greedy. As soon as phase 3 is slightly longer than its priority duration, the light changes to using phase 1 (north-south direct-through), without going through the phase 4 (the dedicated left). Similar switching is only occasionally seen for the opposite pairs. Since Shoreline has much heavier traffic than Terra Bella (the east-west road), this happened much less often. Both sets of dedicated lefts happen less often but are still possible.
The learned controllers also used the time differences between release durations to favor traffic on the phases that were more prone to long lines. For example, at light 4 (Figure 4), the priority duration given to the 101-Freeway exit ramp was longer than the priority duration given to La Avenida (the small road that enters the intersection from the east). With this weighting, we see the traffic delays suffered by the La Avenida traffic approximately equal (on a per-car basis) to the delays seen by the 101-exit-ramp traffic.
Finally, the learned lights used the number of incoming lanes allowed to pass through a phase as another way to bias the auction towards the dominant direction of traffic. For example, at light 3, the combined weight given to the sensors of Shoreline traffic is five times that given to the Pear-Ave traffic (the east-west road at that intersection). This was done by giving all of the sensors the maximum-allowed positive or negative weights and simply relying on the number of sensors (and hence the number of lanes) to provide priority to larger streets.
7 Results: Chicago, Illinois
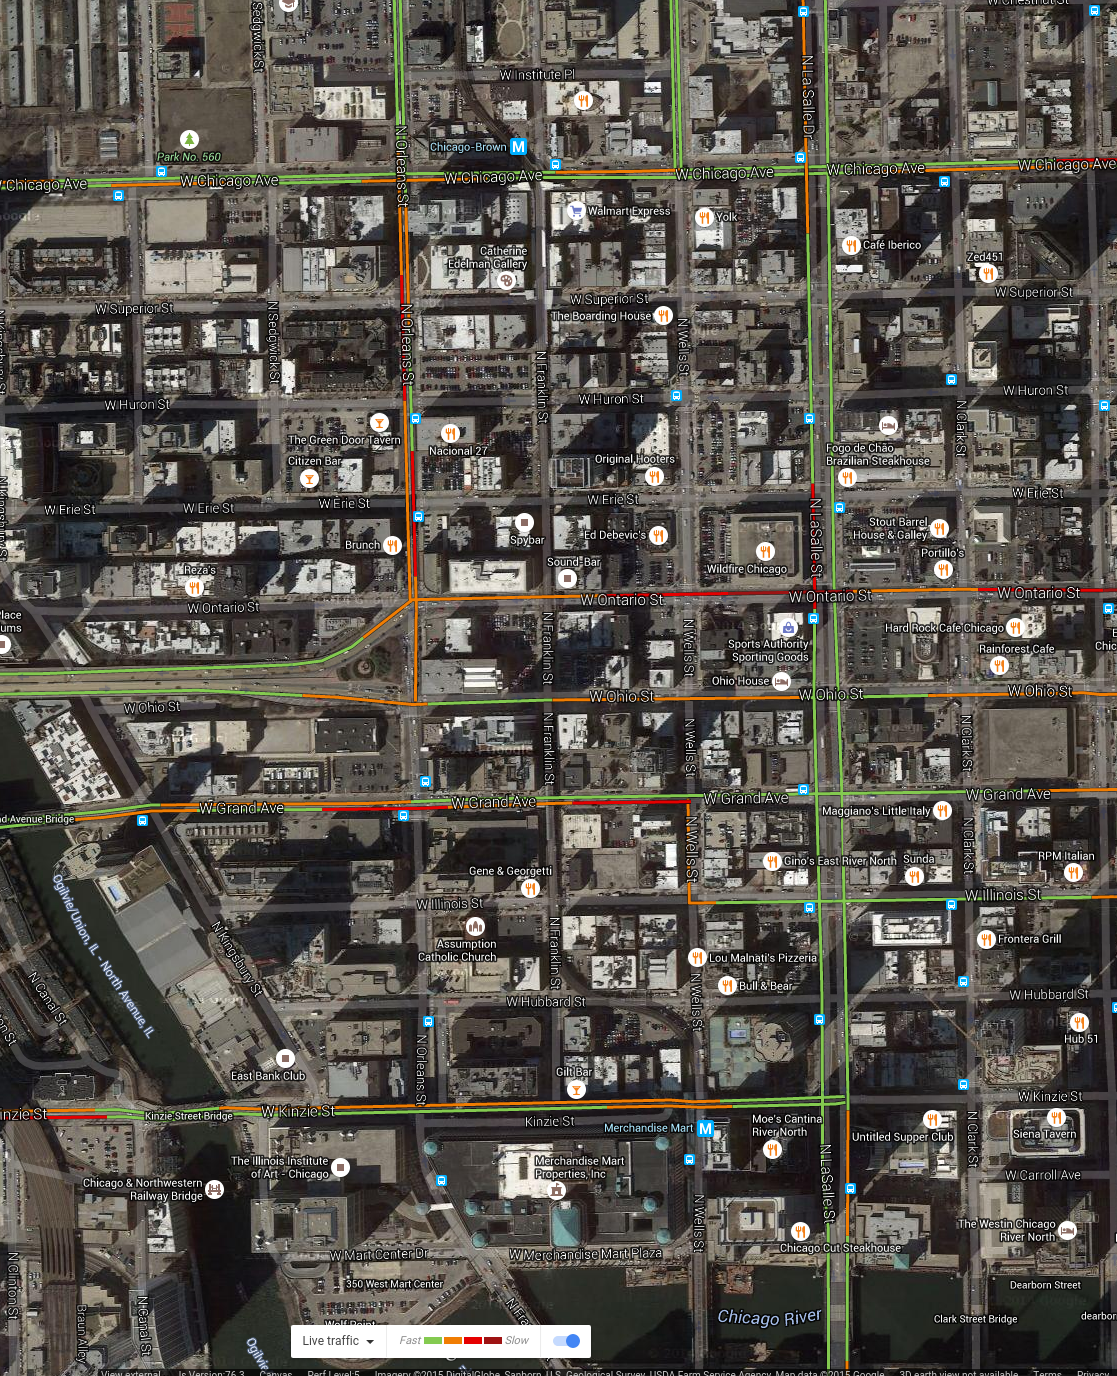
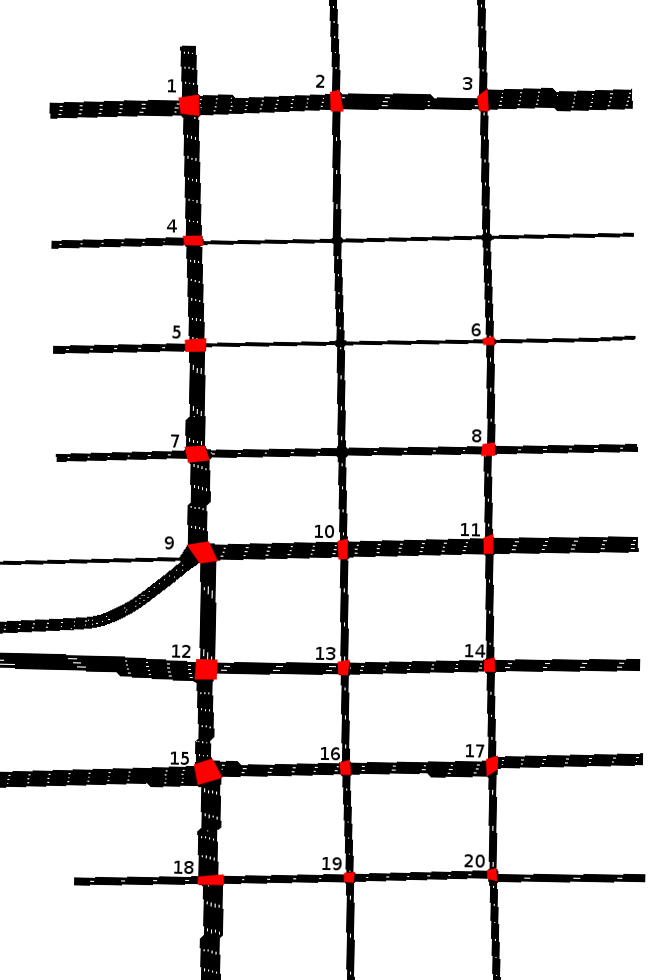
In Chicago, we considered twenty lights in the River North area shown in Figure 1 (Bottom). The area, as imported into SUMO, is shown in Figure 13.
The steps in the optimization of the twenty traffic lights in Chicago proceeded in the same manner as the optimization of the lights in the Mountain View area. To avoid redundancy, we will provide only a summary of the procedure and results and refer the reader to Section 6 for details.
7.1 Calibrating to Real Lights
In order to be able to establish a realistic baseline, as we did with Mountain View, we once again used NASH to calibrate the lights in our simulations (see Section 4). Similarly to the previous experiment, anonymized, fully privacy preserving, travel-tracks of Android users were collected over several months. For our tests, approximately 18,000 cars were used in the simulation. By using NASH to adjust the lights schedules, we were able to reduce the average discrepancy between the actual and the predicted travel times to approximately 43 seconds. For comparison, in the analogous procedure using the Mountain View, California data, the error was reduced to 51 seconds (see Figure 11).
7.2 Testing the New Traffic Light Controllers
Once the settings for the deployed lights are estimated, the next step is to attempt to change the light settings to improve the traffic flow. In the first experiment, NASH is employed to modify the phase durations and offsets of the 20 lights (e.g. optimize static lights). In the second experiment, NASH is used to optimize the parameters of the micro-auction based controllers. Unlike the previous experiments with Mountain View, CA. we do not revisit the planning based approach for this scenario.
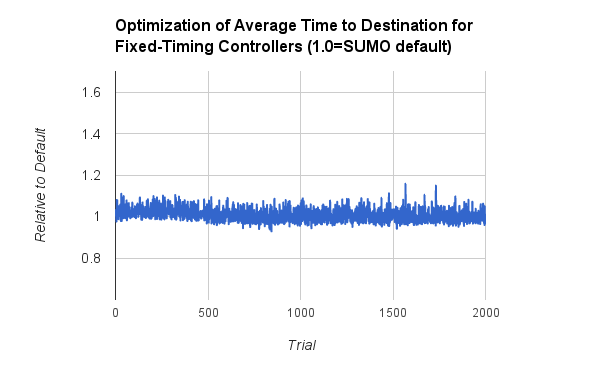
Learning, as it progresses, is shown in Figure 14. From the two graphs, we see several important trends. First, optimizing the fixed-light controllers (Top) does not dramatically improve the performance of the fixed-light controllers in terms of the average time to destination. Compared to the default settings, the best setting found revealed an improvement of approximately 7%.
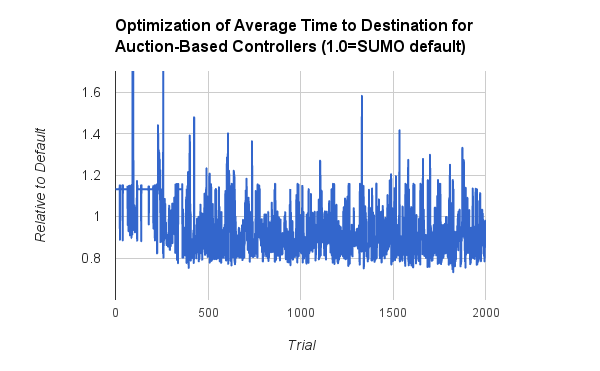
In contrast, there are much larger variations in the optimization of the auction based controllers. In Figure 14 (Bottom), we see that in the 2000 trials, many times the settings are significantly worse than the original. As explained earlier, these settings are tried and then discarded. Most importantly, however, in the cases in which better controller settings are found, a substantial improvement over the fixed-light controllers is obtained. With the auction-based light controllers, the learning process discovered settings that reduced the mean travel time by 25%.
| Peak rush (8:00–9:30 am) | Average rush (9:00–10:30 am) | Low rush (9:30–11:00 am) | ||||
| 7516 observed cars | 6834 observed cars | 6390 observed cars | ||||
| 87.18 sec observed MTT | 86.42 sec observed MTT | 85.71 sec observed MTT | ||||
| Optimized static lights | 2% faster | (85.63 sec MTT) | 3% faster | (84.02 sec MTT) | 3% faster | (83.17 sec MTT) |
| Learned Auction lights | 24% faster | (66.40 sec MTT) | 23% faster | (66.57 sec MTT) | 25% faster | (64.41 sec MTT) |
| Peak rush (8:00–9:30 am) | Average rush (9:00–10:30 am) | Low rush (9:30–11:00 am) | ||||
| 7516 observed cars | 6834 observed cars | 6390 observed cars | ||||
| 87.18 sec observed MTT | 86.42 sec observed MTT | 85.71 sec observed MTT | ||||
| Optimized static lights | +9% | (8195 cars) | +26% | (8601 cars) | +31% | (8362 cars) |
| Learned Auction lights | +26% | (9505 cars) | +95% | (13360 cars) | +150% | (15965 cars) |
As with the study conducted with the Mountain View, California, the settings for the light controllers are found by training with multiple reality-based data sets. This helps to account for variability in traffic flows as well as leaves the actual data untouched for testing. For the final results, reported below, we use the actual data.
Tables 4 and 5 compare the mean-travel times and the capacity changes to NASH-calibrated lights. As witnessed in Mountain View, both the optimized static and the auction-based traffic lights provide improvements in the mean-travel times and in the capacity of the streets: up to 25% faster mean-travel time for the auction-based traffic lights and, during the main commute hours, up to 150% more capacity during low rush hours.
The traffic problems addressed in this region of Chicago are different than those in Mountain View, California. In Mountain View, most of the traffic delay was associated with long, persistent, queues at intersection 4 in Figure 4 (Shoreline and the northbound exit from 101 and 85) and with the addition of traffic onto Shoreline from that exit. In the Chicago study, there is a busy freeway exit at intersection 12 in Figure 13, but the traffic clears from the ramp on most light cycles. Instead, the delays in traversing this section are largely due to repeated stops at the traffic lights along W. Ohio (intersections 12, 13, and 14 in Figure 13) and along W. Ontario (intersections 9, 10, and 11).
The optimized static lights are able to increase capacity and decrease travel times by changing the phase duration allocation to better match the dominant directions of congestion at the different intersections, most significantly increasing phase durations for east-west traffic as it crosses N. Wells and N. Franklin and increasing the phase duration for north-south traffic at N. Orleans and W. Ontario (intersection 9) by 14%. The phase offset between the lights was unchanged from the matched lights to the optimized static traffic lights. This helps explain why the travel times had a smaller improvement than the capacity measurements: many cars still slowed or stopped for the same sets of lights, but the length of the queues were smaller (even with increased traffic load), due to the optimized match to the historically-observed congestion.
The explanation for the improved capacity for the actuated lights is similar but more indirect. We cannot simply examine the phase durations, since the duration is demand driven and changes throughout the simulation. Furthermore, the average change in phase duration from matched to actuated lights (that is, the difference in the percent time that a given phase was green over the full simulation run) was not consistent across the different time windows. The most noticeable and consistent change between the static and auction-based light simulations was that the size of the queues for the major intersections were shorter in all directions using the actuated traffic lights. The first car to the intersection would typically still need to slow or stop but, the following cars in the same wave would typically make it through the same cycle. Examining the way that the sensors were used by the actuated lights, there seems to be a bias towards using all of the sensor readings to establish the bid of the phase for the dominant direction of travel (intersections 1, 2, 3, 9, 11, 12, 14, 15), with the weighting on the sensors leading the bid to pay more attention to traffic in the dominant direction but to yield the light if that traffic is less than seen on the non-dominant direction sensors.
Interestingly, as with many of the optimized Mountain View lights, most of the protected-left phases were effectively removed from the light sequence. In most cases, this was done by having the through-traffic phases with sensor weights that are “matched opposites” (that is, all the sensor weights for phase 3 are the negative of the weights for phase 1, in Figure 2). Here, the protected-left can be effectively removed by omitting sensors from that phase (lights 1, 3, 4, 7, 9, 16, 19) or by matching the sensor weights for the protected left to the previous through-traffic phase (lights 2, 3, 7, 9, 15, 16, 19).777Lights 3, 7, 9, 16, and 19 appear on both of these lists since their two protected-left phases used both of the strategies.
8 Conclusions and Future Work
There are two primary contributions of this work. First, we have introduced the micro-auction based traffic light controllers and a simple learning/optimization procedure to make them effective. The controllers do not necessitate communication between lights or between cars and lights; only local induction loops sensors are used. Rather than coming up with ad hoc rules for traffic priorities and scheduling, each sensor’s information is placed within the framework of a micro-auction system. When a phase change is permitted, the light controller collects bids from all the phases and conducts a real-time micro-auction.
We tested the controllers on real traffic loads observed over months of traffic collection. In Mountain View, California, the load was dominated by the confluence of a freeway exit ramp with a congested arterial road. Next, we studied real traffic in Chicago, Illinois, to determine the controller’s performance in within-city grids. For both cities, we employed the exact same method to estimate the performance of the deployed traffic lights with no changes to the algorithms. We successfully demonstrated that with auction-based controllers, the improvements in capacity and mean travel times in both cities were extremely promising. Perhaps equally as interesting as the quantitative results are the common ways in which the learning procedures worked with the auction-based controllers in finding similar strategies for improving traffic in both cities: eliminating protected lefts, weighting bids higher from dominant roads, and even negatively weighting bids from less traveled roads. These strategies were automatically determined; none were pre-programmed.
The second contribution of this work is a method through which the program schedules of currently installed traffic light can be approximated. This addresses an important practical issue in measuring the benefits of new traffic light controllers. For the traffic researcher, two classes of crucial data have become increasingly available. First, detailed maps of the streets and the precise locations of the traffic lights is publicly available through a number of sources. Second, through the increased usage of personal cell-phone based GPS systems, an enormous amount of travel-tracks have been amassed. What is often lacking, however, is detailed knowledge of the existing traffic light schedules and traffic light response behaviors. This paper has presented a simulation-based approach to approximate the behavior of installed lights. This provides a method to create a solid baseline from which to quantitatively measure improvements.
There are several areas of future research that are natural next steps. First, with respect to our procedures used to determine the schedules of the currently deployed lights, in this study, we only considered matching the timings of static-lights. Nonetheless, it should readily possible to adapt the same methods presented here to learning the parameters for lights that incorporate induction loop sensors. We suspect that this will provide improvements even in the scenarios considered here.
Second, in this study, the planning-based lights did not perform as well as the auction-based system. In the future, if planning-based lights are reexamined, further parameterization of the sensor placement and readings should be considered, despite the potential for a priori setting weights based on physical constraints. This may require new, more complex learning algorithms that explicitly model the interactions between parameters; many have been explored in genetic algorithm literature [30, 32, 31], among other places.
Third, a large amount of research has been conducted towards lights that communicate between each other and with cars. If this form of communication is available, it can be easily incorporated into auction based models. In the simplest manner, the induction loop sensors can be replaced with counters revealing the presence of cars through communication channels. However, more interesting interactions are also possible. If there is higher priority traffic (for example emergency vehicles or lanes that need right-of-way for event traffic management), in an auction based system their weights can be appropriately accounted for in a phase’s bidding process to reflect the urgency of travel.
The focus of this paper was not in exposing the auction mechanics externally, but rather using the auction as a guiding principle for internal light controls. In the future, if lights do communicate with cars, it is conceptually easy to incorporate tolls and payment priorities into our auction process. If each car has the ability to virtually “bid” on how much it is willing to pay to make it through the lights, the auction-based mechanisms support this by altering the weights of the bids that are received into the micro-auction. Of course, setting the weights and the algorithms to be fair will require careful consideration; nonetheless, the mechanisms to support monetary bidding are provided through these learned auctions-based controllers.
Acknowledgments
The authors would like to gratefully acknowledge Kevin Wang for his helpful comments on this paper and many aspects of this project over the last year.
References
References
- [1] J. J. Sanchez, M. Galan, E. Rubio, Genetic algorithms and cellular automata: a new architecture for traffic light cycles optimization, in: Congress on Evolutionary Computation, Vol. 2, IEEE, 2004, pp. 1668–1674.
- [2] B. Park, C. J. Messer, T. Urbanik II, Enhanced genetic algorithm for signal-timing optimization of oversaturated intersections, Transportation Research Record: Journal of the Transportation Research Board 1727 (1) (2000) 32–41.
- [3] A. M. Turky, M. S. Ahmad, M. Z. M. Yusoff, The use of genetic algorithm for traffic light and pedestrian crossing control, Int. J. Comput. Sci. Netw. Security 9 (2) (2009) 88–96.
- [4] T. Kalganova, G. Russell, A. Cumming, Multiple traffic signal control using a genetic algorithm, in: Artificial Neural Nets and Genetic Algorithms, Springer, 1999, pp. 220–228.
- [5] M. Wiering, Multi-agent reinforcement learning for traffic light control, in: ICML, 2000, pp. 1151–1158.
- [6] I. Arel, C. Liu, T. Urbanik, A. Kohls, Reinforcement learning-based multi-agent system for network traffic signal control, Intelligent Transport Systems, IET 4 (2) (2010) 128–135.
- [7] D. E. Moriarty, P. Langley, Learning cooperative lane selection strategies for highways, in: AAAI/IAAI,1998, 1998, pp. 684–691.
- [8] B. Abdulhai, R. Pringle, G. J. Karakoulas, Reinforcement learning for true adaptive traffic signal control, Journal of Transportation Engineering 129 (3) (2003) 278–285.
- [9] V. Gradinescu, C. Gorgorin, R. Diaconescu, V. Cristea, L. Iftode, Adaptive traffic lights using car-to-car communication, in: Vehicular Technology Conference, 2007. VTC2007-Spring. IEEE 65th, IEEE, 2007, pp. 21–25.
- [10] T. Tielert, M. Killat, H. Hartenstein, R. Luz, S. Hausberger, T. Benz, The impact of traffic-light-to-vehicle communication on fuel consumption and emissions, in: Internet of Things (IOT), 2010, IEEE, 2010, pp. 1–8.
- [11] B. Asadi, A. Vahidi, Predictive cruise control: Utilizing upcoming traffic signal information for improving fuel economy and reducing trip time, Control Systems Technology, IEEE Transactions on 19 (3) (2011) 707–714.
- [12] S. F. Smith, G. J. Barlow, X.-F. Xie, Z. B. Rubinstein, Surtrac: Scalable urban traffic control, in: Transportation Research Board Annual Meeting, 2013.
- [13] X.-F. Xie, S. F. Smith, G. J. Barlow, Schedule-driven coordination for real-time traffic network control, in: International Conference on Automated Planning and Scheduling, 2012.
- [14] X.-F. Xie, S. F. Smith, L. Lu, G. J. Barlow, Schedule-driven intersection control, Transportation Research Part C 24.
- [15] K. Dresner, P. Stone, Traffic intersections of the future, in: AAAI-2006, 2006, pp. 1593–1596.
- [16] G. Heisig, Nervousness in material requirements planning systems, in: Planning Stability in Material Requirements Planning Systems, Springer, 2002, pp. 21–64.
- [17] D. Christensen, D. Newcomb, Evaluation of induction loop installation procedures in flexible pavements, in: WA-RD 76.1, Washington State Dept. of Tranportation, 1985.
- [18] M. Covell, S. Baluja, R. Sukthankar, Micro-auction based traffic light control: Responsive, local decision making, in: IEEE Intelligent Transportation Systems Conference-2015, 2015.
- [19] S. Baluja, M. Covell, R. Sukthankar, Approximating the effects of installed traffic lights:a behaviorist approach based on travel tracks, in: IEEE Intelligent Transportation Systems Conference-2015, 2015.
- [20] D. Carlino, S. D. Boyles, P. Stone, Auction-based autonomous intersection management, in: 16th Intelligent Transportation Systems-(ITSC), 2013, IEEE, 2013, pp. 529–534.
- [21] H. Schepperle, K. Böhm, Agent-based traffic control using auctions, in: International Workshop on Cooperative Information Agents, Springer, 2007, pp. 119–133.
- [22] H. Schepperle, K. Böhm, S. Forster, Traffic management based on negotiations between vehicles–a feasibility demonstration using agents, in: Agent-Mediated Electronic Commerce and Trading Agent Design and Analysis, Springer, 2008, pp. 90–104.
- [23] D. Krajzewicz, J. Erdmann, M. Behrisch, L. Bieker, Recent development and applications of sumo - simulation of urban mobility, International Journal On Advances in Systems and Measurements 5.
- [24] U.S. Department of Transportation Federal Highway Administration, Traffic signal timing manual: Chapter 5 basic signal timing procedure and controller parameters, http://ops.fhwa.dot.gov/publications/fhwahop08024/chapter5.htm (2013).
- [25] DLR Institute of Transportation, Sumo - simulation of urban mobility, http://www.dlr.de/ts/en/desktopdefault.aspx/tabid-9883/16931_read-41000 (2015).
- [26] O. K. Tonguz, W. Viriyasitavat, F. Bai, Modeling urban traffic: A cellular automata approach, IEEE Communications Magazine.
- [27] P. V. Thankuriah, D. G. Geers, Transportation and Information: Trends in Technology and Policy, Springer Science & Business Media, 2013.
- [28] D. E. Goldberg, Genetic Algorithms in Search, Optimization and Machine Learning, Addison-Wesley Longman Publishing Co., Inc., 1989.
- [29] S. Baluja, Genetic algorithms and explicit search statistics, Advances in Neural Information Processing Systems (1997) 319–325.
- [30] S. Baluja, S. Davies, Fast probabilistic modeling for combinatorial optimization, in: AAAI/IAAI, 1998, pp. 469–476.
- [31] G. Harik, Linkage learning via probabilistic modeling in the ecga, Urbana 51 (61) (1999) 801.
- [32] M. Pelikan, D. E. Goldberg, F. G. Lobo, A survey of optimization by building and using probabilistic models, Computational optimization and applications 21 (1) (2002) 5–20.
- [33] C. Chow, C. Liu, Approximating discrete probability distributions with dependence trees, IEEE transactions on Information Theory 14 (3) (1968) 462–467.
- [34] A. Juels, M. Wattenberg, Stochastic hillclimbing as a baseline method for evaluating genetic algorithms, in: Advances in Neural Information Processing Systems (NIPS), 1995.
- [35] M. Mitchell, J. H. Holland, S. Forrest, When will a genetic algorithm outperform hill climbing, in: J. D. Cowan, G. Tesauro, J. Alspector (Eds.), Advances in Neural Information Processing Systems 6, Morgan-Kaufmann, 1994, pp. 51–58.
- [36] M. Harman, P. McMinn, A theoretical & empirical analysis of evolutionary testing and hill climbing for structural test data generation, in: Proceedings of the 2007 international symposium on Software testing and analysis, ACM, 2007, pp. 73–83.
- [37] A. Rosete-Suárez, A. Ochoa-Rodrıguez, M. Sebag, Automatic graph drawing and stochastic hill climbing, in: Proceedings of the Genetic and Evolutionary Computation Conference, Vol. 2, 1999, pp. 1699–1706.
- [38] M. Haklay, P. Weber, Openstreetmap: User-generated street maps, IEEE Pervasive Computing 7.
- [39] D. Barth, The bright side of sitting in traffic: Crowdsourcing road congestion data, http://googleblog.blogspot.com/2009/08/bright-side-of-sitting-in-traffic.html (2009).
- [40] A. Dobie, Understanding Google’s Android location tracking, http://www.androidcentral.com/understanding-googles-android-location-tracking (2014).
- [41] City of Mountain View and Caltrans’ Metropolitan Transportation Commission, Program for arterial system synchronization (pass) fy12/13 shoreline blvd traffic signal timing project, http://files.mtc.ca.gov/pdf/pass/2012-13_Factsheets/City_of_Mountain_View_Caltrans.pdf (2013).
- [42] T. Vanderbilt, Traffic: Why We Drive the Way We Do (and what it Says about Us), Vintage Books, 2009.