PHENIX Collaboration
-meson production at forward and backward rapidity in + and Cu+Au collisions at =200 GeV
Abstract
The fraction of mesons which come from -meson decay, , is measured for J/ rapidity and in + and Cu+Au collisions at =200 GeV with the PHENIX detector. The extracted fraction is = 0.025 0.006(stat) 0.010(syst) for + collisions. For Cu+Au collisions, is 0.094 0.028(stat) 0.037(syst) in the Au-going direction () and 0.089 0.026(stat) 0.040(syst) in the Cu-going direction (). The nuclear modification factor, , of mesons in Cu+Au collisions is consistent with binary scaling of measured yields in + at both forward and backward rapidity.
pacs:
13.85.Ni, 13.20.Fc, 14.40.Gx, 25.75.DwI Introduction.
Heavy quarks (charm and bottom quarks in the context of this work) are a powerful tool to investigate initial-state effects and quark-gluon plasma (QGP) medium formation in heavy ion collisions. Initial-state nuclear effects can alter the number of heavy quarks produced compared to extrapolations from + collisions. Once produced, however, the number of heavy quarks is preserved in strong interactions in the medium. Final-state effects, such as energy loss in the QGP Bjorken (1982); Dokshitzer and Kharzeev (2001), can only modify the momentum distribution of these quarks and open heavy mesons. On the other hand, the number of prompt is not expected to be preserved in the medium because of the low binding energy, which can allow the to be broken by medium interactions.
The mesons which decay to and subsequently decay into dimuon pairs, represent a relatively clean channel to extract -quark yields. At the Relativistic Heavy Ion Collider (RHIC), the PHENIX forward silicon-vertex detector (FVTX) along with the central silicon-vertex detector (VTX) provide the ability to measure precise event vertex positions as well as displacement of the decay muon trajectories from the reconstructed event vertex. This allows for the statistical separation of s from -meson decays from prompt s. The PHENIX muon detector acceptance for mesons in this channel is nearly constant over all transverse momenta, allowing for the direct extraction of momentum integrated -quark yields, corresponding to the number of quarks in the rapidity acceptance. With these yields, we can verify whether initial-state effects are relevant to -meson production in nucleus+nucleus collisions.
The only known source of nonprompt is production via -meson decay Olive et al. (2014), which has a typical decay time 1.5–1.6 ps Aaij et al. . The constituent bottom quarks have mass 4.5 GeV/ and are created from processes such as gluon fusion (), flavor excitation where heavy quarks () from the nucleon wave function scatter with gluons (), and gluon splitting () Norrbin and Sjöstrand (2000); Vitev et al. (2006). Gluon-gluon fusion and flavor excitation are equally dominant whereas the gluon splitting contribution is small at 200 GeV according to pythia8 hard scattering simulations Sjostrand et al. (2008).
Initial-state effects on the precursor gluons, before their hard scattering, include coherent multiple scattering, also called dynamical shadowing Vitev et al. (2006), incoherent multiple scattering Kang et al. (2013, 2015a), initial state energy loss Kang et al. (2015b), and saturation of small momentum fraction gluons McLerran and Venugopalan (1994). Nuclear parton distribution functions, extracted from deep inelastic scattering and Drell-Yan experimental data, such as EPS09 Eskola et al. and impact-parameter-dependent EPS09s Helenius et al. , indicate a pattern of suppression for small- gluons and an enhancement of intermediate to large- gluons. Semi-leptonic decays of particles carrying heavy flavor and produced inclusively in Au collisions at 200 GeV Adare et al. (2014, 2012a) indicate yield suppression at forward rapidity, where Bjorken gluons dominate. The same analysis also revealed a clear yield enhancement at mid- and backward rapidity, where gluons with fractional momentum are dominant. A similar enhancement was observed in the measurements of mesons in Au at midrapidity Adams et al. (2005).
Asymmetric Cu+Au collisions have the advantage of being a relatively large system which can access different regions at positive and negative rapidities. Studies in these collisions provide a powerful test of how initial-state effects observed in small systems, such as , can be projected in large heavy ion collisions. In the PHENIX muon arms, positive rapidity corresponds to the Cu-going direction, probing small- in the Au nucleus and large- in the Cu. Negative rapidity covers the Au-going direction, probing small- in the Cu nucleus and large- in the Au. Initial state parton distribution modifications are predicted to be stronger in the Au nucleus Aidala et al. (2014a). If these modifications have the same pattern as seen in +A collisions, they may cause suppression in the Cu-going (positive rapidity) direction and enhancement in the Au-going direction. Initial-state energy loss Xing et al. (2012) also results in larger suppression at positive rapidity.
In this study we quantify the fraction of muons from the decay of nonprompt in + and Cu+Au collisions at 200 GeV using the PHENIX muon arms measuring in the rapidity range . The nonprompt fractions are then used to calculate the nuclear modification of mesons in Cu+Au collisions. This result uses the capability to measure the approach between muons and the collision vertex using the FVTX Aidala et al. (2014b). Section II describes the experimental apparatus and the data set. Section III describes the data selection, backgrounds and defines the distance of closest approach (). Section IV describes the simulation setup used to obtain the distribution profiles. The fit to the real data distance of closest approach distributions is detailed in Section V. Systematic uncertainties are discussed in Section VI. Results and interpretations are presented in Section VII.
II Experimental Apparatus and Data Set.
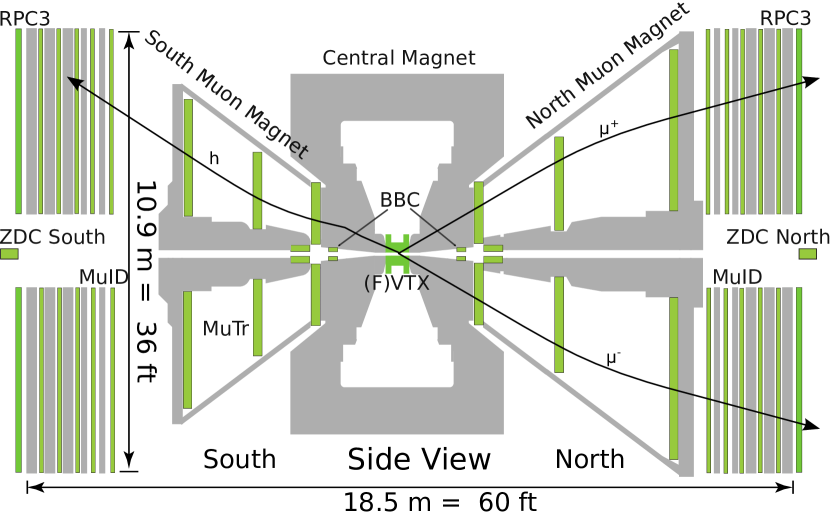
This analysis was performed using data sets obtained with the PHENIX detector (Fig. 1) at the Relativistic Heavy Ion Collider during the 2015 + and 2012 Cu+Au 200 GeV runs. Each collision was identified by the north and south beam-beam counters (BBC) which each comprise 64 quartz radiators instrumented with mesh dynode PMTs covering charged particles in the pseudorapidity region and with time resolution of ps. A fast online collision vertex can be determined from the difference between the average north and south arrival times. A minimum-bias (MB) event is triggered by two or more hits in each BBC and a measured vertex position cm, and results in an acceptance of of the total Cu+Au cross section. For + collisions, one or more hits are required in each BBC for the MB trigger, and of the total inelastic cross section is accepted. This analysis also used a sample of dimuon triggered events (MUIDLL1_2D) which required two roads of hits found in the Iarocci tubes in the muon identifiers (MuID), including at least one road that reached the most downstream tubes.
II.1 PHENIX muon spectrometers.
Each muon spectrometer covers a pseudorapidity range of and in azimuth. Each spectrometer comprises hadron-absorber material, muon trackers (MuTr) inside a conical-shaped magnet, and a MuID. The first layer of hadron absorber, placed between the FVTX and the MuTr, comprises 19 cm of copper, 60 cm of iron from the central magnet and 36.2 cm steel, corresponding to a total of 7.2 nuclear interaction lengths. This material absorbs pions and kaons emitted into the acceptance of the muon arms. The muon magnet system provides a radial field inside the MuTr volume of approximately Tm at 15 degrees from the beam axis, bending particles in the azimuthal direction.
Tracking and momentum measurements are performed by the MuTr, which comprises 8 octants of cathode strip chambers distributed in each of three -stations. The first two stations have three sensitive planes each, and the farthest station from the interaction region has two sensitive planes. Each plane contains two cathode readout strip planes with varying stereo angle orientations among the planes in the station in order to provide measurements in two spatial dimensions. The momentum resolution achieved by the MuTr is for a typical muon from decays.
The north and south MuID systems are located downstream of the MuTr and comprise five absorber plates totaling 4.8 (5.4) nuclear interaction lengths in the south (north) arm. Two Iarocci tube planes with vertical and horizontal orientations distributed in six individual panels are placed after each of the five absorber gaps. Pion and kaon rejection after all absorber material is larger than a factor of 250. Only muons with momentum are able to penetrate all absorbers. Recorded hits in the tubes are used to reconstruct roads which are used in the MUIDLL1_2D trigger and in full muon track reconstruction. Technical details of the muon arms can be found in Akikawa et al. (2003); Adler et al. (2007).
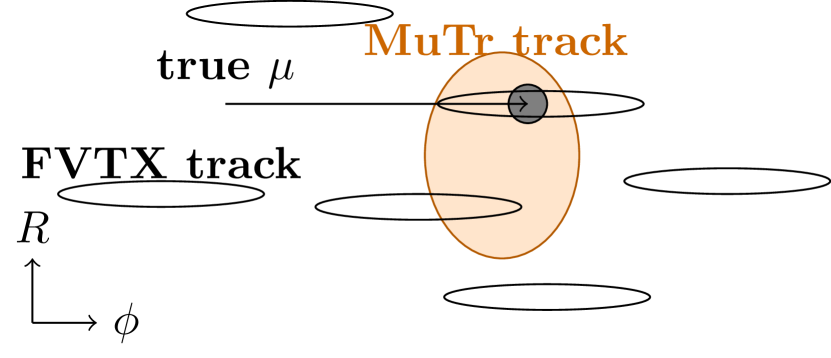
Particles produced at the primary vertex cross 7.2 interaction lengths of absorber before reaching the first MuTr station located at cm. Due to multiple scattering in the absorber, the projection of tracks reconstructed in the MuTr to the FVTX has a standard deviation radius of 3 cm. The FVTX helps track these particles from the absorber to the vertex point.
A precise vertex measurement is provided offline (Sec. III.3) by the central arm vertex detector (VTX) and the FVTX. The VTX Li et al. (2004); Ichimiya et al. (2009) is a silicon detector with four radial layers placed at 2.6, 5.1, 11.8 and 16.7 cm from the -axis, covering 1.6 and cm. The innermost two layers have pixel segmentation of 50m425m and the two outer layers comprise stripixels with an effective pixel size of 80 m in R and 1 mm in z.
| Mean -position of discs [cm] | 20.1, 26.1, 32.2, 38.2 |
|---|---|
| segmentation each disk | 48 wedges 2 columns |
| inner radius | 4.4 cm |
| strip pitch | 75 m |
| strip length | 3.4 mm to 11.5 mm |
| total number of strips | 1.08 M |
| silicon thickness | 320 m |
The FVTX is a silicon detector installed in 2012 to precisely measure the radial distance of closest approach () of extrapolated particle trajectories to the collision vertex (Sec. III.4), allowing statistical separation between prompt muons and muons from the decay of long-lifetime particles. Geometrical characteristics of the FVTX are listed in Table 1. More technical details concerning the FVTX detector can be found in Aidala et al. (2014b).
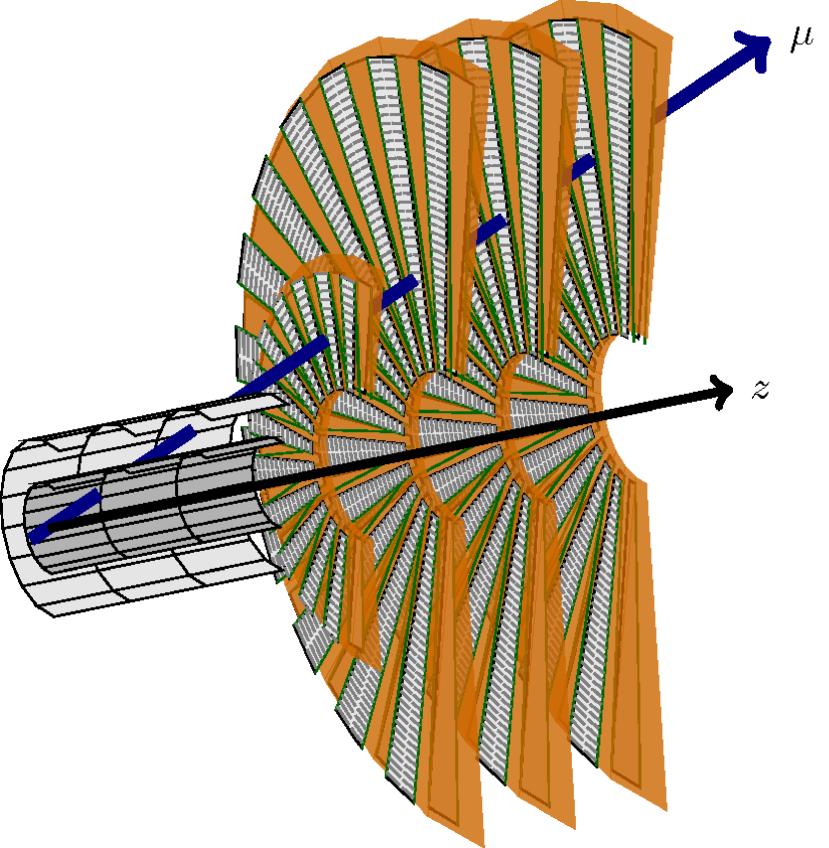
Tracks reconstructed in the silicon system are required to have at least three hits in different FVTX disks and/or VTX pixel layers (seen as half-cylinders in Fig. 2). The magnetic field in the region of the FVTX is primarily in the -direction, resulting in only a very small bending of tracks in the direction. Therefore, the FVTX cannot measure particle momentum, which can be reconstructed only if the FVTX track is associated to a MuTr track.
II.2 Data set and quality assurance.
Only collisions with a vertex determined by the VTX and FVTX within cm from the nominal interaction point are selected. Collisions where the vertex determination (Sec. III.3) has an uncertainty larger than 500 m (200 m) are also rejected in + (Cu+Au) data. The fraction of collisions within the vertex range used in this analysis is 14% in + and 18% in Cu+Au. Only MB triggers or MUIDLL1_2D triggers in coincidence with a MB trigger (MUIDLL1_2D&MB) were analyzed. In + the number of analyzed events in the selected vertex region is , corresponding to an integrated luminosity of . In Cu+Au 5.7 MB and 284 MUIDLL1_2D&MB events were analyzed in the selected vertex range. The MB trigger is sensitive to 5.230.15 b of the total Cu+Au cross section, according to Glauber calculations reported in Aidala et al. (2014a). Therefore, the Cu+Au events used in this analysis correspond to = 1.0 nb-1, or the + equivalent of 11.8 pb-1.
The run-by-run average (described in Sec.III.4) measured for of all charged particles by the FVTX was found to be stable throughout the data collection period in the Cu+Au run. For the case of + collisions, of data are rejected due to instabilities of the measured .
III Data Selection and How to Obtain the Distance of Closest Approach Distributions.
B mesons have a mean decay length m, a scale measurable by precision vertex detectors. At large rapidity the momentum boost to the decay length is larger than at midrapidity (), allowing -meson identification via nonprompt decays even at zero transverse momentum.
Typically, the fraction of -meson decays in samples (here defined as ) is determined by measuring the vertex given by the intersection of the two muon trajectories in the dimuon pair. This approach is not used in this analysis because: 1) the dimuon vertex cannot be precisely determined because of the limited resolution of the FVTX; 2) a fraction of the sample of decays would be lost in the sample when one of the muons reconstructed by the MuTr does not match to the FVTX.
In this analysis the decay is identified by the dimuon invariant mass of selected MuTr+MuID tracks. In a second step, muon candidates from the identified decay that have matching FVTX tracks are selected. The radial distance of closest approach (Sec. III.4) is determined for combined FVTX+MuTr+MuID tracks after quality cuts. The following sections detail how the sample is selected, how the backgrounds are treated, and how is defined.
III.1 Selection of candidates.
Single muon candidates are MuTr tracks that are associated to MuID roads (Sec. II.1). The MuTr track is required to have at least 11 out of a maximum of 16 hits in different cathode planes, and the fitted track should return a NDF10, cut based on the distribution obtained from simulated muons which also accounts for tracks crossing malfunctioning channels in the MuTr. Because a track is required to cross all absorbers, only muons with a total reconstructed momentum larger than 3 GeV/ are accepted. The MuID roads are required to have at least 6 out of a possible 10 hits in different tube planes including a hit in one of the planes located behind the last MuID absorber. Three standard deviation cuts are applied to the distance and angle between the MuTr track and the MuID road projections at the first MuID gap. Dimuon pairs formed from MuTr+MuID selected muons are required to have an opening angle larger than 45o if the dimuon is smaller than 5 GeV/. Implementation of this cut helps remove contributions from ghost tracks. A fit involving the muon pair tracks and the collision vertex is required to have a in + (Cu+Au) data, corresponding to a maximum distance between the dimuon crossing and the collision point of approximately 1 cm. This cut has no impact on decay acceptance.
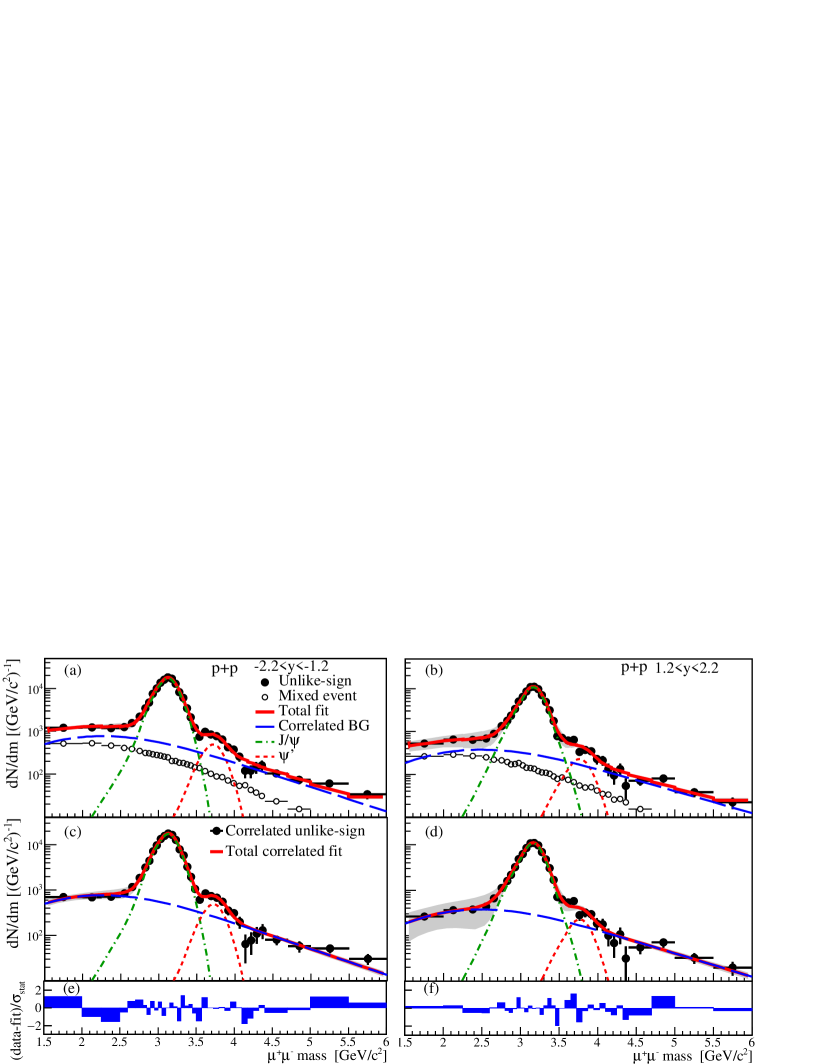
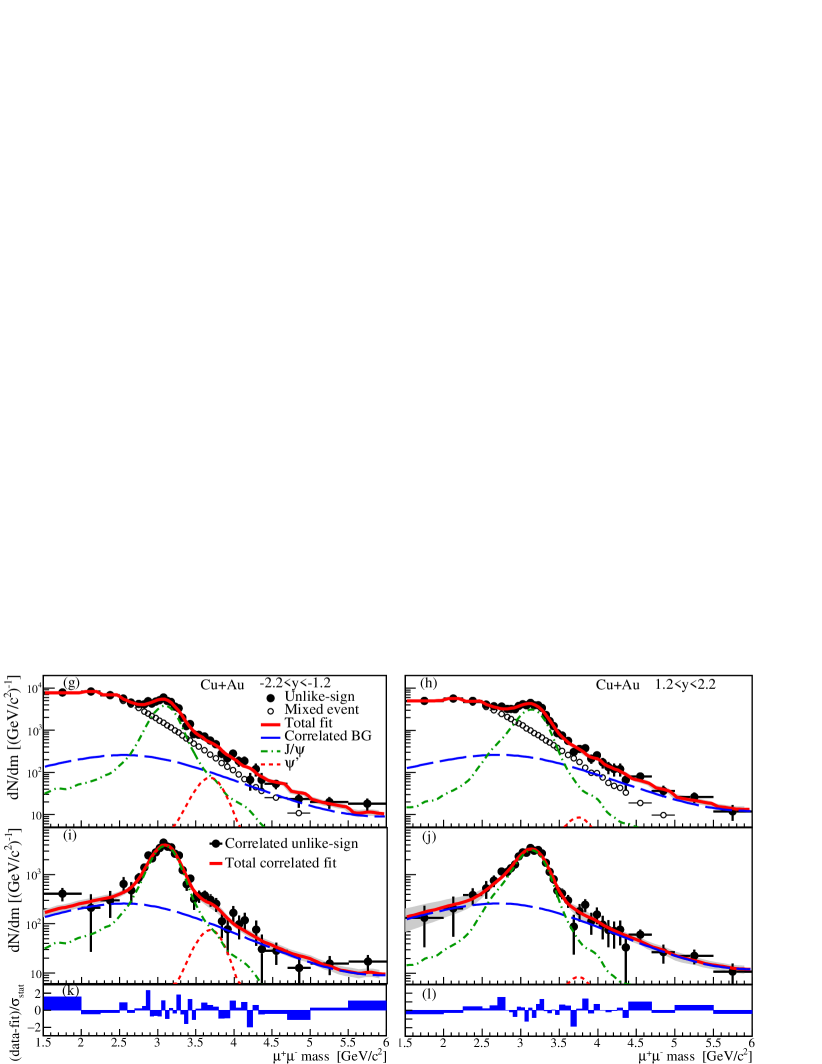
Dimuon spectra in the region of the mass are shown in Fig. 3 for both muon arms. The combinatorial background, shown as open circles in panels (a) and (b), corresponds to random combinations of muons. This background is determined from mixed event dimuons and normalized by the geometric average between same event like-sign sources , and mixed event like-sign sources , :
| (1) |
Mixed event dimuons are required to come from two separate events with a -vertex difference no larger than 1.5 cm and a difference between collision centrality percentiles that is no larger than 5%. Accumulated mixed event dimuon counts are five times larger than the same-event dimuons in order to reduce background statistical uncertainties. The number of selected decays inside the dimuon invariant mass , the signal over background, after all quality cuts, and the fraction of correlated continuum background are listed in Table 2.
| data | arm | net count | S/CBG | |
|---|---|---|---|---|
| + | south | 5978150 | 32.7 | 5.5 0.3% |
| + | north | 371467 | 33.6 | 5.3 0.4% |
| Cu+Au | south | 307592 | 1.13 | 10.3 2.4 % |
| Cu+Au | north | 267582 | 1.35 | 10.7 2.5 % |
Correlated background expected to contribute in the mass region is mainly from and processes. The amount of correlated background shown as dashed lines in Fig. 3 is estimated by fitting the function
to the unlike-sign dimuon mass distribution , where CBG is the combinatorial background, is the correlated background, and are the and simulated peaks, is the mass dependent detector acceptance and efficiency determined from simulation and trigger emulator. The correlated background functional form of accounts for an exponential behavior at low mass and a power law behavior at high mass, verified in pythia8 simulation of and pair production. The free parameters in the fit are , , , , and . Fitting constrains are applied to , and according to a fit to correlated like-sign dimuon mass distribution in the same mass range. Table 2 also shows the extracted fractions of correlated background in the mass region:
| (3) |
III.2 FVTX-MuTr track association.
Requirements for standalone FVTX track selection include a minimum of three hits in different FVTX or VTX planes. The analysis require a FVTX track has a probability (p-value) larger than 5%. The track quality selection keeps 95% of the true tracks according to simulations. FVTX-MuTr track matching is performed as follows:
-
1.
MuTr and FVTX tracks are projected to three -plane locations: 1) the fourth FVTX disk from the vertex, 2) the middle of the absorber materials in front of the MuTr and 3) the first MuTr station. Radial ( and ) and azimuthal ( and ) position and momentum projections, and uncertainties (, , , ) are calculated for each FVTX and MuTr track using the GEANE Kalman Filter algorithm Innocente et al. (1991) taking into account the detector geometry, the amount of absorber material and the magnetic field map. The momentum magnitude used for FVTX track projections is taken from the associated MuTr track.
-
2.
A combined FVTX+MuTr track is calculated for each association from individual and track qualities and FVTX-MuTr projection residuals in the tree planes in an approximation considering the correlation between residuals in different planes is small:
(4) where and are just track directions determined by the FVTX.
-
3.
Only FVTX-MuTr combined tracks with /NDF6(3) are accepted for further analysis in + (Cu+Au) data.
-
4.
In the + analysis, at least one VTX hit is required for tracks inside the VTX acceptance to reduce effects from additional material that was installed just before the 2015 run between the VTX and FVTX.
FVTX-MuTr track mismatches can occur if MuTr tracks are projected onto a region where the FVTX is not active. These MuTr tracks tend to incorrectly associate with tracks in neighboring live regions which can distort the distributions. Fiducial cuts were applied to remove MuTr track projections onto nonactive regions in the FVTX and their edges to minimize these mismatches. Edge effects are further reduced by requiring the azimuthal residual between the FVTX and MuTr track projections is no larger than 100 mrad (corresponding to the MuTr azimuthal projection resolution).
Once the FVTX-MuTr association passes the matching criteria, the tracks are combined providing a momentum vector and projection at the vertex plane. The combined track has precise momentum and azimuthal direction mostly from the MuTr track information, and FVTX track information dominates the radial direction precision.
We determined that 65% of MuTr tracks in Cu+Au collisions find more than one potential FVTX track association passing the quality and the matching criteria described above (Fig. 4), whereas the probability of having more than one association is about 15% in + collisions. Because of this small fraction, the + analysis uses only the best matching. The multiple associations are pronounced in central Cu+Au events because of the large FVTX track density, and for MuTr tracks with small momentum where projection uncertainties are larger because of the estimated multiple scattering in the absorber. In events the best association has a chance to happen between a MuTr track from the candidate muon and an FVTX track from an underlying event particle. In this situation the measured vertex displacement will correspond to a background particle and not the -meson decay. In the Cu+Au analysis all FVTX-MuTr associations passing matching criteria (not just the best) are used in the distributions in order to extract the correct FVTX and MuTr track associations. The contribution of mismatches to the track associations is then determined from event mixing, where MuTr tracks from one collision event are mixed with FVTX tracks from another event. Collisions are categorized in 10 FVTX track multiplicity and 200 -vertex classes. The number of classes was chosen as the minimum number for which there was no observed change in the distributions of simulations embedded in real data. MuTr tracks are mixed only with FVTX tracks belonging to the same collision event category. DCA distributions from mismatches are normalized by the relative FVTX track densities between same event and mixed event associations
| (5) |
The number of mixed event FVTX-MuTr associations is arbitrarily chosen to be five times larger than in same events in order to reduce background statistical fluctuations. The normalization 5 was tested with entire pythia8+geant4 events containing prompt and embedded in real data, where the distributions, after subtracting the normalized, event-mixed mismatch tracks, show excellent agreement with distributions not embedded in real data.
III.3 Primary vertex determination.
The + (Cu+Au) collision events are distributed in a volume, , of approximately () centered within the PHENIX detector. Collisions within cm produce charged particle tracks in the nominal VTX and FVTX acceptance where the tracking can be utilized to precisely determine the collision point. The primary vertex location is found by the minimization of the squared impact parameter for the collection of reconstructed charged particle tracks found in the VTX and the FVTX. In Cu+Au, bias created by tracks with off-vertex decay points is negligible due to the large number of particles created in the collisions of large nuclei and limits on the impact parameter cluster sizes used during the fitting procedure. In Cu+Au, the final primary vertex position is determined by a three dimensional minimization on an event-by-event basis. The majority of the position information in the minimization comes from tracklets within the VTX layers due to this detector’s fine azimuthal segmentation of 50 m, short projection length of cm, and typically large impact angles between reconstructed tracks. The event multiplicity is the key factor driving variance in the vertex resolution
| (6) |
where the , , and vertex uncertainties are obtained event-by-event from the vertex minimization procedure. The vertex uncertainty is determined from independent measurements in north, south, east and west parts of the VTX and FVTX detector. A check of these uncertainties is performed with detector simulation, using hijing Wang and Gyulassy (1991) and pythia8 generated events. The vertex resolution varies between 30 (central collisions) and 200 (peripheral collisions) in Cu+Au collisions. Due to the low multiplicity in + collisions, the average and beam position in the transverse plane at the interaction point over a short data taking period (90 min) are used in place of an event-by-event determination. Therefore, the and beam position resolutions correspond to the spread of the beam position (130 m). The -position is still determined event-by-event with typical resolution of 200 m. A summary of all vertex requirements for an event to be selected is listed in Table 3.
| requirement | cut |
|---|---|
| vertex position range | 10 cm |
| vertex resolution in + | 500 m |
| vertex resolution in Cu+Au | 200 m |
III.4 Distance of closest approach measurement.
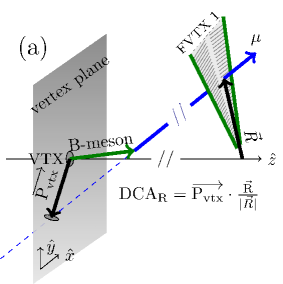
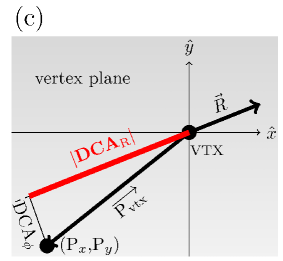
The combined FVTX+MuTr track is projected to a plane perpendicular to the -axis and placed at the measured -position of the collision point. The displaced vertex vector is defined by the track projection and the collision point as illustrated in Fig. 5a and 5c.
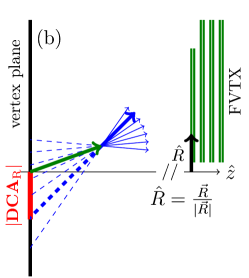
This projection is not precise in the direction because of the coarse segmentation of the FVTX in this direction, so the radial projection is used in this analysis, where the FVTX has the best segmentation. In Fig. 5 the radial axis is defined by the track projection at the first FVTX station and the -axis . The precise displacement vertex, which we call the radial distance of closest approach at the vertex plane is a projection of the vector on the radial direction
| (7) |
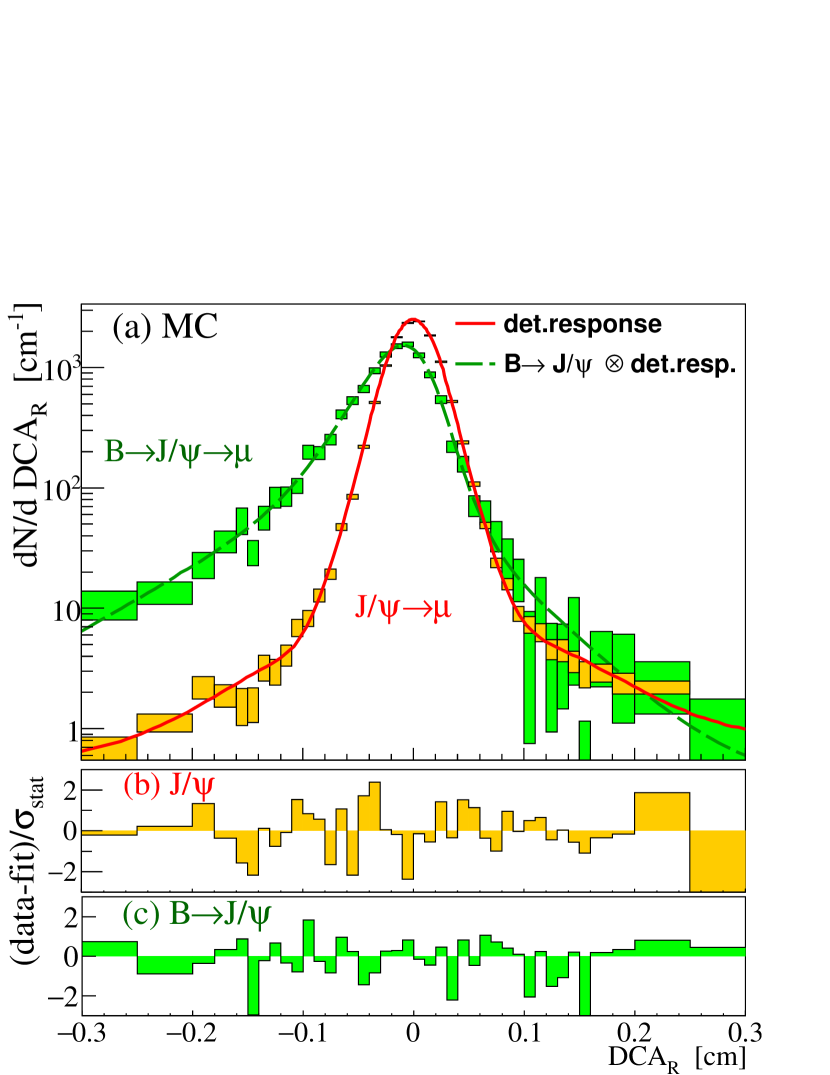
Figure 5b shows a two-dimensional projection on the plane of the track. The extension of the distribution depends on the decay length of the parent particle and the rapidity difference between the parent particle and the muon. Figure 6 shows the shape of distributions of muons from simulated and prompt decays thrown in the detector response simulation. Negative (where and have opposite directions) is larger for long range decays, producing an asymmetric distributions for muons from heavy flavor decays which facilitates their separation from other contributions from prompt particles during the fitting procedure.
III.5 Backgrounds in the distributions.
The distributions comprise MuTr tracks, from dimuons in the mass region, which are associated with one or more FVTX tracks. Each FVTX+MuTr association counts in the distributions. There are two significant sources of uncorrelated background in the distributions: 1) combinatorial background described in Section III.1 in the mass region, corresponding to dimuons which are not from decays; and 2) FVTX-MuTr mismatches described in Section III.2 corresponding to MuTr tracks from decays but associated to the wrong FVTX track. Figure 7 shows the contribution of these backgrounds, extracted using the techniques described above, in the raw distribution obtained in both arms. The combinatorial background distribution is obtained from mixed event dimuons, and the mismatch contribution is determined from event mixed MuTr-FVTX associations. Statistical fluctuations are reduced by obtaining five times as many mixed event pairs and misassociations than in same event backgrounds. The normalization of these two distributions was explained in Sections III.1 and III.2. According to the distributions shown in Fig. 7, most background contributions come from prompt particles, but the relative background contribution changes at large where fake or bad quality tracks and muons from light hadron decays are more significant.
The line shape of correlated background contributions from and is obtained from simulation and discussed in Sec. IV.2.
IV Simulation.
In this Section we describe how the line shape of each dimuon source in the mass region is obtained from simulation.
IV.1 Detector response of prompt particles.
The detector response to prompt decays, such as muons from prompt , is estimated using prompt hadrons (pions, kaons and protons) generated by the pythia8 event generator in MB mode and a geant4-based detector simulation package Agostinelli et al. (2003). Several dead channel configurations are used to account for run-by-run detector acceptance fluctuations. This procedure was found to be crucial to simulate remaining edge effects (Sec. III.2) and degradation of FVTX-VTX track quality which can potentially produce long tails in the measured distributions. The simulated geant4 signals from all generated hadrons in a single pythia8 event are embedded in real data to account for occupancy and accidental hit-track-association effects in the measurement. All particles generated by the detector simulation are shifted by , where each of the coordinates is a common Gaussian random number centered at the vertex position measured in the real data event and with a width determined from the vertex uncertainty of the real event the simulated particles are embedded in. Event reconstruction, including the simulated hits and the entire real data signal in the event, is then performed in the same manner as with real data.
Additional smearing and offsets are needed in the simulated in order to account for irreducible detector misalignments, additional smearing of the primary vertex resolution that is not accounted for in the simulations, and any missing materials in the simulation that could be a multiple scattering source between the interaction region and the last FVTX plane. The measured resolution depends on 1) the vertex uncertainty defined in Eq. (6); 2) a momentum independent parameter which represents the sum of the detector resolution contribution to the resolution, additional vertex uncertainty which might not be captured by , residual detector misalignments and possible beam line tilt variations during the run; and 3) a multiple scattering term in the VTX and FVTX material which introduces the momentum dependence in the resolution:
| (8) |
Particles which stop at the third absorber plane in the MuID comprise mainly prompt light hadrons and 7% contribution from hadron decays according to pythia8+geant4 simulation. This sample provides a relatively clean selection of prompt particles which can be used to compare spectra between simulation and real data. The distributions from the measured prompt hadrons are compared to simulated hadrons, and small smearing corrections are added to the simulated spectra until they match the real data spectra.
For real data and simulations, the value is set according to the event-by-event vertex resolution that is provided by the vertex finding code. The fit parameters and are extracted from the real data distributions, and the simulated data has additional smearing added until the distributions produce the same and fit results. An additional smearing of 70(110) m was found to be necessary in the + (Cu+Au) setup. After tuning the simulation, the distribution of simulated hadrons stopping in the MuID is weighted according to the momentum distribution of real data stopped hadrons.
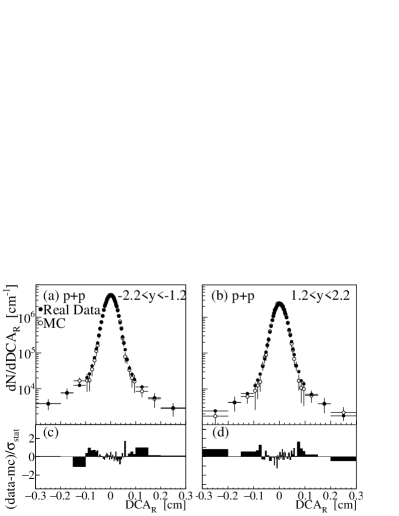
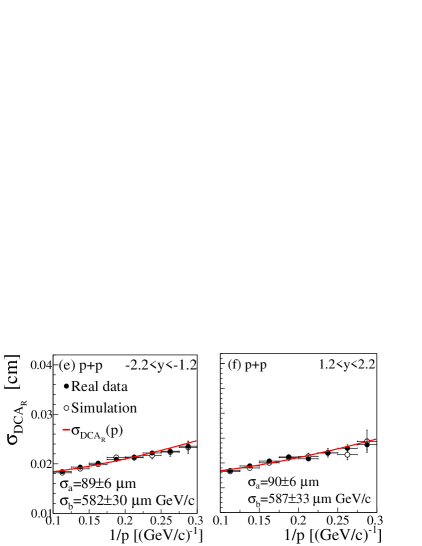
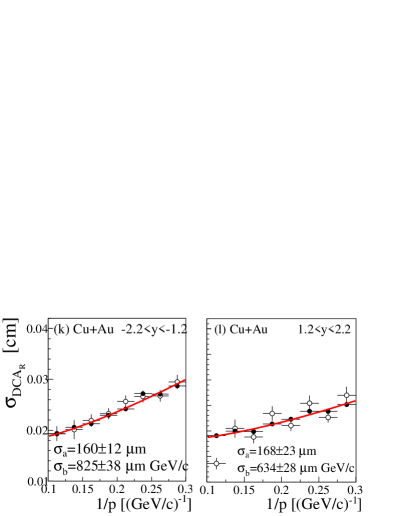
Figure 8 shows the distribution of these prompt hadrons in real data compared to pythia8 generated hadron events which have had tuned smearing parameters added. Figure 8 also shows the final fit parameters and for each of the north (positive rapidity) and south (negative rapidity) arms. Although the material present in the north and south arms is nominally identical, the momentum-dependent resolution parameter is found to be different for the two arms in the Cu+Au data set. The reason for this is that the vertex distribution for BBC-triggered events in Cu+Au events was found to be highly skewed toward the north arm, given the collision species asymmetry. Because of this, FVTX tracks had on average a shorter projection to the vertex for tracks in the north arm than in the south arm, resulting in a smaller contribution to the resolution from multiple scattering in the north than in the south. Long tails in the distribution contain part of the light hadron decay contribution but are mostly dominated by accidental hit-track associations which are reasonably well reproduced by the embedded simulation in the range used in this analysis.
IV.2 Prompt and heavy flavor decay simulations.
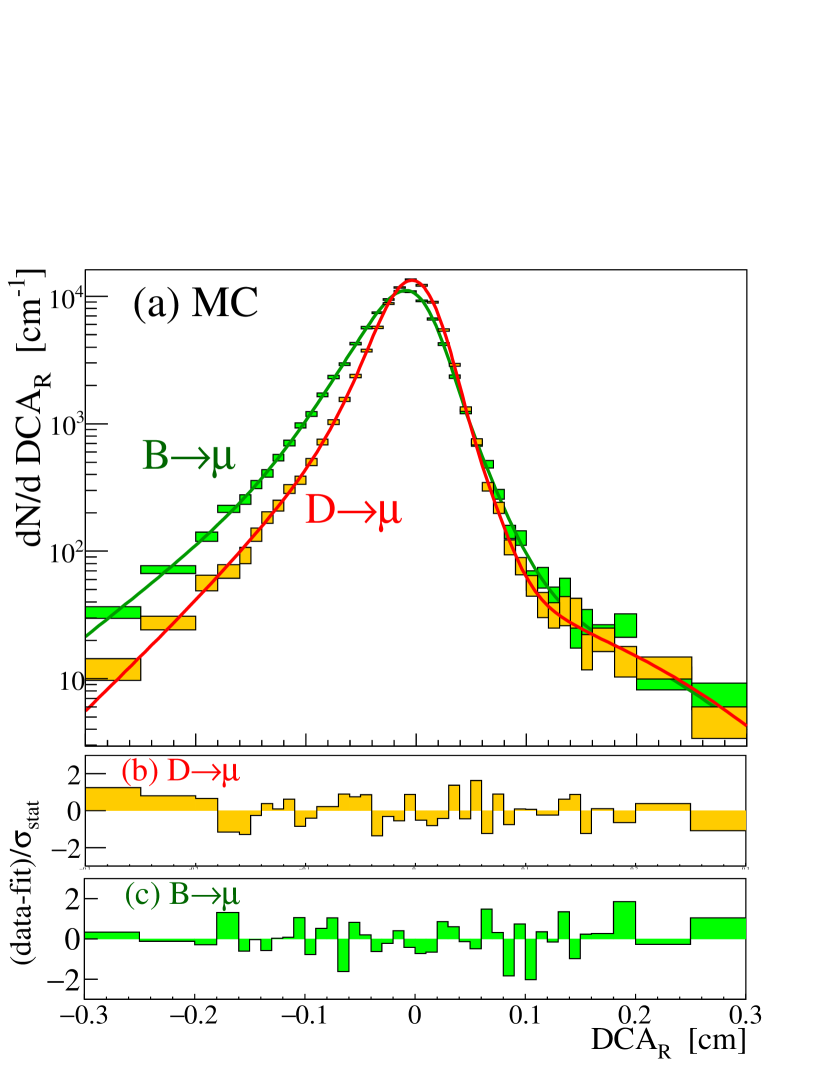
Prompt and decays are generated using the pythia8 event generator; open heavy flavor from and processes are produced with leading order processes (gluon fusion) and the CT10 parton density distribution functions Lai et al. (2010). All particles generated in the or prompt event are used as input to the geant4 detector simulation and are embedded in real data. Generated events have the values smeared and offset according to the parameters obtained for light hadrons as described in Section IV.1. Simulated events are also weighted according to the momentum distribution of background-subtracted (combinatorial dimuon and FVTX-MuTr mismatch) muons from real data dimuons. Figure 6 shows the distributions obtained from these prompt and simulations. Several hypotheses of nuclear modifications are considered in the momentum weighting for systematic uncertainty evaluations and described in Section VI.1.2. Point-to-point statistical fluctuations in the generated distributions are minimized by using fitted analytical functions for the final fits. The distributions obtained from prompt simulation are well described by a three-Gaussian (, and ) function with a detector offset and resolutions , and , and regulated by :
The following function defines the prompt line shape of prompt decays
| (10) |
The true distribution for heavy flavor decays is described by a set of three exponential functions:
| (11) |
which must be convoluted with the detector response function (IV.2) extracted from the prompt fit in order to obtain the measured distribution:
| (12) |
The dashed line in Fig. 6 shows function (12) fitted to the simulated decays. Function (12) is also used to fit the simulated correlated background components and as seen in Fig. 9. The heavy flavor decay functions used in the final fit are:
| (13) | |||||
where , and are the parameters in Eq. (11) fitted to the corresponding heavy flavor decay simulations.
V Fitting Procedure.
The final fitting function used for the real data muon distribution is
where BGuncorr includes the normalized dimuon combinatorial (Sec. III.1) and FVTX-MuTr mismatch (Sec. III.2) backgrounds. The correlated background BGcorr comprises and contributions:
where is the number of muons after subtracting BGuncorr. The continuum correlated background is defined in Table 2. The muon count from inclusive decays is . The fraction of contribution in the correlated background f was determined from extrapolations of previous and cross section measurements Adare et al. (2006, 2009) indicating a fraction f=0.32 0.21 in + collisions at 200 GeV. The contribution in the correlated background is completely undetermined in Cu+Au collisions. So we set f=0.5 in the standard fit and vary it in the range f[0,1] for the systematic uncertainty evaluation.
The measured fraction of -meson decays F is the only free parameter when fitting function (V) to the real data muon distribution. The true is obtained by correcting the measured with a factor given by the relative detector acceptance and efficiency of from -meson decays with respect to prompt decays
| (15) |
where [0.96, 0.98] depending on the data set (+ or Cu+Au) and muon arm.
The fit is performed with an unbinned extended log-likelihood method, where
| (16) |
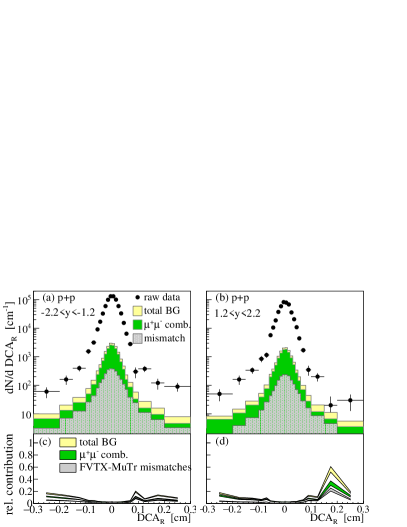
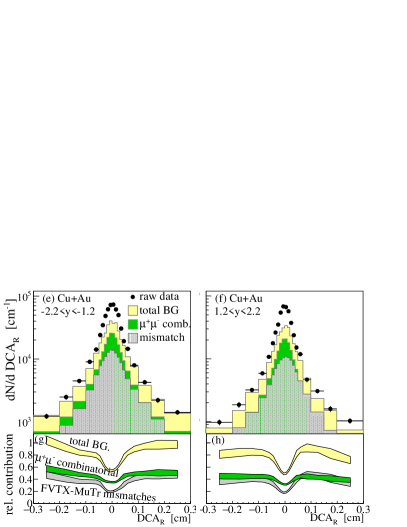
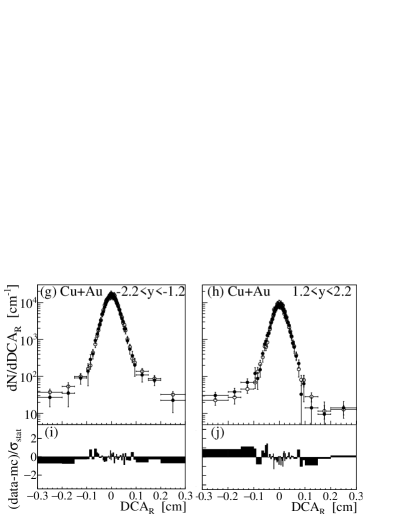
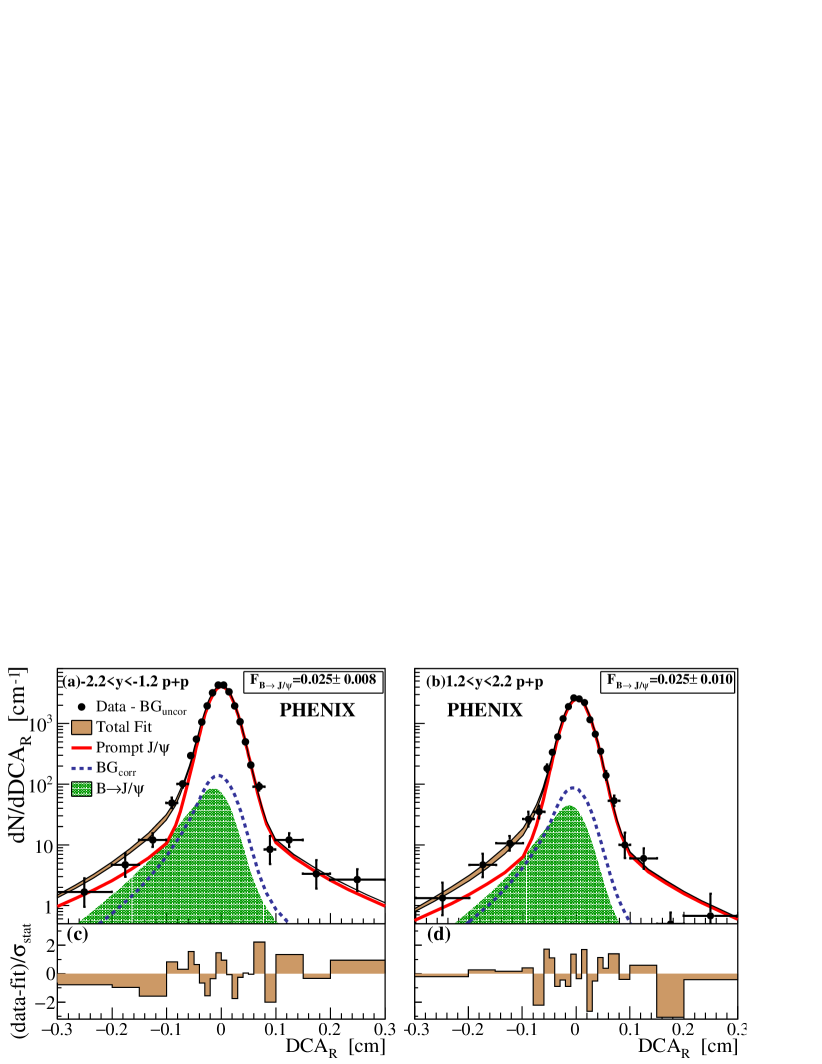
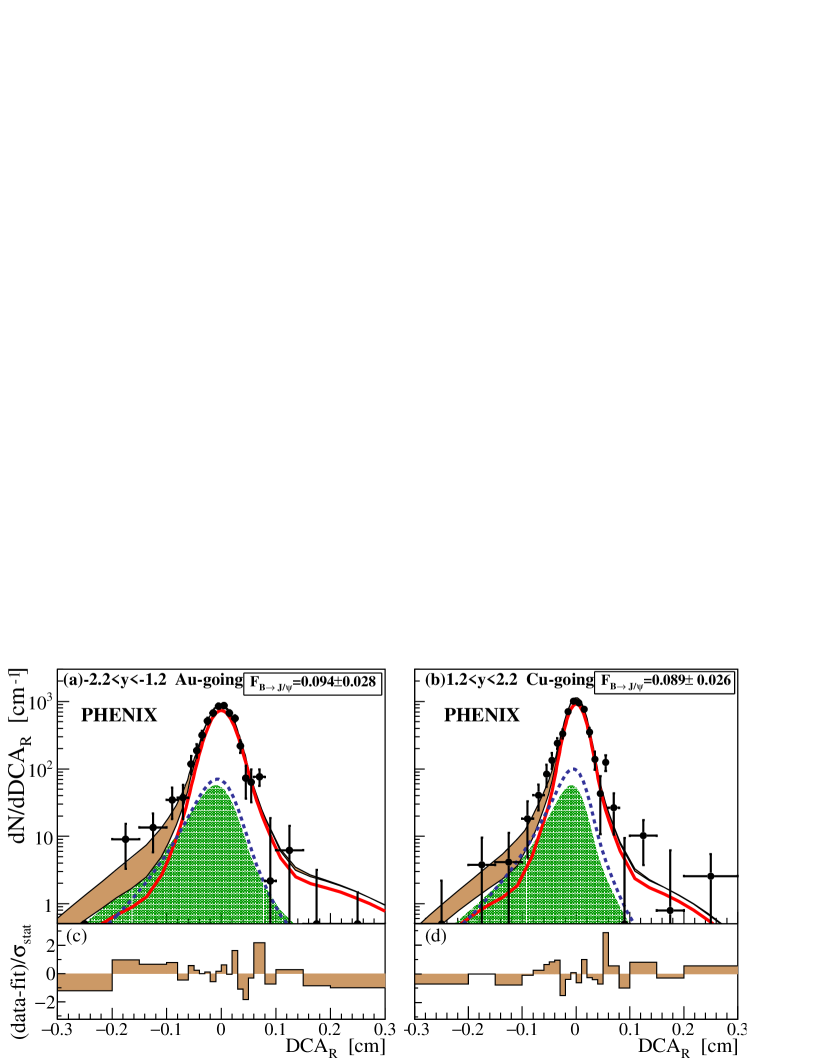
is minimized. is the number of muons in the distribution, including the backgrounds. Figures 11 and 11 show the fitted function (V) to the distributions in + and Cu+Au collisions, respectively. The backgrounds due to combinatorial dimuons and FVTX-MuTr mismatches are subtracted for clarity in the figures. The bars in the figure show the total uncertainties of each data point.
VI Systematic uncertainties.
The systematic uncertainties are determined by fitting in function (V) several times, using random variations of the fitting parameters for each fit. This section lists all considered systematic uncertainty sources and how they affect the final results.
VI.1 List of systematic uncertainty sources.
VI.1.1 Testing of the fitting procedure.
The validity of the fitting procedure was tested by randomly generating distributions for backgrounds, , and prompt , with tested in the range [0, 0.4]. The total number of entries in the summed distributions were generated to match the real data distributions. The fit results over thousands of randomly generated distributions in each F return F with average bias in Cu+Au data and negligible in + data.
VI.1.2 Weighting of simulated samples.
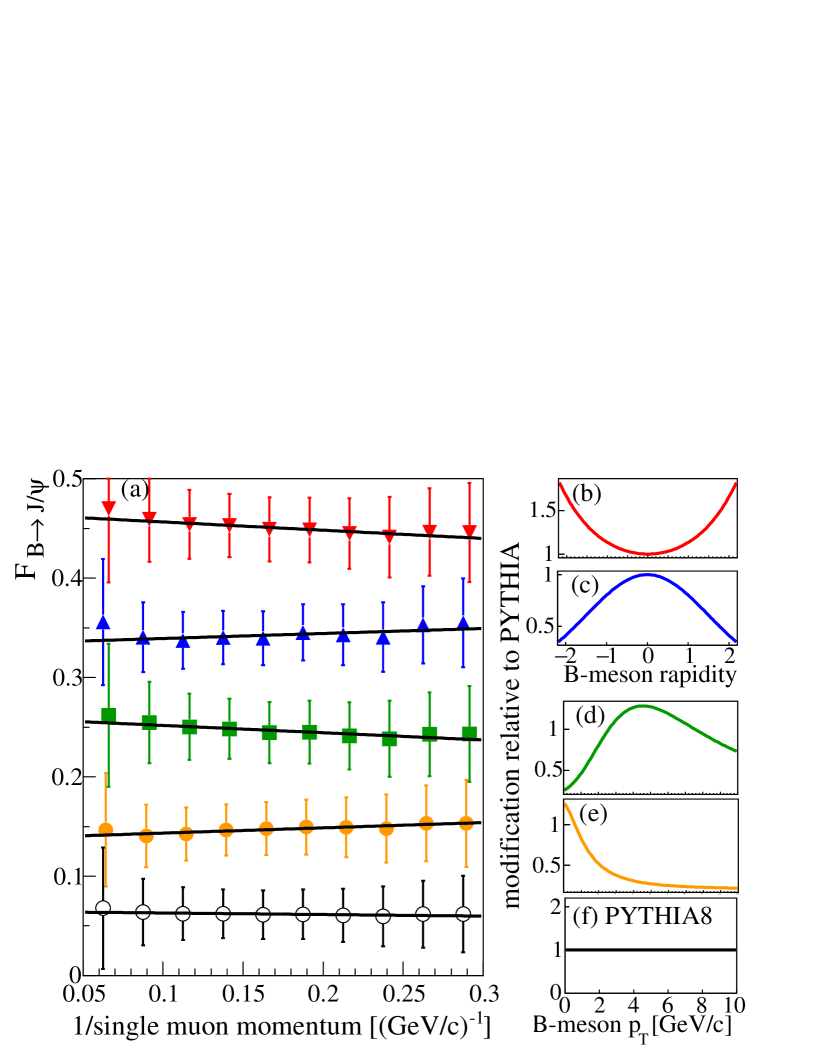
All detector reconstructed simulated samples were weighted according to the single muon momentum distributions of real data muons from decays used in the distributions. This weighting already accounts for the realistic momentum distribution of measured dimuons in the mass region. Figure 12 shows how the momentum distribution of muons from decays are distributed relative to muons from prompt decays in several conservative -meson and rapidity yield modification hypotheses. The inverse momentum dependence obtained from the several hypotheses can be described by polynomials of degree one . The maximum deviation from the assumption used in the standard result is . This value is used in the systematic uncertainty determination.
VI.1.3 resolutions and offsets in simulation.
A relative variation of 15% in the detector offset, 5% for and 7% for are found when different fitting ranges are used to determine the offset and the momentum dependence of the detector resolution shown in Figs. 8c,d,g,h. Varying these parameters within their uncertainties produces fluctuations on the result of up to 0.015.
VI.1.4 tail contribution to the detector response function.
The detector response function (IV.2) is fitted to simulated and real data hadrons shown in Fig. 8. The third Gaussian, which accounts for the long range tails in the distributions, has a contribution which is 20% different between real and simulated data. This difference can be caused by 1) modified light hadron decay in real data, 2) bias in the FVTX-MuTr mismatch distribution normalization (5); or 3) missing accidental hit-track associations in simulation. The third Gaussian contribution in Eq. (IV.2), , is varied by 20% to account for these uncertainties. This variation produces a change in the of up to 0.004.
VI.1.5 Relative detector acceptance and efficiency.
Variations in the pythia8 parameters, such as renormalization factor and additional weighting in order to match measured rapidity and distributions in Adare et al. (2012b), used to determine the relative detector acceptance and efficiency introduce 1% relative fluctuation in the result in the +. When considering different scenarios for the -meson nuclear modification in Cu+Au; including variations with centrality, and rapidity; the fluctuation in relative to the default result is 5%.
VI.1.6 Dimuon combinatorial background and FVTX-MuTr mismatch distribution normalizations.
The dimuon combinatorial background normalization (1) varies by up to 3% when changing the mass range used to determine it. Another concern is how particle activity surrounding a B meson can affect the normalization (5) of FVTX-MuTr mismatch distributions. The normalization shows a 5% variation when embedding entire pythia8+geant4 events containing prompt and . When applying these variations in the fitting (V), the result has a standard deviation of 0.01.
VI.1.7 Correlated background.
The dimuon mass fitting uncertainty for the correlated background contributions shown in Table 2 is introduced as Gaussian random numbers before each fit. The fraction of in the correlated background is varied by f in + collisions based on the uncertainties in the total and cross section Adare et al. (2006, 2009). For Cu+Au collisions, f[0,1] is considered, which accounts for unknown and nuclear modifications. When applying these variations in the fitting procedure defined in Eq. (V) the standard deviation is 0.01 in + and 0.025 in Cu+Au.
VI.2 Total systematic uncertainties.
| source | + | Cu+Au | ||
|---|---|---|---|---|
| south | north | south | north | |
| fitting procedure | 0.001 | 0.005 | 0.005 | |
| simulation weighting | 0.003 | 0.002 | 0.005 | 0.005 |
| resolution | 0.004 | 0.004 | 0.012 | 0.015 |
| detector offset | 0.002 | 0.011 | 0.013 | |
| tail contribution | 0.001 | 0.002 | 0.004 | |
| relative acc.eff. | 0.001 | 0.005 | 0.005 | |
| background normalizations | 0.001 | 0.010 | 0.009 | |
| correlated bg | 0.002 | 0.003 | 0.018 | 0.018 |
| fraction of corr. | 0.008 | 0.008 | 0.017 | 0.018 |
| TOTAL | 0.009 | 0.010 | 0.033 | 0.034 |
VI.3 Other checks.
Other tests such as variations in the fitting range, and the use of simulated histograms rather than functions as fitting input, provided results that are statistically consistent with the default result. No additional systematic uncertainties are assigned from these checks.
VII Results.
VII.1 Fraction of B mesons in the sample.
| data sample | |
|---|---|
| -2.2-1.2 + | 0.025 0.008(stat) 0.010(syst) |
| 1.22.2 + | 0.025 0.010(stat) 0.009(syst) |
| 1.22.2 + | 0.025 0.006(stat) 0.009(syst) |
| -2.2-1.2 (Au-going) | 0.094 0.028(stat) 0.033(syst) |
| 1.22.2 (Cu+going) | 0.089 0.026(stat) 0.034(syst) |
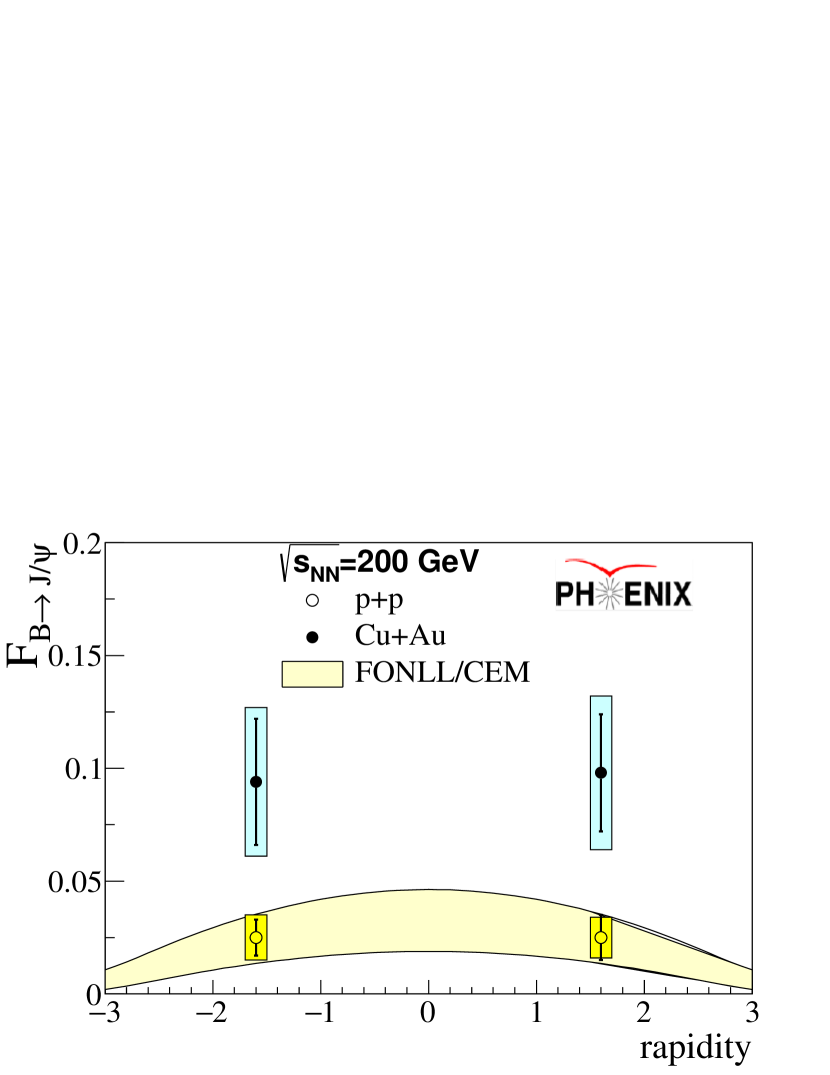
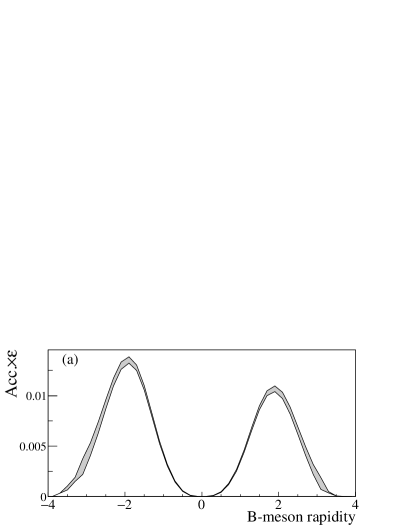
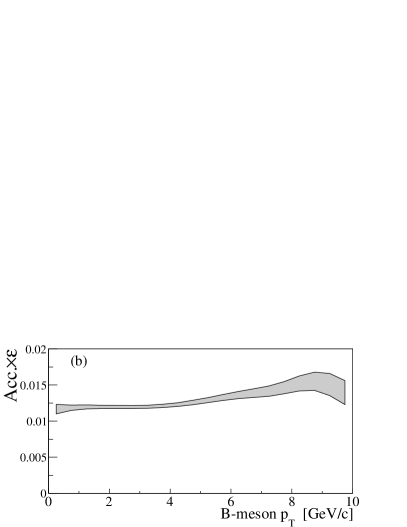
The acceptance and efficiency corrected -meson contributions to the yields collected in + and Cu+Au data are listed in Table 5 and plotted in Fig. 13. The detector acceptance and efficiency of -meson decays producing a in the muon arm apertures is shown in Fig. 14 as a function of rapidity and transverse momentum. The estimation is obtained from the simulation setup described in Section IV embedded in Cu+Au raw data. As can be seen in the right panel, the measurement presented in this analysis is the first which covers B mesons starting from zero in heavy ion collisions.
The obtained in + collisions is well described by a theoretical calculation based on FONLL Cacciari et al. ; Cacciari et al. (2005) for the and color-evaporation-Model (CEM) Frawley et al. (2008) for the prompt differential cross sections. Uncertainties in the theoretical calculation come from the bottom quark mass (4.5 - 5.0 GeV/) and scale uncertainties. The cteq6 parton-density function Nadolsky et al. (2008) was adopted in both FONLL and CEM calculations.
VII.2 Differential cross section of in + collisions.
The corresponding + differential cross section can be calculated by
| (17) |
where is obtained from measurement by PHENIX Adare et al. (2012b). The branching ratios Br and Br are reported in the particle data group Olive et al. (2014). The factor accounts for the fact that both quarks in the pair contribute to the . The results are shown in Table 6, where the average rapidity are obtained from the detector acceptance of events generated by pythia8. Table 6 also presents the corresponding FONLL calculation.
| [b] | |
|---|---|
| -1.6 | 0.51 0.16(stat) 0.20(sys) |
| 1.6 | 0.52 0.21(stat) 0.21(sys) |
| 0.51 0.13(stat) 0.20(sys) | |
| (FONLL) | 0.26(theory uncert.) |
VII.3 -meson nuclear modification.
The nuclear modification factor is defined by
| (18) |
where is the yield in Cu+Au and + collisions and is the average number of binary collisions in the Cu+Au data sample. The Glauber estimated average number of collisions in Cu+Au collisions is =108 11. The centrality and integrated RCuAu for inclusive in Cu+Au collisions is obtained from the results presented in Aidala et al. (2014a): 0.365 0.019(stat) 0.026(syst) in the Au-going direction and 0.295 0.026(stat) 0.021(syst) in the Cu-going direction with a global uncertainty of 7.1%. The separated prompt and -meson RCuAu can be extracted from inclusive RCuAu and through
| (19) |
where , and are the nuclear modification factors for prompt , B mesons and inclusive respectively.
The average of the results for shown in the first two rows of Table 5 is used as a + reference . The uncertainties in the resolution in simulation are correlated between the + and Cu+Au analysis and cancel out in the RCuAu results. The global uncertainty includes statistical and systematic uncertainties of the + reference. Table 7 and Fig. 15 summarizes the -meson and prompt- nuclear modifications obtained using Eq. (19).
| Au-going | 1.37 0.41(stat) 0.33(syst) 0.47(pp) |
|---|---|
| Cu+going | 1.05 0.31(stat) 0.28(syst) 0.47(pp) |
| Au-going | 0.339 0.021(stat) 0.026(syst) 0.075(pp) |
| Cu+going | 0.276 0.026(stat) 0.023(syst) 0.075(pp) |
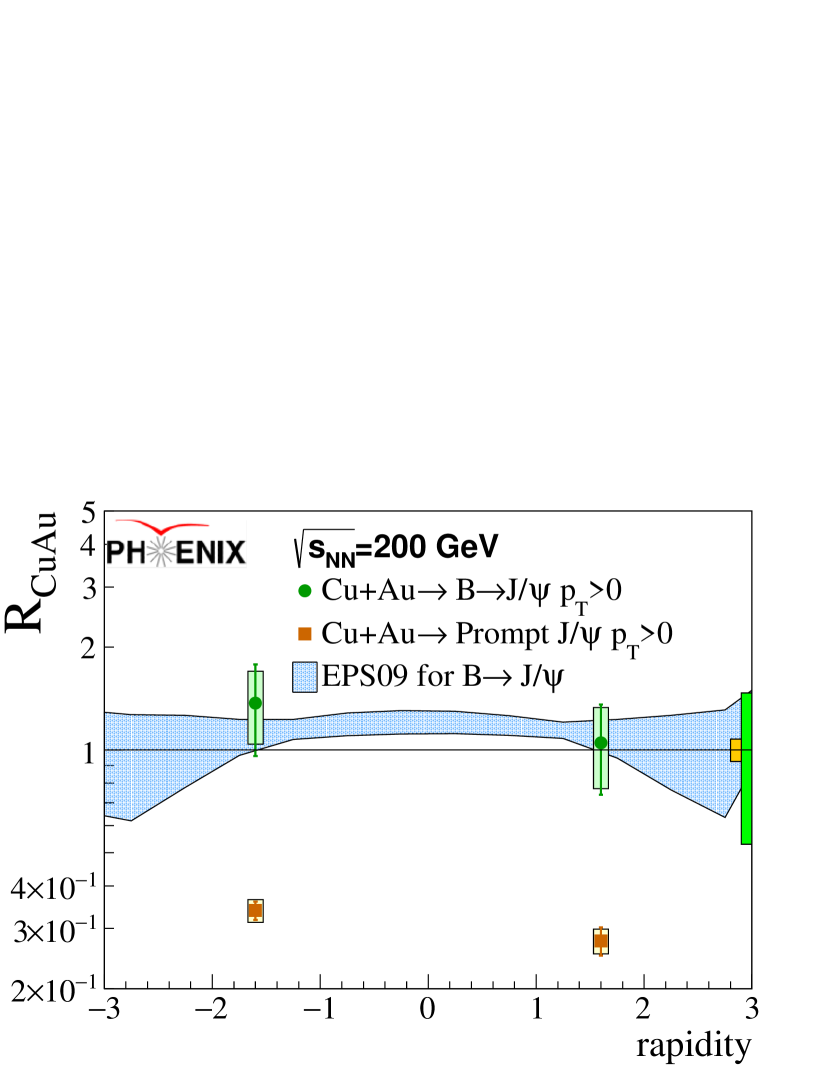
Both nuclear modifications factors from forward and backward rapidities are consistent with binary scaling of + yields given the large uncertainties. The results are also consistent with initial-state effects predicted by the EPS09 model Eskola et al. , shown in Fig. 15, which suggests a modest enhancement. The EPS09 calculation uses as input and from events generated by pythia8. The same model underpredicts the large yield enhancements observed for leptons from inclusive heavy flavor, dominated by charm quarks, at midrapidity and negative rapidity in Au collisions Adare et al. (2014, 2012a) at the same energy. Heavy flavor yield enhancement at large-, which dominates the negative rapidity yield, is also expected from incoherent multiple scattering of initial gluons Kang et al. (2015a).
Binary scaling of momentum-integrated heavy flavor production was previously observed in electron yields from charm quarks by PHENIX Adare et al. (2011) and reconstructed mesons by STAR Adamczyk et al. (2014) in AuAu collisions at RHIC. The integrated -meson nuclear modification result obtained in this work, when combined with these earlier results, indicate there is binary scaling of - and -mesons separately. Because charm and bottom number are conserved in heavy ion collisions at 200 GeV, the interaction with the QGP medium only alters the momentum distribution of mesons and mesons causing a relative yield suppression for .
VIII Summary and Conclusions.
We report the fraction of -meson decays in the inclusive yield in + and Cu+Au collisions at 200 GeV. The measurement is centrality and integrated with acceptance starting from zero B mesons. The differential cross section obtained from the measured fractions at rapidity in + collisions is consistent with FONLL theoretical calculation within uncertainties Cacciari et al. ; Cacciari et al. (2005). A systematically larger fraction is observed in CuAu collisions than in + collisions, which reflects a smaller nuclear modification of mesons in CuAu collisions compared to prompt . The nuclear modification factor calculated from the CuAu and + fractions, along with the measured inclusive RCuAu, are listed in Table 7 and shown in Fig. 15. The results are consistent with binary scaling of -meson yields. No significant difference is observed between the Cu-going and Au-going direction within the result uncertainties. However, yield enhancement at negative rapidity is favored, which is in agreement with cold-nuclear-matter effects observed for inclusive heavy flavor in Au collisions at the same energy Adare et al. (2014, 2012a), an EPS09-based calculation, and incoherent multiple scattering of initial gluons. This result and others on charm yields indicate that heavy-quark number is conserved in heavy ion collisions at 200 GeV. Interaction with the QGP medium only alters momentum distributions of and mesons. The nuclear modification observed for B mesons contrasts with the strong suppression measured for prompt mesons indicating that final-state effects, where the binding is broken by the medium formed, are dominant for prompt mesons.
ACKNOWLEDGMENTS
We thank the staff of the Collider-Accelerator and Physics Departments at Brookhaven National Laboratory and the staff of the other PHENIX participating institutions for their vital contributions. We acknowledge support from the Office of Nuclear Physics in the Office of Science of the Department of Energy, the National Science Foundation, Abilene Christian University Research Council, Research Foundation of SUNY, and Dean of the College of Arts and Sciences, Vanderbilt University (U.S.A), Ministry of Education, Culture, Sports, Science, and Technology and the Japan Society for the Promotion of Science (Japan), Conselho Nacional de Desenvolvimento Científico e Tecnológico and Fundação de Amparo à Pesquisa do Estado de São Paulo (Brazil), Natural Science Foundation of China (People’s Republic of China), Croatian Science Foundation and Ministry of Science and Education (Croatia), Ministry of Education, Youth and Sports (Czech Republic), Centre National de la Recherche Scientifique, Commissariat à l’Énergie Atomique, and Institut National de Physique Nucléaire et de Physique des Particules (France), Bundesministerium für Bildung und Forschung, Deutscher Akademischer Austausch Dienst, and Alexander von Humboldt Stiftung (Germany), National Science Fund, OTKA, EFOP, and the Ch. Simonyi Fund (Hungary), Department of Atomic Energy and Department of Science and Technology (India), Israel Science Foundation (Israel), Basic Science Research Program through NRF of the Ministry of Education (Korea), Physics Department, Lahore University of Management Sciences (Pakistan), Ministry of Education and Science, Russian Academy of Sciences, Federal Agency of Atomic Energy (Russia), VR and Wallenberg Foundation (Sweden), the U.S. Civilian Research and Development Foundation for the Independent States of the Former Soviet Union, the Hungarian American Enterprise Scholarship Fund, and the US-Israel Binational Science Foundation.
References
- Bjorken (1982) J. D. Bjorken, “Energy Loss of Energetic Partons in Quark-Gluon Plasma: Possible Extinction of High p(t) Jets in Hadron-Hadron Collisions,” (1982), FERMILAB-PUB-82-059-THY, FERMILAB-PUB-82-059-T.
- Dokshitzer and Kharzeev (2001) Yu. L. Dokshitzer and D. E. Kharzeev, “Heavy-quark colorimetry of QCD matter,” Phys. Lett. B 519, 199 (2001).
- Olive et al. (2014) K. A. Olive et al. (Particle Data Group), “Review of Particle Physics,” Chin. Phys. C 38, 090001 (2014).
- (4) R. Aaij et al. (LHCb Collaboration), “Measurements of the meson and baryon lifetimes,” J. High Energy Phys. 04 (2014) 114.
- Norrbin and Sjöstrand (2000) E. Norrbin and T. Sjöstrand, “Production and hadronization of heavy quarks,” Eur. Phys. J. C 17, 137 (2000).
- Vitev et al. (2006) I. Vitev, T. Goldman, M. B. Johnson, and J. W. Qiu, “Open charm tomography of cold nuclear matter,” Phys. Rev. D 74, 054010 (2006).
- Sjostrand et al. (2008) T. Sjostrand, S. Mrenna, and P. Z. Skands, “A Brief Introduction to pythia8.1,” Comput. Phys. Commun. 178, 852 (2008).
- Kang et al. (2013) Z.-B. Kang, I. Vitev, and H. Xing, “Multiple scattering effects on inclusive particle production in the large-x regime,” Phys. Rev. D 88, 054010 (2013).
- Kang et al. (2015a) Z.-B. Kang, I. Vitev, E. Wang, H. Xing, and C. Zhang, “Multiple scattering effects on heavy meson production in collisions at backward rapidity,” Phys. Lett. B 740, 23 (2015a).
- Kang et al. (2015b) Z.-B. Kang, I. Vitev, and H. Xing, “Effects of cold nuclear matter energy loss on inclusive jet production in collisions at energies available at the BNL Relativistic Heavy Ion Collider and the CERN Large Hadron Collider,” Phys. Rev. C 92, 054911 (2015b).
- McLerran and Venugopalan (1994) L. D. McLerran and R. Venugopalan, “Gluon distribution functions for very large nuclei at small transverse momentum,” Phys. Rev. D 49, 3352 (1994).
- (12) K. J. Eskola, H. Paukkunen, and C. A. Salgado, “eps09: A New Generation of NLO and LO Nuclear Parton Distribution Functions,” J. High Energy Phys. 04 (2009) 065.
- (13) I. Helenius, K. J. Eskola, H. Honkanen, and Carlos A. Salgado, “Impact-Parameter Dependent Nuclear Parton Distribution Functions: eps09s and eks98s and Their Applications in Nuclear Hard Processes,” J. High Energy Phys. 07 (2012) 073.
- Adare et al. (2014) A. Adare et al. (PHENIX Collaboration), “Cold-Nuclear-Matter Effects on Heavy-Quark Production at Forward and Backward Rapidity in +Au Collisions at GeV,” Phys. Rev. Lett. 112, 252301 (2014).
- Adare et al. (2012a) A. Adare et al. (PHENIX Collaboration), “Cold nuclear matter effects on heavy-quark production in Au collisions at GeV,” Phys. Rev. Lett. 109, 242301 (2012a).
- Adams et al. (2005) J. Adams et al. (STAR Collaboration), “Open charm yields in +Au collisions at GeV,” Phys. Rev. Lett. 94, 062301 (2005).
- Aidala et al. (2014a) C. Aidala et al. (PHENIX Collaboration), “Nuclear matter effects on production in asymmetric Cu+Au collisions at =200 GeV,” Phys. Rev. C 90, 064908 (2014a).
- Xing et al. (2012) H. Xing, Y. Guo, E. Wang, and Wang. X. N., “Parton energy loss and modified beam quark distribution functions in Drell-Yan process in collisions,” Nucl. Phys. A 879, 77 (2012).
- Aidala et al. (2014b) C. Aidala et al., “The PHENIX Forward Silicon Vertex Detector,” Nucl. Instrum. Methods Phys. Res., Sec. A 755, 44 (2014b).
- Akikawa et al. (2003) H. Akikawa et al., “PHENIX Muon Arms,” Nucl. Instrum. Methods Phys. Res., Sec. A 499, 537 (2003).
- Adler et al. (2007) S. S. Adler et al. (PHENIX Collaboration), “Measurement of Single Muons at Forward Rapidity in Collisions at GeV and Implications for Charm Production,” Phys. Rev. D 76, 092002 (2007).
- Li et al. (2004) Z. Li, H. En’yo, Goto. Y., Radeka. V., W. Chen, D. Elliott, T. Kawabata, M. Togawa, N. Saito, V. Rykov, Tanida. K., and J. Tojo, “Novel silicon stripixel detector for PHENIX Upgrade,” Nucl. Instrum. Methods Phys. Res., Sec. A 518, 300 (2004).
- Ichimiya et al. (2009) R. Ichimiya et al., “Silicon Pixel Detector for the PHENIX experiment at the BNL RHIC,” 4th International Workshop on Semiconductor Pixel Detectors for Particles and Imaging (PIXEL 2008) Batavia, Illinois, September 23-26, 2008, J. Instrum. 4, P05001 (2009).
- Innocente et al. (1991) V. Innocente, M Maire, and E Nagy, “geane: average tracking and error propagation package,” CERN Program Library W5013-E, 0 (1991).
- Wang and Gyulassy (1991) X.-N. Wang and M. Gyulassy, “hijing: A Monte Carlo model for multiple jet production in p p, p A and A A collisions,” Phys. Rev. D 44, 3501 (1991).
- Agostinelli et al. (2003) S. Agostinelli et al., “geant4-a simulation toolkit,” Nucl. Instrum. Methods Phys. Res., Sec. A 506, 250 (2003).
- Lai et al. (2010) H.-L. Lai, M. Guzzi, J. Huston, Z. Li, P. M. Nadolsky, J. Pumplin, and C.-P. Yuan, “New parton distributions for collider physics,” Phys. Rev. D 82, 074024 (2010).
- Adare et al. (2006) A. Adare et al. (PHENIX Collaboration), “Measurement of high- single electrons from heavy-flavor decays in collisions at GeV,” Phys. Rev. Lett. 97, 252002 (2006).
- Adare et al. (2009) A. Adare et al. (PHENIX Collaboration), “Measurement of Bottom versus Charm as a Function of Transverse Momentum with Electron-Hadron Correlations in Collisions at GeV,” Phys. Rev. Lett. 103, 082002 (2009).
- Adare et al. (2012b) A. Adare et al. (PHENIX Collaboration), “Ground and excited charmonium state production in collisions at GeV,” Phys. Rev. D 85, 092004 (2012b).
- (31) M. Cacciari, M. Greco, and P. Nason, “The P(T) spectrum in heavy flavor hadroproduction,” J. High Energy Phys. 05 (1998) 007.
- Cacciari et al. (2005) M. Cacciari, P. Nason, and R. Vogt, “QCD predictions for charm and bottom production at RHIC,” Phys. Rev. Lett. 95, 122001 (2005).
- Frawley et al. (2008) A. D. Frawley, T. Ullrich, and R. Vogt, “Heavy flavor in heavy-ion collisions at RHIC and RHIC II,” Phys. Rept. 462, 125 (2008).
- Nadolsky et al. (2008) P. M. Nadolsky, H.-L. Lai, Q.-H. Cao, J. Huston, J. Pumplin, D. Stump, W.-K. Tung, and C. P. Yuan, “Implications of CTEQ global analysis for collider observables,” Phys. Rev. D 78, 013004 (2008).
- Adare et al. (2011) A. Adare et al. (PHENIX Collaboration), “Heavy Quark Production in and Energy Loss and Flow of Heavy Quarks in Au+Au Collisions at GeV,” Phys. Rev. C 84, 044905 (2011).
- Adamczyk et al. (2014) L. Adamczyk et al. (STAR Collaboration), “Observation of Meson Nuclear Modifications in Au+Au Collisions at GeV,” Phys. Rev. Lett. 113, 142301 (2014).