Rotationally modulated variability and pulsations of the He-rich star CPD 62∘2124 with an extraordinarily strong magnetic field
Abstract
A longitudinal magnetic field with a strength of 5.2 kG was recently detected in CPD 62∘2124, which has a fractional main-sequence lifetime of about 60%. Strongly magnetic early-B type chemically peculiar stars in an advanced evolutionary state are of special interest to understand the evolution of the angular momentum and spin-down timescales in the presence of a global magnetic field. We exploited 17 FORS 2 low-resolution spectropolarimetric observations and 844 ASAS3 photometric measurements for the determination of the rotation period, pulsations, and the magnetic field geometry of the star. We calculated periodograms and applied phenomenological models of photometric, spectral and spectropolarimetric variability. We found that all quantities studied, specifically equivalent widths, the mean longitudinal magnetic field , and the flux in the filter, vary with the same period d, which was identified as the rotation period. The observed variations can be fully explained by a rigidly rotating main-sequence star with an uneven distribution of chemical elements, photometric spots, and a stable, nearly dipolar magnetic field with a polar field strength of about 21 kG, frozen into the body of the star. The magnetic field of CPD 62∘2124 is tilted to the rotation axis by , while the inclination of the rotation axis towards the line of sight is only . In the acquired FORS 2 spectra, we detect short-term line profile variations indicating the presence of Cephei type pulsations. As of today, no other pulsating star of this type is known to possess such a strong magnetic field.
keywords:
stars: early type — stars: individual: CPD 62∘2124 — stars: magnetic field — stars: chemically peculiar — stars: oscillations1 Introduction
The detection of a very strong longitudinal magnetic field of the order of 5.2 kG in the chemically peculiar early-B type star CPD 62∘2124 was previously reported by Castro et al. (2017) who used one spectropolarimetric observation with the High Accuracy Radial velocity Planet Searcher (HARPSpol; Snik et al. 2011) attached to the ESO 3.6m telescope on La Silla and one observation with the FOcal Reducer low dispersion Spectrograph (FORS 2; Appenzeller et al. 1998) mounted on the 8 m Antu telescope of the VLT. Assuming a dipolar magnetic field geometry to estimate the magnetic field strength of about 18.3 kG, Castro et al. (2017) suggested that no other early-B type star is known to host a magnetic field with a comparable strength. The authors also reported that this star exhibits strong, broad H emission that is characteristic of a centrifugal magnetosphere. Moreover, a study of the stellar parameters, using a comparison with stellar evolutionary tracks, indicated that CPD 62∘2124 is largely evolved from the zero-age main sequence with a fractional main-sequence lifetime of about 60%.
Our recent monitoring of this star employing multi-epoch FORS 2 spectropolarimetric observations distributed over about two and a half months revealed that the magnetic field is even stronger than previously anticipated, with a mean longitudinal magnetic field strength , varying from 4.0 to 6.8 kG.
In the following sections, we present the results of our search for rotationally and pulsationally modulated variability of 844 photometric ASAS3 data points, the magnetic field measurements, and the equivalent widths (EWs) of nine lines belonging to six chemical elements.
2 Observations
2.1 ASAS3 photometry
We have used archival data from the ASAS3 survey111http://www.astrouw.edu.pl/asas/, covering the time interval from HJD 2 451 888.793 (2000 December 10) to 2 455 048.516 (2009 August 5). After removing some apparent outliers, we used 844 data points in the band. These measurements were made by the ASAS3 system (Paczyński, 2000), which consists of two wide-field 200/2.8 instruments, one narrow-field 750/3.3 telescope and one super-wide 50/4 scope, each equipped with an Apogee 2K 2K CCD camera, located at Las Campanas Observatory, Chile (since 1997) and on Haleakala, Maui (since 2006).
2.2 Spectropolarimetry
Sixteen FORS 2 spectropolarimetric observations of CPD 62∘2124 were obtained from 2016 March 12 to May 24. The FORS 2 multi-mode instrument is equipped with polarisation analysing optics comprising super-achromatic half-wave and quarter-wave phase retarder plates, and a Wollaston prism with a beam divergence of 22 in standard resolution mode. We used the GRISM 600B and the narrowest available slit width of 04 to obtain a spectral resolving power of . The observed spectral range from 3250 to 6215 Å includes all Balmer lines, apart from H, and numerous helium lines. For the observations, we used a non-standard readout mode with low gain (200kHz,11,low), which provides a broader dynamic range, hence allowing us to reach a higher signal-to-noise ratio (SNR) in the individual spectra. The exposure time for each subexposure accounted for 7 min. A detailed description of the assessment of longitudinal magnetic field measurements using FORS 1/2 spectropolarimetric observations was presented in detail in our previous work (e.g., Hubrig, Schöller & Kholtygin 2014; Hubrig et al. 2017, and references therein).
| MJD | SNR | ||||||
|---|---|---|---|---|---|---|---|
| [G] | [G] | [G] | |||||
| 57099.2449 | 1800 | 4640 | 130 | 4530 | 100 | 10 | 80 |
| 57460.1011 | 1100 | 5600 | 300 | 5510 | 180 | 10 | 150 |
| 57461.0599 | 1300 | 6500 | 300 | 6270 | 160 | 40 | 100 |
| 57462.0660 | 1400 | 3970 | 140 | 3740 | 100 | 20 | 90 |
| 57463.0650 | 1300 | 5600 | 300 | 5700 | 150 | 0 | 120 |
| 57465.2482 | 1400 | 5100 | 200 | 4670 | 180 | 140 | 130 |
| 57474.0863 | 1000 | 6800 | 500 | 5600 | 200 | 40 | 170 |
| 57478.2042 | 1700 | 4470 | 150 | 4120 | 120 | 20 | 90 |
| 57478.2560 | 1700 | 4270 | 180 | 4140 | 120 | 10 | 90 |
| 57478.3208 | 1500 | 4800 | 190 | 4590 | 150 | 150 | 110 |
| 57494.0163 | 1400 | 3940 | 180 | 4140 | 130 | 10 | 100 |
| 57495.0476 | 1200 | 5150 | 250 | 5520 | 140 | 0 | 110 |
| 57500.1136 | 1700 | 5040 | 160 | 5290 | 100 | 60 | 70 |
| 57505.2651 | 1300 | 5050 | 250 | 5480 | 140 | 60 | 110 |
| 57530.1287 | 1300 | 5080 | 200 | 4050 | 250 | 10 | 170 |
| 57531.2140 | 1100 | 5900 | 400 | 5500 | 170 | 250 | 130 |
| 57532.0571 | 1300 | 6650 | 250 | 6180 | 120 | 30 | 90 |
The longitudinal magnetic field was measured in two ways: using the entire spectrum including all available lines, or using exclusively the hydrogen lines. Furthermore, we have carried out Monte Carlo bootstrapping tests (e.g. Hubrig, Schöller & Kholtygin 2014; Hubrig et al. 2015). These are most often applied with the purpose of deriving robust estimates of standard errors. The measurement uncertainties obtained with and without the Monte Carlo bootstrapping tests were found to be in close agreement, indicating the absence of reduction flaws. The results of our magnetic field measurements, those for the entire spectrum and those only for the hydrogen lines are presented in Table 1, where we also include in the first row the information about the previous magnetic field measurement with FORS 2 presented by Castro et al. (2017), who also presented in their work a typical example of the analysis of the FORS 2 data.
| MJD | Equivalent widths | ||||||||
|---|---|---|---|---|---|---|---|---|---|
| H | H | \textHe i 4388 | \textHe i 4471 | \textHe i 4922 | \textC ii 4267 | \textN ii 4631 | \textO ii 4662 | \textSi iii 4553 | |
| [Å] | [Å] | [Å] | [Å] | [Å] | [Å] | [Å] | [Å] | [Å] | |
| 57099.2449 | 3.0456 | 3.3339 | 1.6523 | 2.4379 | 1.4058 | 0.1772 | 0.0766 | 0.0640 | 0.1805 |
| 57460.1011 | 2.5237 | 2.8773 | 1.9360 | 2.7332 | 1.5604 | 0.1550 | 0.0489 | 0.0487 | 0.1511 |
| 57461.0599 | 2.1685 | 2.5917 | 2.1532 | 2.8583 | 1.6600 | 0.1103 | 0.0341 | 0.0399 | 0.1219 |
| 57462.0660 | 3.0769 | 3.4358 | 1.6156 | 2.4379 | 1.3734 | 0.1744 | 0.0636 | 0.0569 | 0.1916 |
| 57463.0650 | 2.0480 | 2.5788 | 2.1665 | 2.8861 | 1.6642 | 0.1172 | 0.0329 | 0.0306 | 0.1255 |
| 57465.2482 | 2.6128 | 3.1209 | 1.8857 | 2.6540 | 1.5343 | 0.1571 | 0.0583 | 0.0596 | 0.1800 |
| 57474.0863 | 2.0102 | 2.5956 | 2.1980 | 2.8318 | 1.6582 | 0.0981 | 0.0478 | 0.0316 | 0.1320 |
| 57478.2042 | 2.9142 | 3.2343 | 1.7594 | 2.5529 | 1.4687 | 0.1593 | 0.0420 | 0.0755 | 0.1919 |
| 57478.2560 | 2.8194 | 3.1810 | 1.7842 | 2.5660 | 1.4848 | 0.1541 | 0.0409 | 0.0709 | 0.1860 |
| 57478.3208 | 2.7317 | 3.1318 | 1.8634 | 2.5681 | 1.5084 | 0.1425 | 0.0489 | 0.0692 | 0.1896 |
| 57494.0163 | 2.8598 | 3.1215 | 1.7442 | 2.5013 | 1.4012 | 0.1634 | 0.0572 | 0.0662 | 0.1853 |
| 57495.0476 | 2.0469 | 2.5635 | 2.2016 | 2.8957 | 1.6833 | 0.1015 | 0.0521 | 0.0468 | 0.1144 |
| 57500.1136 | 2.0258 | 2.5119 | 2.2482 | 2.9045 | 1.7024 | 0.1073 | 0.0288 | 0.0516 | 0.0823 |
| 57505.2651 | 1.9919 | 2.7024 | 2.2178 | 2.8703 | 1.6980 | 0.1083 | 0.0356 | 0.0293 | 0.1067 |
| 57530.1287 | 2.9581 | 3.2974 | 1.6719 | 2.5204 | 1.3991 | 0.1717 | 0.0699 | 0.0734 | 0.1741 |
| 57531.2140 | 2.2194 | 2.7839 | 2.0940 | 2.8458 | 1.6821 | 0.1247 | 0.0422 | 0.0651 | 0.1303 |
| 57532.0571 | 2.1657 | 2.7054 | 2.1139 | 2.8611 | 1.6390 | 0.1123 | 0.0402 | 0.0549 | 0.1230 |
Furthermore, to search for the presence of spectral variability, the FORS 2 Stokes spectra were used to measure the EWs of nine spectral lines: H, H, \textHe i 4388, \textHe i 4471, \textHe i 4922, \textC ii 4267, \textN ii 4631, \textO ii 4662, and \textSi iii 4553. The measurements were carried out using the gravity method and are presented in Table 2.
3 Search for periodic variability
CPD 62∘2124 is classified as a hot magnetic star (Castro et al., 2017), characterized by an enhanced surface abundance of helium, which is usually concentrated in large spots surviving for many decades (Mikulášek, 2016). The surface distribution of some other chemical elements, like silicon or carbon, also displays a spotted structure, which is, as a rule, disjunct from the helium distribution (see e.g. the well-studied He-rich star HD 37776; Khokhlova et al., 2000). The enhanced redistribution of radiative flux from the ultraviolet to the visible region of hot CP stars causes the presence of large bright photometric spots, usually with overabundant silicon, which is the most efficient, having plenty of bound-free transition continua in the ultraviolet (Krtička et al., 2007, 2015).
The global magnetic dipole-like field, tilted to the rotation axis by the angle , frozen in the plasma in the outer layers of the star, is also a long-lived phenomenon firmly bound with the rotating stellar surface. As the star rotates, we should detect variations in the intensity of the longitudinal magnetic field , the spectral line profiles of various elements, and the photometric changes, all periodical with the rotation period of the star.
There are some constraints on the rotation period of CPD 62∘2124, following from the adapted model and based on the observed projected rotation velocity and assumed dimension of the star corresponding to its effective temperature, surface gravity, km s-1, K, and according to Castro et al. (2017). The two competing evolutionary models (differing mostly in the value of the adopted overshooting parameter) of Ekström et al. (2012) and Brott et al. (2011) yielded different estimates for the radius of CPD 62∘2124: R⊙ and R⊙, respectively. For the following considerations, we adopt a compromise: .
The rotation period (in days) follows the relation: d, where is the inclination of the rotation axis and is the radius in R⊙. For the maximum inclination we obtain the maximum period d (see also Castro et al., 2017). Obviously, the rotation period can not be arbitrarily shorter than because we observe apparent, mutually correlated/anticorrelated variations in spectral line intensities. Such variations can be naturally explained by a model of a rotating star with spots with enhanced abundances of some chemical elements, provided that the star is not nearly pole-on.
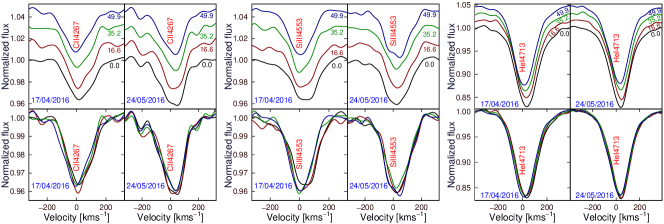
We would also like to note that since CPD 62∘2124 already finished a fractional main-sequence lifetime of about 60% and is already passing the Cep instability strip, the presence of shorter periods of the orders of a couple of hours attributed to stellar pulsations can also be expected in our data. Indeed, in the acquired FORS 2 spectra, along with different radial velocity shifts of lines belonging to different elements, we also detect distinct changes in line profiles taking place on time-scales corresponding to the duration of the sub-exposure sequences for the individual observations. In Fig. 1 we present the behaviour of the line profiles in the individual spectral lines belonging to carbon, silicon, and helium. The time difference between the individual subexposures was between 15 and 19 min.
3.1 Photometric variations
Our period analysis of the moderately faint CPD 62∘2124 ( mag) is based on 844 ASAS3 measurements obtained during nine seasons between 2001 and 2009. After removing some long-term trends, we have found that the relatively small scatter of data of 0.019 mag and the relative homogeneity allow us to search for periodic variations with amplitudes up to 0.008 mag. For the frequency analysis we have used, besides standard tools, also our own periodograms, displaying amplitudes of sinus-like variations in magnitudes and other diagnostic tools, published in Paunzen et al. (2013) and Mikulášek et al. (2015).
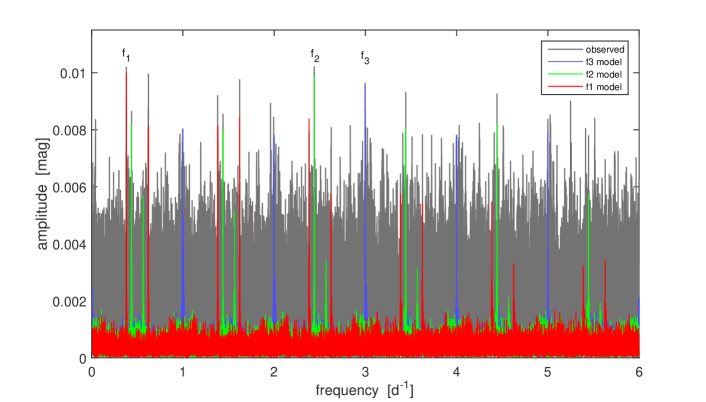
Inspecting the frequency spectrum of CPD 62∘2124 in the ASAS3 data with frequencies below 6 d-1, we revealed three weak, independent (non-aliased), but quite significant peaks at the frequencies , , and , with amplitudes of 0.010 mag (see Fig. 2). The significance of the complete frequency triple is 96.5%. The first period can be attributed to rotation, while the other two are probably pulsational periods.
The light curves plotted for the three respective periods are simple sinusoids and can be modeled by a simple relation:
| (1) |
where is the magnitude predicted for time , and for each of the three components , , , , and are the amplitude, period, HJD of the basic maximum, and the value of the phase function for time . The frequency spectrum showing each component is presented in Fig. 2.
The model frequency spectrum shows that the majority of the other observed significant peaks can be explained as aliases of the three dominant frequency modes. Considering that the maximum amplitude peaks caused by the random scatter have an amplitude of 0.083 mag, we can conclude that the model of photometric variability given by Eq. (1) is quite adequate for the available photometric observations.
3.2 Variations of the equivalent widths of selected spectral lines and of the mean longitudinal magnetic field
Information on the periodic components of the variability of CPD 62∘2124 is also hidden in the spectropolarimetric data extracted from the 17 low-dispersion FORS 2 spectrograms: the EWs of the best unblended lines belonging to the elements H, He, C, N, O, and Si (see Table 2) and the mean longitudinal magnetic field (see Table 1).
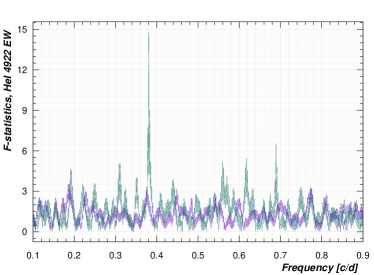
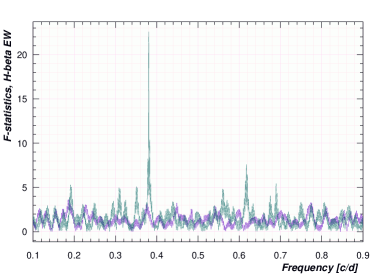
The measured EW values of all nine selected spectral lines and of the mean longitudinal magnetic field exhibit an apparent rotational modulation that one can expect in the case of a He-rich star with chemical spots and a dipole-like magnetic field tilted to the rotation axis by a non-zero angle . It can be well illustrated by the F-statistics frequency spectra (Seber, 1977) obtained for the measurements of EWs of \textHe i 4922 and H (see Fig. 3). The periodograms cover the whole frequency interval restricted for possible rotation frequencies. All periodograms calculated for the EWs and exhibit only the period that coincides with , extracted from the photometry of the star.
A detailed inspection of the relationships between the EWs of the individual lines and the measurements derived from the 17 FORS 2 spectrograms shows that all quantities vary and all variations are strongly mutually correlated or anticorrelated. In particular the intensity of the \textHe i lines and the strength of the mean longitudinal magnetic field vary opposite to the intensity of the \textH i, \textC ii, \textN ii, \textO ii, and \textSi iii lines. Such a behavior can be explained if the center of a spot with enhanced helium abundance is located in the vicinity of the north magnetic pole, while the other elements are more abundant outside of the He spot.
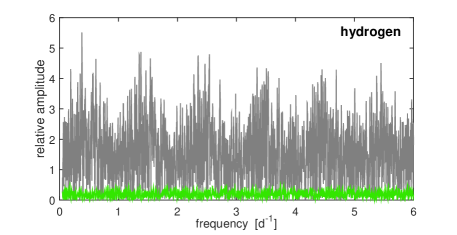
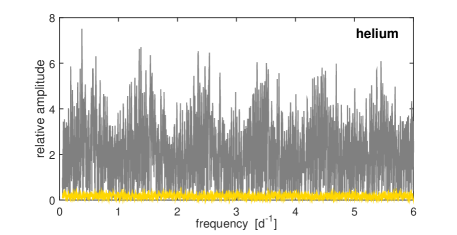
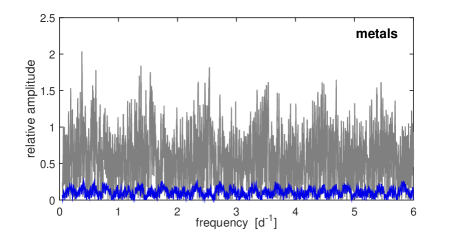
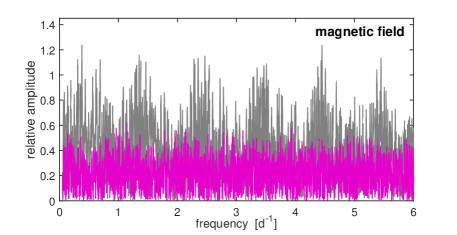
The periodograms spanning the frequency interval from 0 to 6 d-1 displayed in Fig. 4 prove that the observed frequency spectra of the EWs of the \textH i, \textHe i and metal lines, and the measurements can be explained by rotational modulation with one period. The whole forest of peaks are aliases of the basic frequency at d-1. The differences between the observations and the model of rotationally modulated variations plotted in Fig. 4 do not indicate any other periodicity, e.g. the periodicity of the order of hours revealed in the photometry and discussed in Sect. 3.1.
Using the linear ephemeris of the rotational modulation derived from the photometric observations with the parameters and , we can plot the phase curves of the EWs of the lines studied as well as . We found that all phase curves can be well approximated by simple sinusoids with extrema near the phases 0 and 0.5. It appears that the maximum of the light curve coincides with the maxima of the intensity of the H, C, N, O, and Si lines and the minima of the intensities of the He lines and the curves.
We can build a simple phenomenological model of the observed variability derived from the FORS 2 spectra:
| (2) | |||
where is a model prediction of the EW of the th spectral line at the time , is its mean EW, and is the amplitude of its variation. is a model prediction of the value for the case of measurements of all lines , or only the hydrogen lines , is the amplitude of the variations, assuming that the amplitudes of these changes for both type of measurements are the same. is the corresponding phase function, the period of the spectral variations, is the time of helium and minimum and the intensity maximum of the other chemical elements. The spectral model solved by the weighted least square method then leads to the following ephemeris parameters: and .
| Photometry | Spectroscopy and | All data | |
|---|---|---|---|
| Spectropolarimetry | |||
| 2628 07(24) | 2627 60(25) | 2628 09(5) | |
| 2 453 428.40(8) | 2 457 465.173(6) | 2 457 444.146(8) | |
| 0409 879(6) | |||
| 2 453 429.488(12) | |||
| 0333 617(5) | |||
| 2 453 429.777(10) |
The spectroscopically found period is fully compatible with the one derived from photometry, . The prediction of the time of from photometry is 2 457 465.12(4), which is in a satisfactory agreement with our finding that the flux maxima coincide with the maxima of H, C, N, O, and Si. Assuming that and , we can establish a general model of the photometric, spectroscopic and spectropolarimetric variations of CPD 62∘2124 with a solid time basis. Applying this model to the full set of observational data, we found the following ephemeris: , . The periods and ephemerides found from the photometric data are , , , and (see also Table 3).
4 Rotationally modulated variations
4.1 Inclination of the rotation axis
Knowing the rotation period we can also estimate the equatorial velocity and the inclination of the rotation axis of the star . Assuming the radius R⊙ and the projection of the equatorial rotation velocity km s-1, we obtain for the equatorial velocity km s-1, and the rotation axis inclination . CPD 62∘2124 is thus a nearly pole-on star.
4.2 Magnetic field geometry
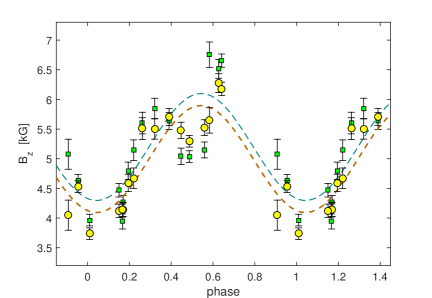
The detailed bootstrapping analysis of the measurements shows that the phase curves derived from the spectropolarimetric measurements of only the hydrogen or all spectral lines can be approximated by the same sinusoid with an amplitude of kG with mean values of kG and kG, respectively (see Fig. 5). The minimum of the mean longitudinal magnetic field takes place at the phase . The extreme values of are kG and kG.
Using the well known relations developed by Stibbs (1950) and Preston (1967) for a centred magnetic dipole tilted to the rotation axis by angle , we find . The uncertainty of this angle is mainly due to the uncertainty in the knowledge of the true radius of the star. Nevertheless, because of , we conclude that the sum is almost independent of the choice of the radius of the star. Assuming a linear limb-darkening coefficient , typical for the effective temperature K (Castro et al., 2017), we can estimate that the dipole strength is 21 kG.
We observe that the phase curve of displays a secondary minimum at phase 0.5, indicating the possibility of a more complex magnetic field with a non-zero quadrupole component (see Fig. 5). We note that complex global magnetic fields are frequent in hot He-rich stars with low age. In any case, the dipole component seems to be dominant in CPD 62∘2124, so that the analysis presented above remains valid.
4.3 Spectral variations
17 low-dispersion FORS 2 polarimetric spectra do not allow to carry out detailed Zeeman Doppler imaging of the distribution of chemical elements on the stellar surface. On the other hand, they can contribute to our understanding of the stellar rotationally modulated variability. Variations in EWs are caused by an inhomogeneous distribution of certain chemical elements on the surface of a rotating star and the behaviour of the EW phase curves is determined by the location of spots with enhanced element abundances and the inclination of the rotation axis . For small inclination angles , we observe only structures near the visible rotation pole and a considerable part of the chemical spots are hardly visible or even invisible. This is why the EW phase curves of nearly pole-on stars show single-waves and are almost symmetrical.
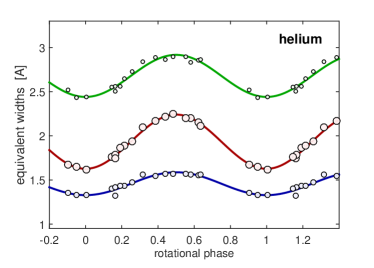
As a rule, the distribution of helium on the surface of He-rich stars is very uneven. The abundance of helium in spots has to be much larger than outside of spots, causing the observed strong variations in the EWs of the helium lines. The phase curves of all three measured lines (\textHe i 4471, 4388, and 4492) display strong, well-defined symmetric variations (see the upper panel in Fig. 6). This is compatible with our concept of the presence of one helium spot on the surface of CPD 62∘2124. The minimum of the EW of the \textHe i spectral lines takes place at the phase .
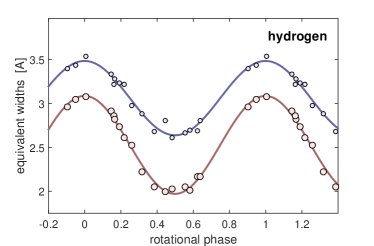
The lower panel in Fig. 6 demonstrates that the EW of the hydrogen Balmer H and H lines vary in antiphase with the \textHe i lines. The maximum of the EW of the \textH i spectral lines takes place at .
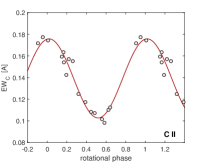
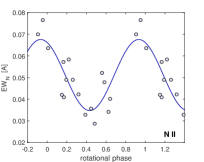
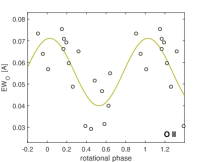
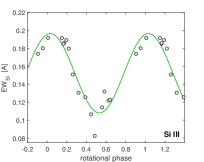
The same can be said about the EWs of the metal lines belonging to \textC ii, \textN ii, \textO ii, and \textSi iii. All phase curves can be well fitted by simple sinusoids with a maximum at phase 0 (see Fig. 7).
4.4 Rotationally modulated flux variation and photometric pulsations
Our frequency analysis of 844 detrended ASAS3 measurements revealed three independent periodicities characterized by their periods . The last two periods of the order of hours can probably be referred to the presence of pulsations, while the first period is very likely the rotation period. Since all amplitudes of the flux variations can be attributed to periodic mechanisms, we consider now the rotational periodicity by removing the other two periodicities.
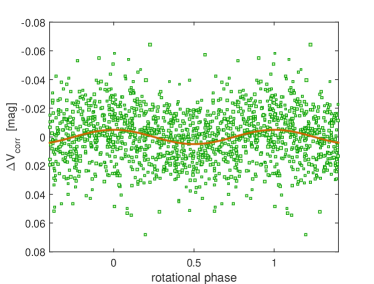
In Fig. 8, the maximum of the light curve appears at phase 0 and the amplitude of the flux phase curve is mag. The variations are caused by the presence of a photometric spot, bright in , whose photocenter passes the meridian at the phase of . Its brightness is very probably the result of a redistribution of radiative energy from the ultraviolet into the visible due to the back-warming process in regions with overabundant elements possessing numerous lines in the ultraviolet. Silicon is the element mainly responsible for flux variability in HD 37776 (Krtička et al., 2007) and other hot CP stars (Krtička et al., 2015).
The relatively small amplitude of the flux variability is due to two causes: a) The contrast of the photometric spot located outside of the helium spot is lowered because also in helium spots the redistribution of energy from ultraviolet to optical regions of the spectrum takes place, but not so efficiently as in e.g. silicon spots, b) the photometric spot tracks during the rotational cycle within the central part of the visible hemisphere of the star, so that its projection change is small.
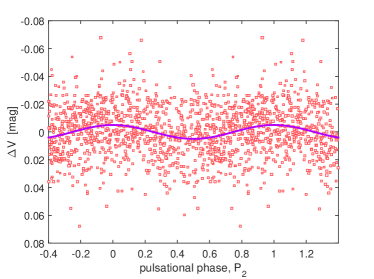
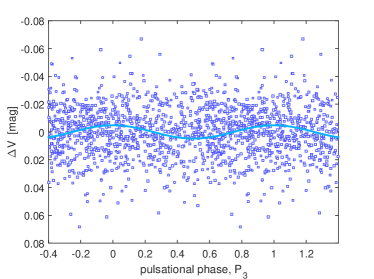
The photometry of CPD 62∘2124 reveals two other frequencies higher than 1 d-1, which we can probably attribute to its pulsations. The light curves of the proposed pulsations are sinusoids with relatively small amplitudes of 0.01 mag (see Fig. 9). The pulsations are apparent only in the photometric frequency spectrum. Based on the FORS 2 observations it seems that they can have an impact on the line profile shapes. However, they do neither significantly influence the intensities of the spectral lines, nor the global magnetic field.
5 Evolutionary state
To better understand the evolutionary status of CPD 62∘2124, we also exploited currently available astrometric data. Dias et al. (2014) investigated stars in open cluster areas using proper motions from the fourth US Naval Observatory CCD Astrograph Catalog (UCAC4; Zacharias et al. 2013) and found a 98% membership probability for CPD 62∘2124 being a member of the open cluster IC 2944. However, they gave an angular distance to the cluster centre of 19.4′. This is larger than the cluster radius of 14.4′, determined in the cluster survey of Kharchenko et al. (2005), based on Hipparcos and Tycho-2 (ESA, 1997; Høg et al., 2000) proper motions and optical photometry, and of 12′ in the more recent survey of Kharchenko et al. (2013), based on proper motions from the PPMXL catalogue (Röser, Demleitner & Schilbach, 2010) and near-infrared photometry from the Two Micron All Sky Survey (2MASS; Skrutskie et al. 2006). The most accurate new proper motion measurements of CPD 62∘2124 involving Gaia DR1 data (Gaia Collaboration et al., 2016a, b; Lindegren et al., 2016) in the Hot Stuff for One Year (HSOY; Altmann et al. 2017) and UCAC5 (Zacharias, Finch & Frouard, 2017) catalogues yield (, ) of (7.71.1, 2.01.1) mas/yr and (7.31.0, 0.21.0) mas/yr, respectively.
There seems to be a good agreement (especially of the UCAC5 values) with the mean IC 2944 proper motion of (6.20.9, 1.20.9) mas/yr from Kharchenko et al. (2005) and (7.00.9, 1.10.9) mas/yr from Kharchenko et al. (2013). However, there is a second cluster, vdBergh-Hagen 121, with an only slightly different proper motion of (5.10.5, 1.10.6) mas/yr and (5.90.8, 0.50.8) mas/yr listed in the latter two catalogues, respectively. The angular distance of CPD 62∘2124 to the cluster vdBergh-Hagen 121 is again larger than the cluster radius, but a bit smaller (17.2′) than to the cluster IC 2944. Because of the large angular distances from both cluster centres, Kharchenko et al. (2013) considered CPD 62∘2124 as a spatial non-member in these two clusters, but its membership probabilities from proper motion, , and photometry are higher with respect to IC 2944 (36%, 100%, 100%) than to vdBergh-Hagen 121 (17%, 37%, 100%).
The question, whether CPD 62∘2124 belongs to a star cluster (and to which one), can probably be answered only when Gaia DR2 data will become available in 2018 April. So far, we can only speculate on this issue, mainly because of the large angular distance of the star to its potential birth clusters. As open clusters dissolve after their formation, one can further speculate on the possible status of CPD 62∘2124 as a former cluster member, which represents the oldest generation of stars that formed in the cluster. An interesting new result from an investigation of nearby (450 pc) open clusters in the data of the Tycho-Gaia Astrometric Solution (TGAS) of Gaia DR1 (Gaia Collaboration et al., 2017) is that (bound or escaped) members of those clusters were found at up to 15 pc from their cluster centres. At the distances of 2–3 kpc estimated for IC 2944 and vdBergh-Hagen 121 (Kharchenko et al., 2005, 2013), this corresponds to 17-25′, very similar to the observed angular separations of CPD 62∘2124 from these two clusters.
6 Discussion
We exploited low-resolution spectropolarimetric observations taken by FORS 2 and 844 ASAS3 photometric measurements for the determination of the rotation period, pulsations, and the magnetic field geometry of CPD 62∘2124. For the analysis of the available data, we applied periodograms and phenomenological models of flux, spectral and spectropolarimetric variability. Line intensities belonging to several elements, the mean longitudinal magnetic field , and flux in the filter, were found to vary with the same period d, which was identified as the rotation period. The magnetic field of CPD 62∘2124 is dominated by a dipolar component of 21 kG, tilted to the rotation axis by the angle , while the inclination of the rotation axis is only . Such an extraordinarily strong magnetic field has never been detected in any massive early-B type star. The analysis of the ASAS3 photometric measurements reveals, apart from the rotational flux modulation, also the presence of two additional periodicities of 0.409 879(6) d and 0.333 617(5) d, which are most probably caused by pulsational variability. We note that these two periods appear rather unusually long for a Cephei type pulsation. It would be worthwhile to obtain extensive spectroscopic time series to investigate the pulsational characteristics of this star in more detail. The classification of CPD 62∘2124 as a pulsating He-rich star with a measured huge magnetic field would place it also as a record holder among all magnetic upper-main sequence pulsating Cep and slowly pulsating B (SPB) stars, which usually exhibit much lower magnetic field strengths (e.g., Hubrig et al., 2006, 2009).
Remarkably, this strongly magnetic star, although being in an advanced evolutionary state and having finished approximately 60% of its main-sequence life, rotates rather fast with of about 100 km s-1 and has a rather short rotation period of 2.628 d. It is of interest that while for the majority of the magnetic Ap and Bp stars it is expected that magnetic braking slows stellar rotation (e.g., Mathys, 2004), the study of a representative sample of this type of stars with strong magnetic fields by Hubrig, North & Mathys (2000) did not show any correlations between the rotation period and the fraction of the main-sequence lifetime completed. Clearly, strongly magnetic early-B type stars in an advanced evolutionary state are of special interest for our understanding of the evolution of the angular momentum and of spindown timescales in the presence of a magnetic field.
Our study of the spectral variability shows the presence of significant chemical abundance variations across the stellar photosphere with the helium abundance decreasing towards the longitudinal magnetic field minimum and an increase of the abundances of other elements at the same phase. Future high-resolution high signal-to-noise spectropolarimetric observations will be worthwhile to determine the surface distribution of the different elements. Since the discovered pulsational variability is most likely caused by Cep-like pulsations, a detailed seismic study of CPD 62∘2124 will be of great importance to constrain the physical processes in magnetic stars and to test the impact of the magnetic field on the internal mixing processes. As this star is rather bright and has a relatively low projected rotation velocity, it appears to be an excellent candidate also for future high-resolution polarimetric analyses to investigate various atmospheric effects that interact with a strong magnetic field.
Acknowledgments
We thank the anonymous referee for the constructive comments. Further, we acknowledge a fruitful discussion with J. Krtička. Based on observations made with ESO Telescopes at the La Silla Paranal Observatory under programmes 097.D-0428(A) and 191.D-0255(G). AK acknowledges financial support from the RFBR grant 16-02-00604A. ZM and MZ acknowledge support from the GAČR 16-01116S project.
References
- Altmann et al. (2017) Altmann M., Röser S., Demleitner M., Bastian U., Schilbach E., 2017, A&A, 600, L4
- Appenzeller et al. (1998) Appenzeller I., et al., 1998, The ESO Messenger, 94, 1
- Brott et al. (2011) Brott I., et al., 2011, A&A, 530, A115
- Castro et al. (2017) Castro N., et al. 2017, A&A, 597, L6
- Dias et al. (2014) Dias W. S., Monteiro H., Caetano T. C., Lépine J. R. D., Assafin M., Oliveira A. F., 2014, A&A, 564, A79
- Ekström et al. (2012) Ekström S., et al., 2012, A&A, 537, A146
- ESA (1997) ESA, 1997, The HIPPARCOS and Tycho catalogues, ESA-SP 1200
- Gaia Collaboration et al. (2016a) Gaia Collaboration, et al., 2016a, A&A, 595, A1
- Gaia Collaboration et al. (2016b) Gaia Collaboration, et al., 2016b, A&A, 595, A2
- Gaia Collaboration et al. (2017) Gaia Collaboration, et al., 2017, A&A, accepted, also arXiv:1703.01131
- Høg et al. (2000) Høg E., et al., 2000, A&A, 355, L27
- Hubrig, North & Mathys (2000) Hubrig S., North P., Mathys G., 2000, ApJ, 539, 352
- Hubrig et al. (2006) Hubrig S., Briquet M., Schöller M., De Cat P., Mathys G., Aerts C., 2006, MNRAS, 369, L61
- Hubrig et al. (2009) Hubrig S., Briquet M., De Cat P., Schöller M., Morel T., Ilyin I., 2009, AN, 330, 317
- Hubrig, Schöller & Kholtygin (2014) Hubrig S., Schöller M., Kholtygin A. F., 2014, MNRAS, 440, 1779
- Hubrig et al. (2015) Hubrig S., et al., 2015, A&A, 578, L3
- Hubrig et al. (2017) Hubrig S., Kholtygin A. F., Schöller M., Ilyin I., 2017, MNRAS, 467, L81
- Kharchenko et al. (2005) Kharchenko N. V., Piskunov A. E., Röser S., Schilbach E., Scholz R.-D., 2005, A&A, 438, 1163
- Kharchenko et al. (2013) Kharchenko N. V., Piskunov A. E., Schilbach E., Röser S., Scholz R.-D., 2013, A&A, 558, A53
- Khokhlova et al. (2000) Khokhlova V. L., Vasilchenko D. V., Stepanov V. V., Romanyuk I. I., 2000, Astronomy Letters, 26, 177
- Krtička et al. (2007) Krtička J., Mikulášek Z., Zverko J., Žižňovský J., 2007, A&A, 470, 1089
- Krtička et al. (2015) Krtička J., Mikulášek Z., Lüftinger T., Jagelka M., 2015, A&A, 576, A82
- Lindegren et al. (2016) Lindegren L., et al., 2016, A&A, 595, A4
- Mathys (2004) Mathys G., 2004, Proc. of IAU Symp. 215, p. 270
- Mikulášek et al. (2015) Mikulášek Z., Paunzen E., Netopil M., Zejda M., 2015, in Physics and Evolution of Magnetic and Related Stars, ASP Conf. Ser., 494, 320
- Mikulášek (2016) Mikulášek Z., 2016, Contr. Astron. Obs. Sk. Pleso, 46, 95
- Paczyński (2000) Paczyński B., 2000, PASP, 112, 1281
- Paunzen et al. (2013) Paunzen E., Mikulášek Z., Poleski R., Krtička J., Netopil M., Zejda, M., 2013, A&A, 556, A12
- Preston (1967) Preston G. W., 1967, ApJ, 150, 547
- Röser, Demleitner & Schilbach (2010) Röser S., Demleitner M., Schilbach E., 2010, AJ, 139, 2440
- Seber (1977) Seber G. A. F., 1977, Linear Regression Analysis (New York: Wiley)
- Skrutskie et al. (2006) Skrutskie M. F., et al., 2006, AJ, 131, 1163
- Snik et al. (2011) Snik F., et al. 2011, in Solar Polarization 6, ASP Conf. Ser., 437, 237
- Stibbs (1950) Stibbs D. W. N., 1950, MNRAS, 110, 395
- Zacharias et al. (2013) Zacharias N., Finch C. T., Girard T. M., Henden A., Bartlett J. L., Monet D. G., Zacharias M. I., 2013, AJ, 145, 44
- Zacharias, Finch & Frouard (2017) Zacharias N., Finch C., Frouard J., 2017, AJ, 153, 166