Strong magnetic frustration in Y3Cu9(OH)19Cl8: a distorted kagome antiferromagnet
Abstract
We present the crystal structure and magnetic properties of Y3Cu9(OH)19Cl8, a stoichiometric frustrated quantum spin system with slightly distorted kagome layers. Single crystals of Y3Cu9(OH)19Cl8 were grown under hydrothermal conditions. The structure was determined from single crystal X-ray diffraction and confirmed by neutron powder diffraction. The observed structure reveals two different Cu-positions leading to a slightly distored kagome layer in contrast to the closely related YCu3(OH)6Cl3. Curie-Weiss behavior at high-temperatures with a Weiss-temperature of the order of , shows a large dominant antiferromagnetic coupling within the kagome planes. Specific-heat and magnetization measurements on single crystals reveal an antiferromagnetic transition at T K indicating a pronounced frustration parameter of . Optical transmission experiments on powder samples and single crystals confirm the structural findings. Specific-heat measurements on YCu3(OH)6Cl3 down to 0.4 K confirm the proposed quantum spin-liquid state of that system. Therefore, the two Y-Cu-OH-Cl compounds present a unique setting to investigate closely related structures with a spin-liquid state and a strongly frustrated AFM ordered state, by slightly releasing the frustration in a kagome lattice.
I Introduction
Quantum spin systems with Cu2+ ions are suitable materials to study quantum many-body effects under variable conditions. Prominent examples are low-dimensional materials with strong magnetic frustrations. In these systems, a quantum spin-liquid state can be realized at low temperatures which is a highly correlated state that has no static magnetic order, despite sizeable magnetic interactions Balens(2010) . Compounds with decoupled antiferromagnetic kagome layers are prototypical systems to search for an experimental realization of the quantum spin-liquid state and Herbertsmithite, ZnCu3(OH)6Cl2, has become one of the most prominent materials in recent years Shores(2005) ; Mendels(2007) ; Han(2012) ; Helton(2007) .
The dominant magnetic interaction in Herbertsmithite is caused by Cu-O-Cu antiferromagnetic superexchange with an exchange energy of J 17 meV, but no magnetic long-range order has been observed down to T = 50 mK Helton(2007) . Therefore, the spin-liquid ground-state of this material could be investigated in great detail (see e.g. a recent review in Norman(2016) ). One structural drawback of Herbertsmithite is the intrinsic Zn-Cu-antisite disorder, which makes it challenging to achieve a structurally perfect ZnCu3(OH)6Cl2 crystal. Furthermore, the amount of antisite disorder is difficult to quantify with X-ray scattering techniques Norman(2016) ; Freedman(2010) . Several structural variants including polymorphism with varying intersite Cu-M mixing are common features of Cu-based kagome compounds such as: Herbertsmithite - Kapellasite Helton(2007) ; Krause(2006) , Mg-Herbertsmithite - Haydeaite Chu(2011) , Volborthite - Vesignieit Ishikawa(2012) ; Boldrin(2016) , Francisite Prishchenko(2016) and Centennialite Sun(2016)-1 . From this point of view, novel kagome systems with highly ordered crystal structures are essential to uncover the intrinsic properties of the kagome antiferromagnet. In addition, the frontier of Herbertsmithite is chemical doping Norman(2016) since Mazin et al. have proposed that a correlated Dirac metal can be found in electron-doped Herbertsmithite which might be realized by replacing Zn by a threevalent ion Mazin(2014) .
Recently, W. Sun et al. reported on a non-hydrothermal synthesis of YCu3(OH)6Cl3 with LiOH and LiCl as pH regulating additives Sun(2016) , enclosed in an autoclave to trap the crystal water. The reported structure is Pm1 with one crystallographic copper position revealing a perfect two-dimensional kagome lattice. The determined crystal structure is more reminiscent to what was found in Kapellasite, a structural polymorph of Herbertsmithite Colman(2008) . They also show with Rietveld refinement of X-ray diffraction (XRD) data and nuclear magnetic resonance (NMR) that there is no significant Y - Cu exchange. In magnetic measurements on polycrystalline samples with small amounts of impurity phases Sun et al. see no magnetic order down to 2 K. The authors report that the absence of free water in the starting mixtures has been proven to be a key factor in the formation (and preservation) of this structural variant.
Here, we report on a different synthesis procedure in the Y-Cu-OH-Cl system and we obtain single crystals of Y3Cu9(OH)19Cl8 from the hydrothermal method. For Y3Cu9(OH)19Cl8, we find R as the resulting structure with two distinct copper positions and two fully occupied yttrium positions. As a consequence Y3Cu9(OH)19Cl8 presents the stoichiometric case of a slightly distorted kagome system, leading to the stabilization of magnetic order at TK but a large portion of the spin degrees of freedom remain fluctuating. Therefore, Y3Cu9(OH)19Cl8 and YCu3(OH)6Cl3 are ideal systems to investigate the change of a spin-liquid state to a strongly frustrated AFM ordered state, by slightly releasing the frustration in a kagome lattice.
II Experimental
II.1 Synthesis
Single crystals of Y3Cu9(OH)19Cl8 were prepared in a hydrothermal Parr 4625 autoclave with a 575 ml filling capacity operated by a Parr 4842 power supply including a 982 Watlow controller. The crystals have blue to green colour and a hexagonal shape, typical sizes are up to 1 x 1 x 0.25 mm3. For the crystallization, we placed duran glass ampoules filled with the solution in the autoclave and filled it with distilled water to ensure the same pressure as in the ampoules. The ampoules were loaded with 0.59 g Y2O3, 0.82 g CuO, 0.89 g CuCl (H2O) and 10 ml distilled water and then sealed at air. The autoclave was heated up to 270°C in four hours and subsequently cooled down to 260°C with 0.05 K/h, followed by a fast cooling to room temperature. Afterwards, the ampoules were opened and the content was filtered with distilled water. Unlike in the synthesis of the similar compounds (Herbertsmithite, MgCu3(OH)6Cl2 Mg-Herbertsmithite Colman(2011) , and CdCu3(OH)6Cl2 MCQueen(2011) ) there is no need to use excess Y in the growth, since the Y2O3 can easily be solved in chloridic solutions Meyer (1989) . Attempts with an excess of YCl3 in the solution in fact lead to a formation of Y(OH)3. In addition, only the stoichiometry of YxCu4-x(OH)6.33Cl2.77 forms and we have not observed any phase with a -value below 1, in contrast to the other compounds of this family.
Furthermore to compare the magnetic ground state of the two structural variants, we have reproduced the synthesis of polycrystalline YCu3(OH)6Cl3 with the flux method from Ref. Sun(2016) , where Y(NO3)H2O melts at 50°C, starting to form complexes Melnikov(2013) . We analysed the obtained powder with laser ablation - inductively coupled plasma - mass spectrometry (LA-ICP-MS). We found only a few ppm of Lithium and could therefore exclude lithium incorporation in YCu3(OH)6Cl3.
II.2 Characterization
For the single crystal structure determination the data were collected at 173 K on a STOE IPDS II two-circle diffractometer with a Genix Microfocus tube with mirror optics using Mo Kα radiation (). The data were scaled using the frame scaling procedure in the X-AREA program system Stoe(2002) . The structure was solved by direct methods using the program SHELXS Sheldrick(2008) and refined against with full-matrix least-squares techniques using the program SHELXL-97 Sheldrick(2008) . The H atoms bonded to O2, O3, and O4 were found in a difference map and were isotropically refined with the O-H distance restrained to 0.84(1)Å, whereas the H1 atom bonded to O1 was geometrically positioned and refined using a riding model. The crystal was twinned about (-1 0 0/1 1 0/0 0 -1) with a fractional contribution of 0.601(4) for the major domain. The space group R was chosen, because the structure proved to be centrosymmetric (thus R3 could be excluded) and no hints for any mirror planes were detected (excluding space groups R3m and Rm). We measured neutron powder diffraction at the high-resolution powder neutron diffractometer HRPT Fischer(2000) , at the Paul Scherrer Institute in Villigen. An amount of g of Y3Cu9(OH)19Cl8 was enclosed into a vanadium can with an inner diameter of 6 mm and the measurement was carried out at room temperature with a wavelength of . The Rietveld refinement, of the neutron data, accomplishing the crystal structure was done using the fullprof suite Rodriguez(1993) . Low-temperature diffraction data were collected with a Siemens D-500 diffractometer with Cu Kα radiation (), here, the sample was placed on a Cu-sample holder in a Lakeshore M-22 closed cycle refridgerator.
For the optical characterization a Bruker Fourier-transform infrared spectrometer and a Woollam spectroscopic ellipsometer have been utilized. Optical transmission experiments in the mid-infrared range were performed with KBr powder pellets whereas thin flakes were used in the visible/UV range. The discussed features were also observed in single-crystalline samples of different thickness ( µm) proving them as bulk properties.
The specific-heat data and magnetic measurements were collected with the standard options of a Physical Property Measurement System from Quantum Design in a temperature range of 0.4 to 300 K.
III results and discussion
III.1 Crystal structure
| Wyck. | x/a | y/b | z/c | U [] | |
| Cu1 | 18f | 0.66311(6) | 0.82526(6) | 0.50349(3) | 0.00721(19) |
| Cu2 | 9d | 0.5 | 1 | 0.5 | 0.0072(2) |
| Y1 | 6c | 0.3333 | 0.6667 | 0.53850(4) | 0.0075(2) |
| Y2 | 3b | 1 | 1 | 0.5 | 0.0092(3) |
| Cl1 | 18f | 0.66466(12) | 1.00242(12) | 0.61719(6) | 0.0132(3) |
| Cl2 | 6c | 1 | 1 | 0.33854(11) | 0.0121(4) |
| O1 | 3a | 0.3333 | 0.6667 | 0.6667 | 0.042(3) |
| H1 | 18f | 0.404 | 0.7382 | 0.6561 | 0.063 |
| O2 | 18f | 0.8113(4) | 0.8026(4) | 0.54394(18) | 0.0079(7) |
| H2 | 18f | 0.813(6) | 0.801(7) | 0.5927(7) | 0.012 |
| O3 | 18f | 0.5308(4) | 0.6623(5) | 0.55719(18) | 0.0086(6) |
| H3 | 18f | 0.555(6) | 0.654(7) | 0.6018(15) | 0.013 |
| O4 | 18f | 0.5089(4) | 0.8403(4) | 0.46536(18) | 0.0070(6) |
| H4 | 18f | 0.492(6) | 0.818(6) | 0.4185(11) | 0.011 |
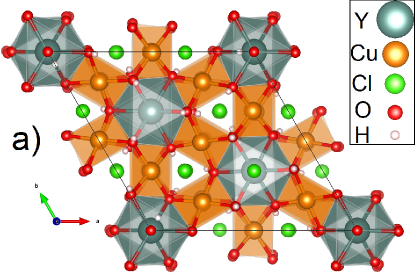
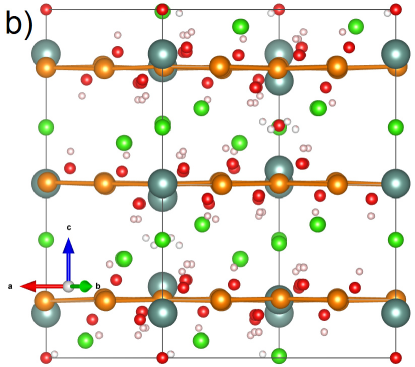
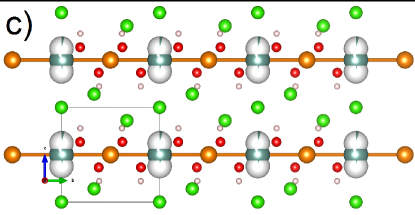
The crystal structure of Y3Cu9(OH)19Cl8 is different from the theoretically proposed structure for electron-doped Herbertsmithite Mazin(2014) as well as the structure reported by Sun(2016) . The additional electron from yttrium is bound with additional Cl-/ OH- anions, so electron doping of Herbertsmithite was not successful in this structure. In agreement with Ref. Guterding(2016) , the Y-atoms are not incorporated into the interlayer site but in the kagome layer. Thus, Y3Cu9(OH)19Cl8 consists of repeating kagome layers. The distances between the Cu atoms are 3.2498 Å/3.3683 Å/3.3762 Å within the layer and 5.8607 Å/ 5.6788Å between the layers. In comparison, Herbertsmithite has Cu distances of 3.416 Å and 5.087 Å Freedman(2010) . In Figure 1, the obtained crystal structure of Y3Cu9(OH)19Cl8 is shown. A comparison of the two similar structures can be made from Figure 1 b) and c). In contrast to Y3Cu9(OH)19Cl83, the Pm1 structure has a partial disorder, for the two inequivalent Y positions, displayed as white parts of the sphere. The full occupancy of these two crystallographic Y positions in Y3Cu9(OH)19Cl8 causes the Cu-atoms to be slightly misaligned from a perfect plane. W. Sun et al. observed an increasing occupation of these disordered yttrium-atoms with decreasing temperature showing a tendency to the R structure when lowering the temperatureSun(2016) .
A refinement plot based on the neutron powder diffraction data, at room temperature taken on 1 g of Y3Cu9(OH)19Cl8 is shown in Figure 2. The structure concept was obtained by the above described single crystal X-ray data and the refinement of the neutron data confirmed that structure solution. A small amount of unreacted CuO and Cu2(OH)3Cl was observed in the large powder sample which formed due to the off-stoichiometric synthesis conditions. The unaccounted reflex part at 37° can also be accounted to some impurity phase.
It should be noted, that neutron scattering lengths of Y and Cu are in fact very close to each other: 7.75 and 7.718 fm, which makes them practically indistinguishable in neutron refinements. We therefore concluded the stoichiometric ordering without sizeable Y-Cu site exchange from the single-crystal X-ray refinement. There, the scattering cross sections for Y () and Cu () are sufficiently different.
| Wyck. | x/a | y/b | z/c | U [] | |
| Cu1 | 18f | 0.6662(6) | 0.8286(7) | 0.5036(3) | 0.0121(4) |
| Cu2 | 9d | 0.5 | 1 | 0.5 | 0.0121(4) |
| Y1 | 6c | 0.3333 | 0.6667 | 0.5393(3) | 0.0074(9) |
| Y2 | 3b | 1 | 1 | 0.5 | 0.0074(9) |
| Cl1 | 18f | 0.6636(7) | 0.9959(7) | 0.61849(17) | 0.0220(5) |
| Cl2 | 6c | 1 | 1 | 0.3379(5) | 0.0220(5) |
| O1 | 3a | 0.33333 | 0.66667 | 0.66667 | 0.022(3) |
| H1 | 18f | 0.404 | 0.7382 | 0.66667 | 0.0296(15) |
| O2 | 18f | 0.8092(8) | 0.8023(8) | 0.5435(3) | 0.0119(4) |
| H2 | 18f | 0.7874(15) | 0.8040(13) | 0.5946(8) | 0.0296(15) |
| O3 | 18f | 0.5295(8) | 0.6618(12) | 0.5578(3) | 0.0119(4) |
| H3 | 18f | 0.5625(16) | 0.668(2) | 0.6099(6) | 0.0296(15) |
| O4 | 18f | 0.5091(8) | 0.8421(8) | 0.4642(3) | 0.0119(4) |
| H4 | 18f | 0.5024(17) | 0.8255(16) | 0.4076(7) | 0.0296(15) |
We have used X-ray diffraction to prove the ideal cation order of the Y and Cu, and neutron diffraction to identify and precisely refine the positions of the hydrogen atoms in the structure, since the scattering contrast of hydrogen is sufficiently high in neutron diffraction (scattering length is negative, 3.739 fm, as opposed to +7.75, +7.718, +5.803, and +9.577 fm for Y, Cu, O, and Cl, correspondingly), which allowed for a refinement of the atomic positions of hydrogen in the structure. Using a sample produced with chemicals containing natural hydrogen (and not deuterium, as usually done for a neutron diffraction study) did of course condition a rather high background of incoherent scattering in the pattern, thus a longer acquisition time was needed to achieve sufficient statistics for a reliable refinement. We note that using a third Cl place instead of the proposed O1 and H1 places would lead to the stoichiometry YCu3(OH)6Cl3 similar to the structure of Ref. Sun(2016) . Neutron refinement indicates the absence of the H1 atom, thus only fully occupied O1, the result was not taken into account due to charge balance.
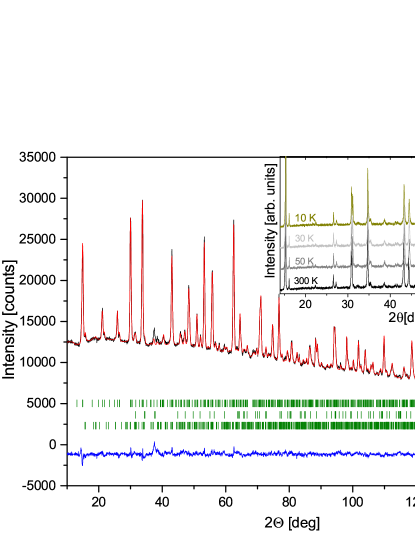
The phase stability at various temperatures was investigated using powder X-ray diffraction (PXRD) data at 10 K - 300 K in 20 K steps. The inset in Fig. 2 reveals that no structural phase transition could be resolved down to 10 K.
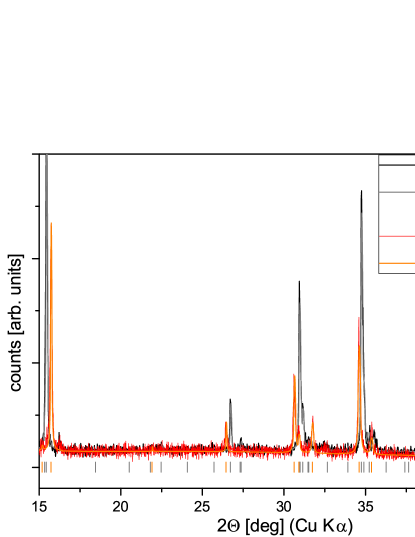
The two structure types are further compared in Fig. 3, where we present PXRD data of the two Y-Cu-OH-Cl compounds. For that we have reproduced the synthesis method of Ref. Sun(2016) . From Fig. 3 it is obvious, that a discrimination between the two compounds can be easily done using PXRD.
III.2 Optical measurements
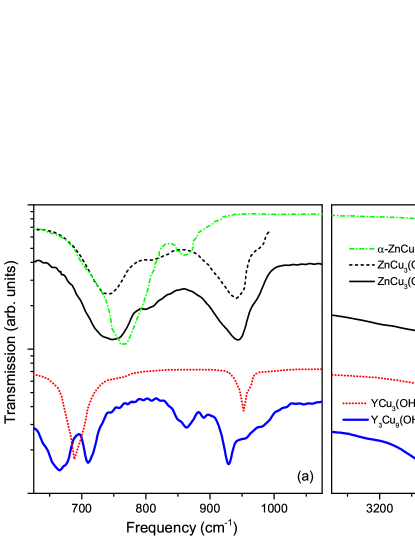
As these materials are insulators, the electrodynamic response in the mid-infrared range is dominated by phonons. Following the assignment of previous studies, the features around 700 - 1000 and 3200 - 3500 cm-1 are related to CuO-H deformations in the Kagome layer and O-H stretching vibrations, respectively Braithwaite(2004) ; Sushkov(2016) . In Fig. 4, we plot the optical transmission spectra for the related Kagome-lattice compounds YCu3(OH)6Cl3 (from Ref. Sun(2016) ), Y3Cu9(OH)19Cl8, α-ZnCu3(OH)6Cl2 (Kapellasite, Ref. Krause(2006) ) and ZnCu3(OH)6Cl2 (Herbertsmithite, our study and Ref. Braithwaite(2004) ). There are striking differences between the two ZnCu3(OH)6Cl2 polymorphs, such as the absence (or strong softening) of the 940 cm-1 mode in Kapellasite, which reflects the structural differences like bond lengths and angles. Similarly, we clearly observe severe discrepancies between YCu3(OH)6Cl3 from Ref. Sun(2016) and Y3Cu9(OH)19Cl8: Comparing the two we find a shift and splitting of the modes around 928 cm-1 and 700 cm-1, respectively, as well as additional peaks at 860 cm-1 and 3280 cm-1 , confirming the structural differences in these compounds, which is consistent with the discussed structure details.
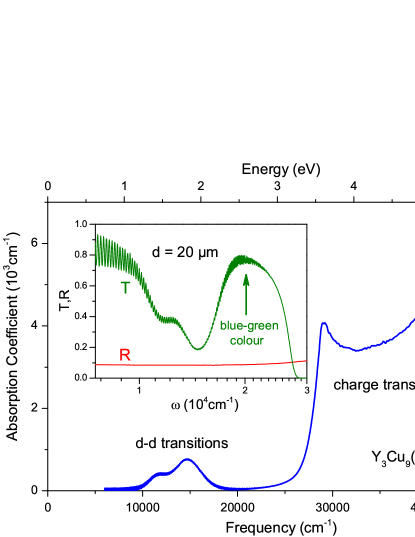
In addition, we have performed optical transmission experiments on thin single crystals to study the electronic excitations in the visible and ultraviolet spectral ranges. The absorption spectrum shown in Fig. 5 reveals the crystal field splitting of Cu -orbitals due to Jahn-Teller distortions in the visible and the charge-transfer band with a van-Hove like peak at 29 100 cm-1 (3.6 eV) in the UV. The d-d transitions have maxima at 11 500 and 14 700 cm-1 which is in the typical range of copper-oxides Hwu(2002) ; Sala(2011) . The blue-green colour of the crystals stems from the transmission maximum at 20 000 cm-1. From our optical experiments at lower frequencies we found no indication of the Dirac bands Mazin(2014) . This agrees with the stoichiometry as the excess charge of the Y3+ cations is balanced by Cl-/OH- anions and the kagome layer is actually not doped.
III.3 Magnetic susceptibility and specific heat
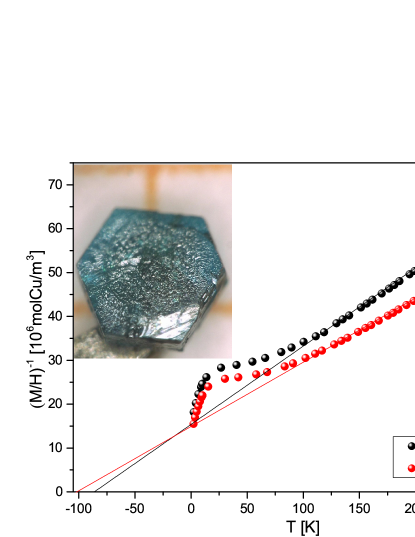
In Fig. 6, we present the inverse susceptibility of Y3Cu9(OH)19Cl8 measured on a single crystal for two different directions of the magnetic field. In the temperature range 100-300 K, a clear Curie-Weiss behaviour is observed with a large negative Weiss temperature of for fields perpendicular to the kagome plane indicating a strongly antiferromagnetic mean-exchange field. The effective moment for a magnetic field applied perpendicular to the kagome plane is resulting in a Landé factor of , assuming a simple coupling system, typical for Cu2+. For fields in the kagome plane, the Curie-Weiss fit yields: , and . The leading exchange coupling is most likely within the kagome plane, as the interplane-Cu-Cu distances are much longer compared to the inplane distances. The Weiss temperatures of Y3Cu9(OH)19Cl8 are quite similar to the results of W. Sun et al. for magnetic measurements on powders of YCu3(OH)6Cl3 with Sun(2016) indicating, that the leading exchange couplings in the two Y-Cu-OH-Cl kagome systems are rather similar.
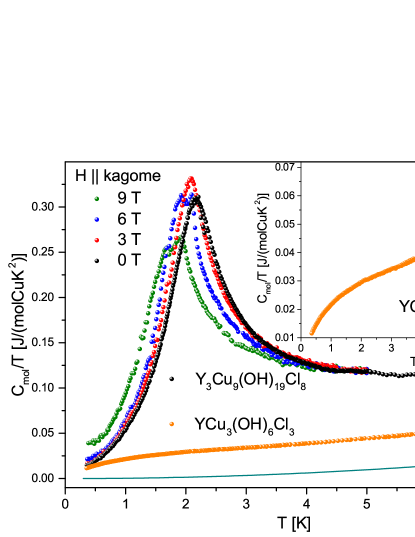
We performed specific-heat measurements on Y3Cu9(OH)19Cl8 single crystals in the temperature range from 0.35 to 270 K. While all powder samples contain small amounts of Clinoatacamite only some crystals have Clinoatacamite twinnings on their surface leading to an anomaly at 6.5 K from the magnetic ordering of this impurity phase Chu(2011) ; Norman(2016) . The phase stability of Y3Cu9(OH)19Cl8 is close to that of Clinoatacamite and always both phases are formed if the hydrothermal growth conditions are applied that are described above. In magnetic measurements, the impurity contribution can even dominate the signal and we have taken great care to select a crystal without this impurity phase. In Fig. 7, the temperature and magnetic-field dependent specific heat of a single crystal without any impurity phase is shown. In zero field (black curve) a maximum is apparent at around 2.2 K. This maximum is slightly shifted to lower temperatures with increasing field approaching K at H T, for H parallel to the kagome layer. A small shoulder appears at the low temperature side for fields larger than 3 T. The entropy gain within the maximum in the specific heat at zero field is . This shows that the ordered moment of Y3Cu9(OH)19Cl8 is strongly reduced and a large portion of the spin degrees of freedom remain fluctuating. We have not subtracted any phononic contribution for the entropy analysis, because at 4 K the estimated contribution of the phonons amounts to only 5%. The phononic contribution was estimated in the range of 8 K to 26 K. The result of a linear fit of vs gives J/(molK2) and mJ/(molK4). This yields a Debye temperature of . In addition, we do not observe any phase transition in the temperature range from 8 to 270 K, in agreement with the magnetic measurements and the temperature dependent PXRD. The low ordering temperature together with the large Weiss-temperature gives a frustration parameter , proving that Y3Cu9(OH)19Cl8 is still a strongly frustrated material. Above TN, the specific heat of Y3Cu9(OH)19Cl8 follows a linear in T-dependence up to 8 K most likely due to the enhanced spin fluctutations.
We have also measured the specific heat of a powder sample of YCu3(OH)6Cl3 (orange curves in Fig. 7), which clearly shows the absence of magnetic order down to 0.4 K which is in agreement with the proposal of a spin-liquid ground state by W. Sun et al. Sun(2016) . Our low-temperature measurements enhance the lower boundary of the frustration parameter of YCu3(OH)6Cl3 to and clearly proves the different magnetic ground states of the two Y-Cu-OH-Cl compounds. The same linear fit procedure was done for a specific heat measurement of YCu3(OH)6Cl3 giving J/(molK2), mJ/(molK4) and , revealing the structural similarity of these systems. Again, no phase transitions were observed up to 250 K.
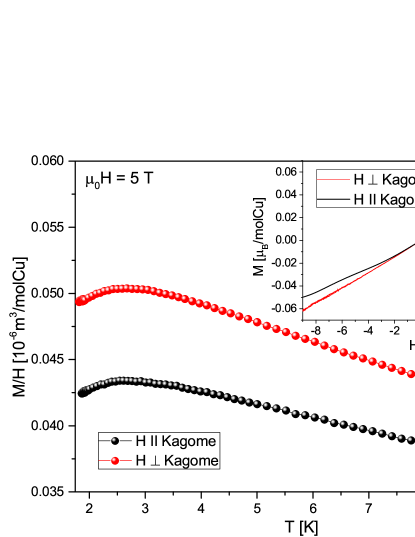
The magnetic transition at of Y3Cu9(OH)19Cl8 can also be determined by magnetic measurements in phase pure crystals, which show a broad maximum at 2.5 K (see Fig. 8). This broad transition is in contrast to the well-defined anomaly in the specific-heat measurements and might be due to a large magnetic background because of enhanced spin-fluctuations of that material. The magnetization is larger for magnetic fields applied perpendicular to the kagome planes, but the overall magnetic anisotropy is weak. The curve perpendicular to the field (inset of Fig. 8) shows a nearly linear increase, while the parallel one has a small kink above 2 T. This might be related to the field induced shoulder observed in the specific heat data. Both curves show no saturation up to 9 T. In comparison with Herbertsmithite, the magnetic anisotropy in Y3Cu9(OH)19Cl8 is stronger but also favors the c-direction as the easy magnetic axis Han(2011) .
IV Conclusion
In conclusion, Y3Cu9(OH)19Cl8 is a stoichiometric quantum spin system with well-separated kagome layers of localized Cu2+ spins. Detailed structural refinements of hydrothermally prepared single crystals revealed a crystal structure with two different copper positions, leading to slightly anisotropic kagome layers. These structural modifications were corroborated by optical absorption experiments which, in addition, confirmed the chemical composition as the studied material shows insulating behaviour with no indications of electron doping and the proposed Dirac bands.
The partial release of magnetic frustration within the kagome layers compared to YCu3(OH)6Cl3 is also reflected in the magnetic properties, because we observe weak but clear magnetic order at K in magnetization and specific-heat measurements on single crystals of Y3Cu9(OH)19Cl8. However, the frustration effects are still very pronounced with a frustration parameter of .
Low-temperature specific-heat measurements on a powder sample of YCu3(OH)6Cl3 revealed the absence of magnetic order down to 0.4 K, leading to a frustration parameter . Therefore, the two Y-Cu-OH-Cl compounds present an unique setting to investigate the change from a spin-liquid state to a strongly frustrated AFM ordered state, by slightly releasing the frustration in a kagome lattice via structural modification. Unlike for substitution series, as e.g. ZnxCu4-x(OH)6Cl2, where we always encounter crystallographic disorder, the magnetic properties of the two stochiometric compounds with fully occupied kagome sites might be much more reliable with ab-initio calculations. Additionally, these two stoichiometric kagome systems might open the way for a systematic understanding of magnetic frustration in kagome materials, which would require further more microscopic measurements of the spin-fluctuation spectrum in these two systems.
Acknowledgements.
The authors gratefully acknowledge support by the Deutsche Forschungsgemeinschaft through grant SFB/TR 49. We thank Michael Seitz for the help with the LA-ICP-MS measurements. This work is based on experiments performed at the Swiss spallation neutron source SINQ, Paul Scherrer Institute, Villigen, Switzerland.References
- (1) L. Balents, Nature 464, 199 (2010)
- (2) M. P. Shores, E. A. Nytko, B. M. Barlett, and D. G. Nocera: J. Am. Chem. Soc. 127, 13462 (2005)
- (3) P. Mendels et al., Phys. Rev. Lett. 98, 077204 (2007)
- (4) T-H. Han, J. S. Helton, S. Chu, D. G. Nocera, J. A. Rodriguez-Rivera, C. Broholm and Y. S. Lee, Nature 492, 406–410 (2012)
- (5) J. S. Helton et al., Phys. Rev. Lett. 98, 107204 (2007)
- (6) M. R. Norman, Rev. Mod. Phys. 88, 041002 (2016)
- (7) D. E. Freedman et al., J. Am. Chem. Soc. 132, 16185–16190 9 16185 (2010)
- (8) W. Krause et al., Mineral. Mag. 70(3), 329 (2006)
- (9) S. Chu, P. Müller, D. G. Nocera, and Y. S. Lee, Applied Phys. Let. 98, 092508 (2011)
- (10) H. Ishikawa, J.-ichi Yamaura, Y. Okamoto, H. Yoshida, G. J. Nilsena and Z. Hiroia, Acta Cryst. C68, i41 (2012)
- (11) D. Boldrin, K. Knight and A. S. Wills, J. Mater. Chem. C 4, 10315 (2016)
- (12) D. A. Prishchenko, A. A. Tsirlin, V. Tsurkan, A. Loidl, A. Jesche, V. G. Mazurenko, arXiv:1611.03317 (2016)
- (13) W. Sun, Y, Huang, Y. Pan, J. Mi, Phys. Chem. Min. 43:127–136 (2016)
- (14) I. I. Mazin, H. O. Jeschke, F. Lechermann, H. Lee, M. Fink, R. Thomale, and R. Valentí, Nat. Comm. 5, 4261 (2014)
- (15) W. Sun, Y. Huang, S. Nokhrin, Y. Pan and J. Mi, J. Mater. Chem. C 4, 8772-8777 (2016)
- (16) R. H. Colman, C. Ritter, and A. S. Wills, Chem. Mater. 20, 22 (2008)
- (17) R. H. Colman, A. Sinclair, and A. S. Wills, Chem. Mater. 23, 1811–1817 (2011)
- (18) T. M. McQueen, T.H.Han, D.E.Freedman, P.W.Stephens, Y.S.Lee, D.G.Nocera, J. Solid State Chem. 184, 3319–3323 (2011)
- (19) G. Meyer, The Ammonium Chloride Route to Anhydrous Rare Earth Chlorides-The Example of YCl3, Inorganic Syntheses 25, 146–150 (1989)
- (20) P. Melnikov, V. A. Nascimento, L. Z. Z: Consolo and A. F. Silva, J. Therm. Anal. Calorim. 111, 115-119 (2013)
- (21) Stoe and Cie GmbH, X-AREA. Diffractometer control program system (2002)
- (22) G. M. Sheldrick, Acta Cryst. A 64, 112-122 (2008)
- (23) P. Fischer et al., Physica B 276-278, 146 (2000)
- (24) J. Rodriguez-Carvajal, Physica B. 192, 55 (1993)
- (25) D. Guterding, H. O. Jeschke & R. Valentí, Sc. Rep. 6, 25988 (2016)
- (26) R. S. W. Braithwaite, K. Mereiter, W. H. Paar and A. M. Clark, Mineral. Mag. 68(3), 527 (2004)
- (27) A. B. Sushkov G. S. Jenkins, T. H. Han, Y. S. Lee, H. D. Drew, J. Phys.: Condens. Matter 29, 095802 (2017)
- (28) S. J. Hwu et al., J. Am. Chem. Soc. 124, 12404 (2002)
- (29) M. Sala et al., New J. of Phys. 13, 043026 (2011)
- (30) T. H. Han, J. S. Helton, S. Chu, A. Prodi, D. K. Singh, Mazzoli, P. Müller, D. G. Nocera, and Y. S. Lee, Phys. Rev. B 83, 100402(R) (2011)