A Ringed Dwarf LINER 1 Galaxy Hosting an Intermediate-mass Black Hole with Large-scale Rotation-like \ha Emission
Abstract
We report the discovery of a 20-kpc-sized \ha emission in SDSS J083803.68540642.0, a ringed dwarf galaxy ( mag) hosting an accreting intermediate-mass black hole at . Analysis of the HST images indicates that it is an early-type galaxy with a featureless low-surface brightness disk ( mag arcsec-2 in the band) and a prominent, relatively red bulge ( = 2.03, kpc or 048) that accounts for 81% of the total light in the band. A circumgalactic ring of a diameter 16 kpc is also detected, with a disperse shape on its south side. The optical emission lines reveal the nucleus to be a broad-line LINER. Our MMT longslit observation indicates that the kinematics of the extended \ha emission is consistent with a rotational gaseous disk, with a mean blueshifted velocity of 162 and mean redshifted velocity of 86 . According to our photoionization calculations, the large-scale \ha emission is unlikely to be powered by the central nucleus or by hot evolved (post-AGB) stars interspersed in the old stellar populations, but by in situ star formation; this is vindicated by the line-ratio diagnostic of the extended emission. We propose that both the ring and large-scale \ha-emitting gas are created by the tidal accretion in a collision—and then merger—with a gas-rich galaxy of a comparable mass.
1 Introduction
It has been generally believed (see Kormendy & Ho 2013, Kormendy 2016 for recent reviews) that, unlike massive galaxies at high redshifts (e.g., ) whose evolution is driven by major merger, low-redshift galaxies largely evolve through secular evolution (i.e., in a slow and gentle manner) driven by internal processes within galactic disks and/or by environmental effects such as harassment or nurturing (see Kormendy & Kennicutt 2004 for details; see also Cowie et al. 1996, Conselice et al. 2014 for the cosmic evolution). It has also been generally believed accordingly that most activity (namely active galactic nuclei—AGNs) of supermassive black holes (BHs) at the centers of galaxies at low redshifts (e.g., , Cisternas et al. 2011; and even up to , Kocevski et al. 2012) appear to be fueled by the random accretion of gas via internal, secular processes working close to the BH (say, within a few hundred parsec, Cisternas et al. 2013; also cf. Hopkins & Hernquist 2006). In these cases there is no connection between AGN activity and major mergers of their host galaxies. This non-connection appears particularly true for low- AGNs hosting intermediate-mass black holes (IMBHs)111 Following Greene & Ho (2007) and Dong et al. (2012), hereinafter we refer to BHs with at the centers of galaxies as “low-mass” or “intermediate-mass” BHs; accordingly, for the ease of narration wherever it is not ambiguous, hereinafter we call AGNs hosting low-mass BHs as low-mass AGNs or IMBH AGNs. Normally we prefer “intermediate-mass BHs” to “low-mass BHs” because of the possible confusion of the latter with the stellar-mass BHs in low-mass X-ray binaries (LMXBs).: according to the analysis of their images by Hubble Space Telescope (HST), the majority of low-mass AGNs live in late-type disk galaxies without a classical bulge (Greene et al., 2008; Jiang et al., 2011). Indeed, the accretion rate for an IMBH is so tiny (0.05 yr-1 even if at the maximum Eddington accretion) that a steady supply of fuel, in the form of stellar mass loss from evolved stars or Bondi accretion of hot gas in the innermost regions, is available readily much more than required (Ho, 2008). “In fact, the paradox for local BHs is not whether there is enough fuel to light them up. Rather, the puzzle is how to keep them so dim despite the ready abundance of in situ gas.” (Kormendy & Ho 2013; see also Ho 2008). That is, the real problem seems to be this (cf. Ho, 2009): there must be some mechanism (yet to know) to hinder the innermost fueling process.222 According to W.-M. Gu (2016, private communication), AGN outflows, which can be launched even at very low accretion rates (e.g., Wang et al. 2013, Gu 2015), provide such a mechanism.
On the other hand, surprisingly Jiang et al. (2011) reported that 9% of their IMBH host galaxies are detected in interacting systems with close companions (of comparable mass) by simple visual identification of their HST images. This fraction is already much higher than that for local luminous galaxies (see their §5.2 for the detail).333 As Jiang et al. cautioned (“we identify the companions only visually based on our HST images. We do not use well-defined criteria, …as this is not our main focus.”), they only identified ongoing mergers (and soon-to-be mergers) of two or more galaxies of comparable masses (see their Figure 4), and did not take into account any morphological features indicative of past major mergers or other violent interactions. Likewise, we inspected the SDSS images of the IMBH AGNs at in the Dong et al. (2012) sample, and found that 41 (16.2%) of the 253 objects are undergoing (dwarf–dwarf) major mergers, minor mergers with a larger galaxy (i.e., violently impacted by the primary), or collisions (violent encounters) with comparable or more massive galaxies, or have features (tidal tails, shells, collisional rings, etc.) indicating recent violent interactions of the above-listed three cases (W.-J. Liu et al. 2017, in preparation). Such a high incidence of violent galaxy interactions (versus internal and environmental secular processes) in IMBH AGNs is higher than previously deemed in the literature (cf. Kormendy & Ho, 2013).
From a theoretical perspective, in the hierarchical framework of galaxy formation major mergers between dwarf galaxies are not uncommon in the low- Universe, let alone at earlier times. For instance, by means of cosmological simulations Deason et al. (2014) found that 10% of satellite dwarf galaxies with stellar mass within the virial radius of a M31-like host dark matter (DM) halo experience a major merger since , and furthermore that for dwarf galaxies that are outside of the host virial radius, the major-merger frequency doubles. Recently such a considerable occurrence of nearby dwarf–dwarf major mergers has been supported by observations (e.g., Geha et al., 2005; Nidever et al., 2013; Crnojević et al., 2014; Amorisco et al., 2014; Paudel et al., 2015). Provided that the effect of major mergers to AGN activity is similar in low- dwarf galaxies, as in building-block galaxies of a similar stellar mass in the early Universe or as in massive galaxies at supposedly triggering quasars (see Kormendy & Ho, 2013), we can expect that major mergers and other violent interactions of IMBH host galaxies (i.e., interactions transforming the configurations of the stars and disturbing the gas of the galaxies forcefully and rapidly) would cause the aforementioned hindrance in the inner regions (whatever it may be) disappear and thus enable or augment the AGN fueling.
Thus it is worth launching a systematic observational study to investigate the outskirts and neighborhood of the IMBH host galaxies, and the extent, morphology and kinematics of cold (H I and CO; L.Qian et al. 2017, in preparation) and warm gas, and thoroughly explore the possible correlations of IMBH accretion activity with (violent) galaxy interaction and/or galactic environment. As a start of our study, in this paper we present detailed observations of an individual source, SDSS J083803.68540642.0 (hereafter J08385406), which has been observed by the MMT telescope with longslit spectroscopy (§2) and has archival HST imaging data (§3). J08385406 caught our attention because it is among the ten “LINER 1” (type-1 AGN of Low-ionization nuclear emission-line region; Ho et al. 1997) galaxies in the Dong et al. (2012) sample of 309 low- IMBH AGNs (see also §4), and because its optical spectrum is very red (; cf. Martin et al. 2007) as dominated by starlight of old age (see also §5). It belongs to the one third galaxies in the Dong et al. (2012) sample with the 4000Å break , i.e., with a mean stellar age greater than 1 Gyr (Kauffmann et al. 2003a). Later on we took the MMT spectroscopic observation, and surprisingly the 2-dimensional longslit spectrum reveals rotation-like \ha emission extending along the spatial axis visually of 32″ across (namely a projected physical size of 19.4 kpc), which is likely powered by in situ star formation (§6). Then we searched archival data and found its aforementioned HST images. The images reveal a spectacular ring around the galaxy with a diameter of 15.6 kpc, which we argue should be created by tidal accretion in a collision (and then merger) with a galaxy of a comparable mass (see §7). A brief summary and future work are given in §8.
Throughout the paper we assume a cosmology with km s-1 Mpc-1, , and .
2 Optical spectroscopic observation and analysis
J08385406 was in the spectral data set of SDSS DR4. It was compiled into the IMBH AGN samples of Greene & Ho (2007) and Dong et al. (2012), because a faint broad \ha line was identified inferring a viral BH mass below 2 after careful handlings of starlight subtraction and emission-line deblending.444 It was in the ‘’ (candidate) sample of Greene & Ho (2007), i.e., not satisfying their quantitative detection threshold of broad \ha but being picked up manually. The SDSS spectrum () was taken on 2000 December 21 UT with an exposure time of 5400 s under the seeing of 2″, through a fiber aperture of 3″ diameter. As a fiber spectrum, the SDSS spectral data has not any spatial information available.
We conducted longslit spectroscopic observation on 2015 March 14 UT with the Red Channel Spectrograph aboard the 6.5m MMT telescope. Two exposures of 900s each were obtained with the 1200 lines mm-1 grating (blazed at 7700Å) and a 1″-wide slit. The central wavelength is placed at 6800Å. This provides a spectral resolution of (i.e., ) and a wavelength coverage of 6410–7230Å. The slit is oriented at position angle (PA) 168 centered on J08385406, with the nearby star SDSS J083804.24540619.9 also falling into the slit. The CCD was binned by a factor of two in the spatial direction, giving a spatial scale of 06 per pixel. The blue-blocking filter L42 was used to block light from higher orders. The seeing was 12 and the sky was clear during the observation.
2.1 Two-dimensional longslit spectrum
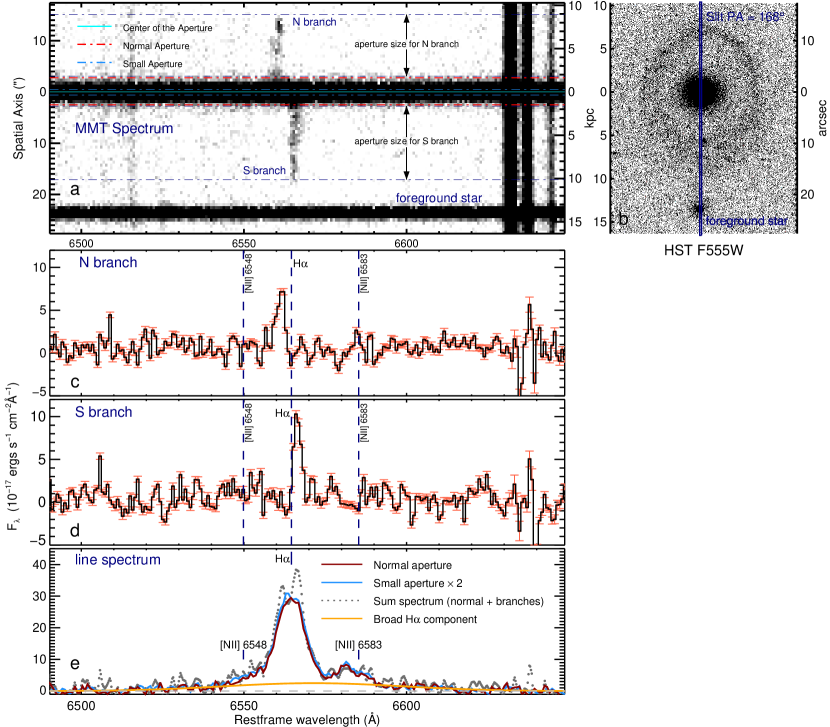
Figure 1 (panel a) displays the MMT two-dimensional (2-D) longslit spectrum, with the dispersion axis centered on the \ha line. The zero position of the spatial axis is set to be the spatial peak of the \ha emission. The most prominent feature is the extended \ha emission stretching out from the spatial zero position towards the two opposite directions. The one towards the direction 12° west of north (labeled as ‘N branch’ hereafter) extends 26 pixels (namely 156 and a projected physical size 9.2 kpc), and the opposite one (labeled as ‘S branch’ hereafter) 29 pixels (namely 174 and 10.2 kpc). Moreover, the spatial sizes of the two \ha branches are even larger than the circumgalactic ring (see panel b).
2.2 One-dimensional spectrum and spectral fitting
The data reduction was performed with the standard routines in the IRAF program to obtain the 1-dimensional spectrum. Particular care is given to extracting the spectra of the two branches that are extended and faint and even worse without a continuum; e.g., we carefully select, by trial-and-error following IRAF manual, the tracing parameters in the IRAF/apall task such as t_nsum, t_step and the order of the trace fitting function. We measured a redshift from the [O I] emission line that appears to have no spatially extended emission and is susceptible little to possible star formation activity; this redshift value is consistent with that given by the SDSS pipeline. The rest frame of J08385406 hereinafter is referred to this redshift.
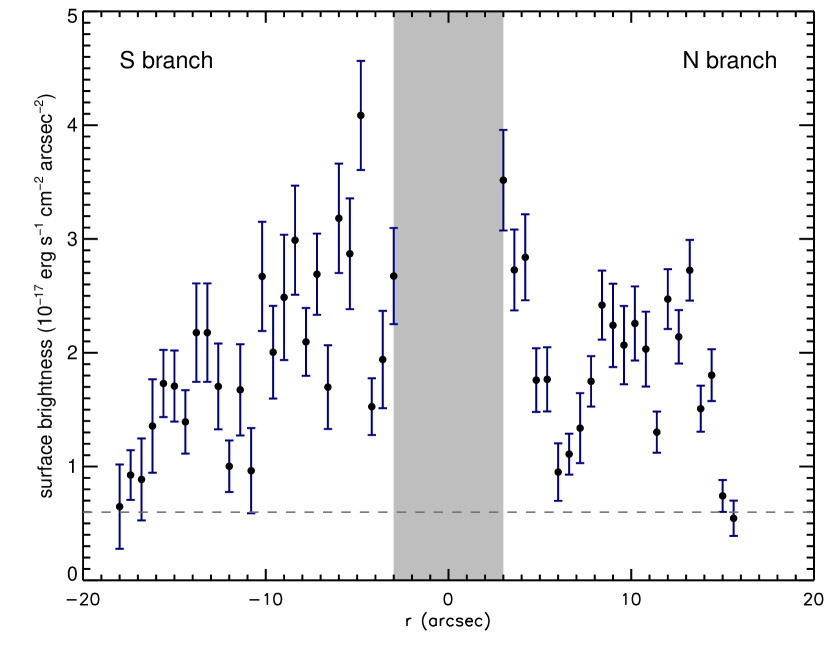
Panels c and d of Figure 1 display the one-dimensional restframe spectra of the two branches of the spatially extended \ha emission. The extraction apertures are denoted in panel a. The N branch of the extended \ha emission is blueshifted by 162 as measured from the centroid of the best-fit \ha (namely the mean blueshift of the N branch, see below and Table 1) relative to the theoretical wavelength in the rest frame, and the S branch is redshifted by 86 (namely the mean redshift of the S branch). We also extract the one-dimensional spectra of every lines of the spatial direction for the two branches, and then obtain the radial profile of the \ha flux per arcsec2 (namely surface brightness) as illustrated in Figure 2. In the figure, the gray shaded area denotes the region affected by \ha emission from the AGN BLR and NLR in the normal aperture; we do not extract the spectra for every spatial lines within the normal aperture because considerable starlight is present, and hard to model and subtract for every spatial line there. The radial surface brightness profile is irregular, not in a monotonic function with the projected radius (e.g., by no means like ). The lowest surface brightness of the extended \ha emission is about erg s-1 cm-2 arcsec-2, which sets the spatial extent of the two branches we can probe. In fact it is in terms of it that we set the outer bounds of the above extraction apertures for the two branches.
We need to verify that J08385406 has a real nuclear broad \ha component rather than a false appearance resulting from starlight contamination, or any velocity-offset \ha components emitted on larger scales (e.g., the two branches of the extended \ha emission). First, we extract one-dimensional spectra with two spatial apertures of different widths. One spectrum is extracted with a width of 54 (namely 9 pixels and 3.2 kpc, hereinafter called “normal aperture”; see in panel a of Figure 1 the aperture between the two red dash-dotted lines), which includes almost all light of J08385406. The other spectrum is extracted with a width of 12 only (hereinafter called “small aperture”, equal to the seeing FWHM, corresponding to 2 pixels and 1.2 kpc; see in panel a the aperture between the two blue dash-dotted lines) which only collects light from the central region of J08385406. As panel e shows, the two spectra of different extraction apertures have an almost identical shape of the \ha profile: the broad base of the \ha line profile—presumably the broad \ha line originated from the broad-line region (BLR) of the AGN—does not change with aperture size. This suggests that the broad \ha is not mimicked by narrow-line wings or any starlight features. Besides, we obtain a sum spectrum (see the dotted line in panel e) by adding up the normal-aperture spectrum and the spectra of the two branches of the extended emission (see panels c and d). By comparing the sum spectrum with the normal-aperture spectrum, we find that the extended \ha emission does not impact the BLR-emitted \ha component at all, because (1) the extended \ha emission is relatively too weak, and (2) more importantly the velocity offsets of the two branches are rather small (compared with the width of broad \ha, 2814 FWHM; see panel e), particularly of the S branch that is the stronger branch but has a smaller velocity offset of 86 only.
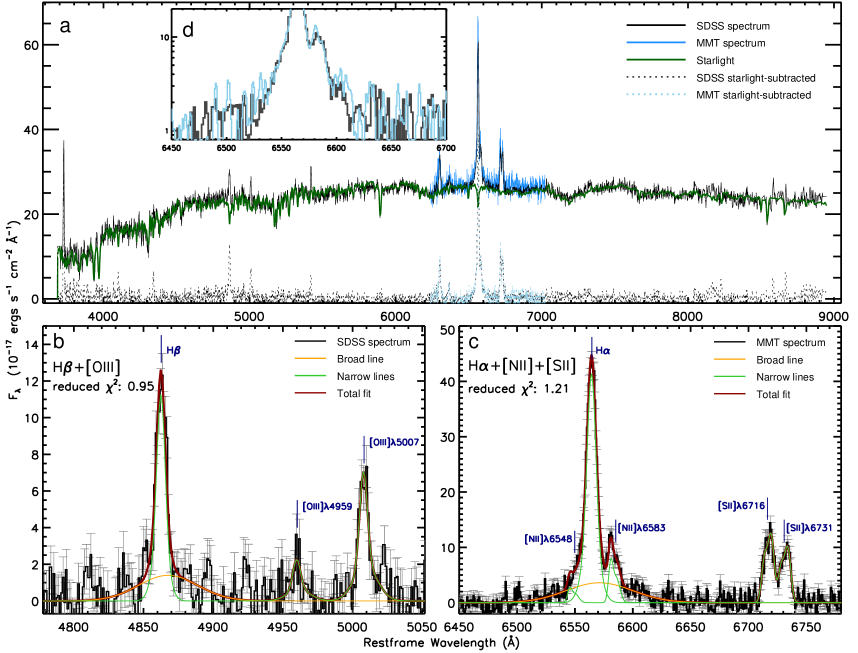
Next we perform continuum modeling and emission-line profile fitting. We use the same fitting procedures as Dong et al. (2012); here we only provide a brief description. Regarding the MMT data, the normal-aperture (54) spectrum is adopted, corrected for Galactic reddening using the extinction map of Schlegel et al. (1998) and the reddening curve of Fitzpatrick (1999), brought to the rest frame, and then scaled to the (Galactic reddening corrected) SDSS spectrum555 J08385406 is picked up from the IMBH sample of Dong et al. (2012) that was based on the data set of the SDSS DR4. Here we use the spectral data reduced by the improved SDSS pipeline, version rerun 26, as released since the SDSS DR7 (downloadable at http://das.sdss.org/spectro/ss_tar_26/ ), instead of the data reductions archived in the SDSS DR4 (version rerun 23). according to the [O I] flux (see panel a of Figure 3).
As the SDSS spectrum shows, the optical spectrum is dominated by host-galaxy starlight. According to the decomposition of HST images (see §3), the AGN continuum is fairly weak and can be safely ignored in the spectral fitting. Because the wavelength coverage of the MMT spectrum is not sufficiently large to fit the starlight, we obtain the best-fit starlight by fitting the SDSS spectrum, and then subtract it from the MMT one to get the MMT emission-line spectrum. The starlight is modeled with the templates of Lu et al. (2006), which were built from the spectra of simple stellar populations of Bruzual & Charlot (2003). The starlight templates are broadened and shifted to match the stellar velocity dispersion of the galaxy, so that the stellar absorption lines are well subtracted. As shown in Figure 3 (panel a), the fit is good: the absorption features are well matched, and the residuals in the emission-line-free regions are consistent with the noise level. The strategy of subtracting the starlight from the MMT spectrum is reasonable as the normal-aperture MMT spectrum comprises almost all the light (including starlight) in the slit from the source and in fact matches the SDSS spectrum well (see panel a of Figure 3).
Next, we fit the emission lines using the code described in detail in Dong et al. (2005). The optical spectra show strong, narrow emission lines such as [O II] 3727, [O I], \ha, [N II], and [S II]; [O III] is instead weak. As we verified in the above, broad \ha is evidently presented (see also Greene & Ho, 2007; Dong et al., 2012). The SDSS data are used to fit the blue part such as H [O III] region (as not covered by the MMT spectrum), and the MMT data for the red part such as [O I] lines, the \ha [N II] region and [S II] lines. We fit the MMT spectrum first. Every narrow or broad components of the emission lines are modeled with Gaussians, starting with one Gaussian and adding in more if the fit can be improved significantly according to test. The [S II] doublet lines are assumed to have the same profile and fixed in separation by their laboratory wavelength; the same is applied to [N II] doublet lines, and to [O I] and [O I] emission lines. The flux ratio of the [N II] doublet is fixed to the theoretical value of 2.96 (e.g., Acker et al., 1989; Storey & Zeippen, 2000). The best-fit model turns out that one Gaussian is used for the broad component of \ha, while two Gaussians for the narrow component of \ha, each line of the [N II], and [S II] doublet and the two [O I] lines, respectively. The reduced is 1.21 for the \ha [N II] region. Note that the [N II] and [S II] doublet lines show asymmetric line profiles clearly in the MMT spectrum, which are actually common in high-resolution spectra (Xiao et al., 2011); thus these narrow lines, and narrow \ha also, need two Gaussians to model. Then we fit the H[O III] region based on the SDSS spectrum. As the spectral signal-to-noise (S/N) of this region is not high and the H emission line is much weaker than \ha, we assume the broad and narrow component of H have the same profiles as the respective components of \ha. The [O III] doublet lines are assumed to have the same profile, and the flux ratio of is fixed to the theoretical value of 2.98 (e.g., Storey & Zeippen, 2000; Dimitrijević et al., 2007); the best-fit model turns out to adopt two Gaussians for each [O III] doublet line. The reduced is 0.95 for the H [O III] region. [O II] 3727 is fit independently, and one Gaussian is sufficient to model. We also fit the \ha lines of the N and S branches of the extended emission. One Gaussian is statistically sufficient for either branch, with reduced of 0.95 (N) and 0.97 (S), respectively. The best-fit line parameters, centroid, FWHM (corrected for instrumental broadening), and flux of every branch agree well with those directly integrated/measured from the spectra.
All the best-fit line parameters are listed in Table 1. The best-fit model is illustrated in Figure 3, for the H [O III] region (panel b) and the \ha [N II] region (panel c). We note that the broad-\ha FWHM is 2814210 , which is larger than the results of Greene & Ho (2007, 2120 ) and Dong et al. (2012, 2094 ) based on the SDSS spectrum. This is probably because the MMT spectrum with a higher spectral resolution reveals the lower-contrast part of the wing of broad \ha than the SDSS, which can be discerned from the zoom-in view in the insert of panel a of Figure 3.
3 HST imaging observations and analysis
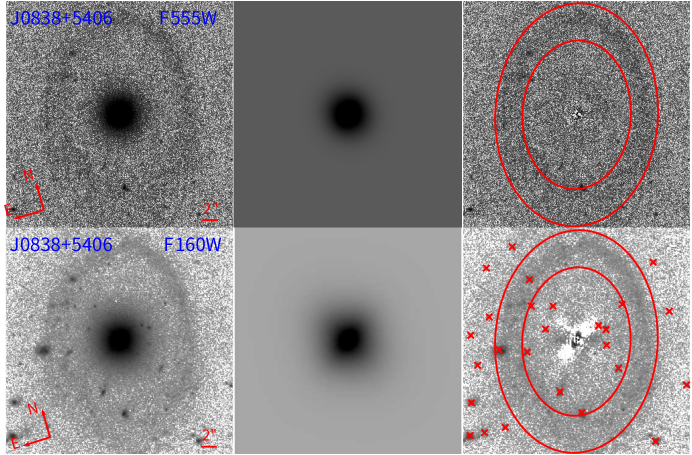
There are archival HST images for J08385406 observed by the WFC3 camera with the F160W (roughly the band of the Johnson system) and F555W (roughly ) filters (proposal ID: 12557, PI: K. Gultekin), as well as the HST/WFPC2 image with the F814W (roughly ) filter used by Jiang et al. (2011). The main body of the galaxy is almost round in shape and has no spiral arms, indicating an elliptical/spheroidal or a face-on S0 galaxy. However, a circumgalactic ring-like structure appears, prominent in the WFC3 images particularly (see Figure 4). This ring is not very apparent in the WFPC2 image and was thus not mentioned by Jiang et al. (2011).666 Interestingly, we first noticed this ring from the SDSS image although the ring is faint and hard to discern there, and then we checked the HST archival data. We analyzed the WFPC2 image, and the result was almost the same as the structural fitting result presented by Jiang et al. (2011); thus in the following we only describe our analysis of the WFC3 images.
For ease of rejecting cosmic rays and to alleviate the undersampling problems of the point spread functions (PSFs), both the F160W and F555W observations were carried on in dither mode. The F160W image was targeted by the IR channel with a four-point dithering pattern called ‘WFC3-IR-DITHER-BOX-MIN’ while the F555W image was taken with a three-step dither pattern named ‘WFC3-UVIS-DITHER-LINE-3PT’. The total exposure time for F160W and F555W band are 1073 and 1180 seconds, respectively. We begin the reduction with the flat-field calibrated images (flt.fits) and combine the single exposures using standard software Astrodrizzle777 http://ssb.stsci.edu/doc/stsci_python_x/drizzlepac.doc/html/astrodrizzle.html, resulting in a final calibrated image for each band which is cosmic-ray-rejected, geometrically-distortion-corrected and sky-subtracted.
Precise PSF is of great importance to separate the central AGN light from the host galaxy starlight (e.g., Kim et al., 2008). The WFC3/IR camera for the F160W image (with a plate scale of 013 per pixel) is highly undersampled with PSF FWHM of (i.e., only pixel). To achieve Nyquist sampling and also match with CANDLES hybrid PSF scale, we set final_scale = 0.06 to generate a new combined image with a higher sampling rate of 006 per pixel. Besides, we set final_pixfrac = 0.8 during the Astrodrizzle running in order to avoid introducing too much variation between pixels in the weight maps. The PSF FWHM of WFC3/UVIS camera for the F555W image (00396 per pixel) is , also slightly undersampled. We set final_scale = 0.03 in the Astrodrizzle combining. We adopted the hybrid PSF from CANDELs field, which works better than either modeled or empirical (stellar) PSFs (van der Wel et al., 2012)888 They use 46 isolated stars in median-stacked form as an alternative PSF representation. The problem with this approach is the variety in the sub-pixel positioning of the stellar images, which leads to broadening in the PSF model when stacking a number of stars. In order to provide an accurate PSF model at all radii they take the median-stacked star and replace the central pixels (within a radius of 3 pixels from the center) by the TinyTim model PSF. The flux values of these pixels are normalized such that the total flux of the newly constructed hybrid PSF model is the same as that of the stacked star. Their hybrid PSFs have a uniform pixel scale of . as the PSF of the F160W image. There is no existent hybrid PSF for the F555W image, so we turn to the modeled PSF produced by TinyTim999 http://www.stsci.edu/hst/observatory/focus/TinyTim. We first generate PSF to match with each single exposure, during which its position in the CCD and its defocus offset are carefully considered. Then we replace the central part of the object images by the corresponding PSF images and combine them using Astrodrizzle with the same drizzle parameters as above.
Then we try to perform a 2-D decomposition of J0838 using GALFIT (Peng et al., 2002, 2010). The AGN is represented by a PSF, and the host galaxy is modeled by a bulge as a Sérsic (1968) function or a disk as an exponential function (Exp; equivalent to sérsic) or a combination of them. The sky background has been subtracted during Astrodrizzle combination; the validity is confirmed by our residual sky estimation. The ring region (denoted by the two red ellipses in Figure 4) and other contaminations such as background galaxies or foreground stars are masked out. We take an fitting approach with incremental complexity of the model, which proves to be an effective way to obtain an optimal result (Dong et al., 2007; Jiang et al., 2013). We start the fitting with the simplest model, in which the host galaxy is represented by a single sérsic component in addition to a PSF for the AGN. It yields obvious residuals with a large reduced . Then we add an Exp disk component into the model, and the fitting gets pretty acceptable for both bands. We try models with more free parameters (such as PSF plus two sérsics), yet the fittings cannot be improved significantly. Thus we adopt the PSFsérsicExp scheme as the best model. We note that, although it is quite weak (particularly in the F160W band) the PSF component is not dispensable, because (1) its existence is vindicated by the presence of the broad \ha emission line in the optical spectra (§2.2) and (2) in practice without it the fittings would leave obvious residuals in the central region with large reduced particularly in the F555W image (see also Jiang et al. 2011 for the fitting of the F814W image).
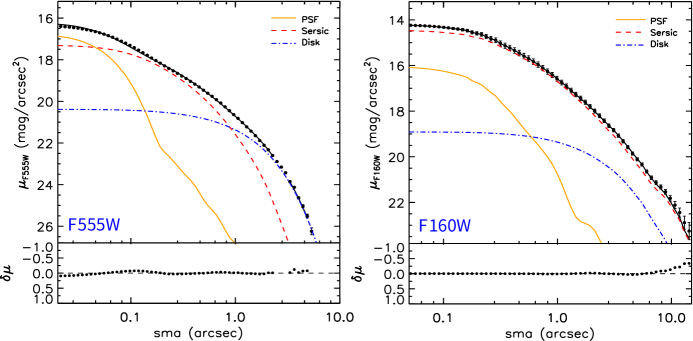
The fitting results are presented in Figure 4, and the best-fit parameters are summarized in Table 2. In Figure 4 (bottom panels) we also plot the 1-dimensional representation of the data and the best fits, i.e. the azimuthally averaged surface brightness profiles of the HST images and the GALFIT best-fit models as well as the residuals. The surface brightness profiles are extracted with the IRAF/ellipse task that can interpolate into subpixel scale. Note that the interpolation into subpixel scale is somehow excessive and the errors of the inner data points are inter-independent, and thus those surface-brightness data are just for demonstration purpose and used in Figure 4 only.
The host galaxy is dominated by the bulge component, particularly in the F160W band. In the F160W band, the bulge has best-fit ellipticity and sérsic index ; the sérsic index (around 4) is typical for merger-built classical bulges. Aside from the bulge, the disk is yet indispensable and can be easily fitted out from the 2-D images because the orientation of its major axis (PA °) is almost perpendicular to that of the bulge component (°). While its best-fit size is similar in both filters ( kpc, see also the F814W result in Jiang et al., 2011), the disk becomes much prominent in the bluer band (namely F555W) with a best-fit ellipticity , overshining the bulge outside ″ (see Figure 4, the left bottom panel).
We would like to give more analysis and check about the use of our adopted hybrid PSF for the F160W image. Potentially the PSF modeling impacts seriously the best-fit AGN and galactic disk components, both of which (particularly the AGN) are much weaker with respect to the bulge component in the NIR than in the optical (see Figure 4). The hybrid PSF is likely composed from substantially redder stars than the nucleus of J08385406, and is thus wider. This would create artificial flux transfer to some degree from the bulge component (namely the second most compact component) to the AGN component in GALFIT fitting; certainly the inverse transfer is also conceptually possible (particularly in sources with bright nuclei, which is not the situation of J08385406). To assess this possibility, we use TinyTim to generate a model PSF for the F160W filter. We consider the CCD position, focus offset, AGN SED and so on, following the aforementioned procedure for the F555W filter. Then we run GALFIT again to fit the F160W image. The fitting result changes little, with similar residual patterns. Note that the spike-like white “cross” (namely over-subtraction to a certain degree) in the residual image of the F160W fitting (Figure 4) is not due to PSF mismatch, unlike the usual situation of GALFIT fitting images with bright AGN nuclei. It is instead caused by the slight (as judged from the residual of the 1-dimensional representation in Figure 4) over-subtraction of the bulge and disk components; as mentioned in the above the two are oriented almost perpendicularly. Besides, the best-fit disk in the F160W is by no means only to compensate possible PSF mismatch, because (1) the disk component is indispensable as we argue in the above paragraph with the F555 fitting result (as well as the F814W of Jiang et al. 2011), (2) the AGN component is rather faint in the F160W band and cannot leave considerable residual fluxes on the scale of the galactic disk, and (3) the best-fit disk parameters (size, PA and ellipticity) of the F160W image are consistent with those of the optical images. We have also extracted the 1-dimensional surface brightness profiles of both the hybrid PSF and the TinyTim F160W one, and find that the discrepancy between the two is almost negligible at all radii. In fact, Kim et al. (2008) have conducted detailed tests (see their §2.1) and concluded that for HST PSFs the variation due to SED is % at all radii, which is negligible compared with that due to spatial distortion, temporal variability and particularly pixel undersampling. Certainly, as demonstrated by the 1-dimensional surface brightness profiles in Figure 4 (bottom panels) the bulge component overwhelms the other two components (the AGN and the disk) in the NIR, and hence we caution that the best-fit parameters for the AGN and the disk from the F160W image are not as reliable as from the F555W image. It is for this very reason that in the above we quote the information (sérsic index, size, PA, and ellipticity) for the bulge from the F160W fitting and for the galactic disk from the F555W fitting.
4 The IMBH and LINER 1 nucleus
Based on the analyses of the spectra and images, we are able to estimate the properties of the host galaxies and central BH for J08385406. The 2-D decomposition of the HST images by this work and Jiang et al. (2011) show that J08385406 incorporates three components: a bright bulge component, a weak galactic disk component, and a faint PSF component. Spectral analysis reveals that J08385406 has a weak but evident broad \ha emission line originated from the AGN BLR. This object was covered by the VLA FIRST survey (Becker et al., 1995). We analyze the radio data and find a compact source located in the nucleus position with a considerably high statistical significance, and the measured flux at 20cm is 1.09 mJy with a rms noise of 0.15 mJy.101010 We use the program Gaia in the starlink software package (http://starlink.eao.hawaii.edu/starlink/ ) to fit a 2-dimensional Gaussian to the source at the position of J08385406 in the VLA FIRST image. The source turns out to be point-like, with a flux of 0.84 mJy and rms noise of 0.15 mJy. The source detection threshold set by the FIRST catalog is 1 mJy, so this source was not included in the official catalog. With a CLEAN bias (which always makes an underestimate of the flux) of 0.25 mJy (Becker et al., 1995), the real flux of the source should be 1.09 mJy, 7.3 times the rms noise. We calculate the k-corrected radio power as , where the radio spectral index () is commonly assumed to be . Then we get W Hz-1. We calculate the radio-to-optical flux ratio (namely radio loudness) following Ivezić et al. (2002), , where and are flux densities (per Hz) at the band and 20 cm, respectively. The thus-calculated is 2.0, indicating that J08385406 is a mildly radio-loud AGN.
With the measured luminosity and line width of the broad \ha emission line, the BH mass can be estimated with the commonly used virial mass formalisms that adopt the empirical relation between BLR radius and AGN luminosity (the – relation; Kaspi et al. 2000). The BH mass values given by Greene & Ho (2007) and Dong et al. (2012) are 1.58 and 1.26 respectively. Here we estimate the BH mass with our measurement of the \ha emission line from the MMT spectrum (see §2.2), using the mass formalism given by Xiao et al. (2011, their Eq. 6), which is based on Greene & Ho (2005a, b) but incorporates the – relation recently calibrated by Bentz et al. (2009). The total (BLR NLR) \ha luminosity measured from the normal-aperture MMT spectrum is . Note that according to the broad-line \ha/H ratio (3.4; see Table 1), the broad lines suffer nearly no dust obscuration (see Dong et al. 2008). Thus we obtain . This value is larger by a factor of 2 than those given by Greene & Ho (2007) and Dong et al. (2012), mainly because of our larger FWHM of broad \ha measured from the MMT spectrum; this discrepancy is roughly within the uncertainty of virial mass estimation (e.g., Wang et al., 2009; Xiao et al., 2011).
To estimate the bolometric luminosity (), we follow the recipe of Greene & Ho (2007) for the bolometric correction from , yielding . The corresponding Eddington ratio is thus . The of J08385406 (and correspondingly the ) is slightly lower than the median ( ) of the nearby type-1 Seyfert galaxies and quasars listed in Table 1 of Ho (2008), but higher than the median of the nearby type-1 LINERs listed there ( ). The broad-\ha luminosity is slightly larger than that of the IMBH AGN in a less luminous galaxy at a similar redshift (SDSS J160531.84174826.1, ; Dong et al. 2007), but lower than that of the prototypal IMBH AGN, POX 52 at (see Table 4 of Dong et al. 2007).
J08385406 is among the ten LINER 1 galaxies in the Dong et al. (2012) sample of 309 low- IMBH AGNs. From the SDSS and MMT spectra (see Table 1), the optical narrow emission lines are observed to have the following line-intensity ratios: log [O III]/H = , log [N II]/\ha = , log [S II]/\ha = , and log [O I]/\ha = . In the BPT diagnostic diagrams (Baldwin et al., 1981; Kauffmann et al., 2003b; Kewley et al., 2006), J08385406 corresponds to the boundary case between H II and LINER: it is located at the H II portion in the [O III]/H versus [N II]/\ha diagram, on the border between H II and LINER in the [O III]/H versus [S II]/\ha diagram, and at the LINER portion in the [O III]/H versus [O I]/\ha diagram. We also note its strong [O II] 3727 and [O I] emission lines, which are characteristic of LINERs. With the flux ratios log [O II] 3727/[O III] = 0.460.11 and log [O I]/[O III] = 0.170.11, J08385406 safely satisfies the criteria of being a LINER of Osterbrock & Ferland (2006; [O II] 3727/[O III] ¿ 1 and [O I]/[O III] ¿ 1/3).
5 The host galaxy, ring and extended \ha emission
J08385406 is an early type galaxy of a red color with , which satisfies the red galaxies criteria () of Strateva et al. (2001). With a total luminosity (bulge disk ring) of mag measured from the HST F555W image, it is a dwarf galaxy, even fainter than the Large Magellanic Cloud (LMC, mag). The SDSS spectrum is dominated by starlight from old stars. The stellar age of a galaxy can be roughly estimated from the 4000-Å break index and the H absorption index (H); see Kauffmann et al. (2003a). We measure and H from the SDSS spectrum and obtain = 1.66, H = 0.40. According to Figure 2 of Kauffmann et al. (2003a), both the indices indicate the mean stellar age of J08385406 is about 2.5 Gyr. We use the K-band luminosity of the starlight to calculate the stellar mass, because the mass-to-light ratio in the K band () is relatively insensitive either to dust absorption or to stellar population age. Into & Portinari (2013) provide a calibration of mass-to-light ratios against galaxy colors; here we use log (with a scatter of 0.1 dex; see their Table 3). The and are the SDSS Petrosian magnitudes and is calculated from the 2MASS band of J08385406, giving and . Then the stellar mass is .
According to [O II] 3727 emission line from the SDSS spectrum, we can estimate the star formation rate (SFR) of the nuclear region ( kpc).111111 The SDSS spectrum is extracted through a fiber aperture of 3″ in diameter, i.e., a radius (projected physical distance) of 0.9 kpc at this source’s redshift. But [O II] 3727 is a low-ionization forbidden line and can be excited in either H II regions, or in narrow line regions (NLRs) of AGNs, or in a shock-heated plasma. It is hard to estimate the fraction of [O II] 3727 coming from possible H II regions for J08385406. If we assume all the [O II] 3727 flux is from H II regions of J08385406, we can use the extinction-corrected [O II] 3727 luminosity to get the upper bound to the SFR. The extinction of narrow lines can bee determined by comparing the observed narrow-line Balmer decrement \ha/H with the intrinsic value in AGN NLRs (3.1; Halpern & Steiner 1983; Gaskell & Ferland 1984). Assuming the extinction curve to be the Small Magellanic Cloud (SMC) one (Gordon et al., 2003), we get . The measured is , and the extinction-corrected is . Employing the calibration of Kewley et al. (2004, their Eq. 10), we derive the upper bound to SFR([O II] 3727) to be 0.15 yr-1.
HST images reveal a circumgalactic ring structure of J08385406. The ring is an ellipse in the sky, with its major and minor axes being 27″ (15.6 kpc) and 19″ (11.4 kpc), respectively, in the F160W () band. It exhibits a disperse shape on its south side in the sky, which spreads along the radial direction.
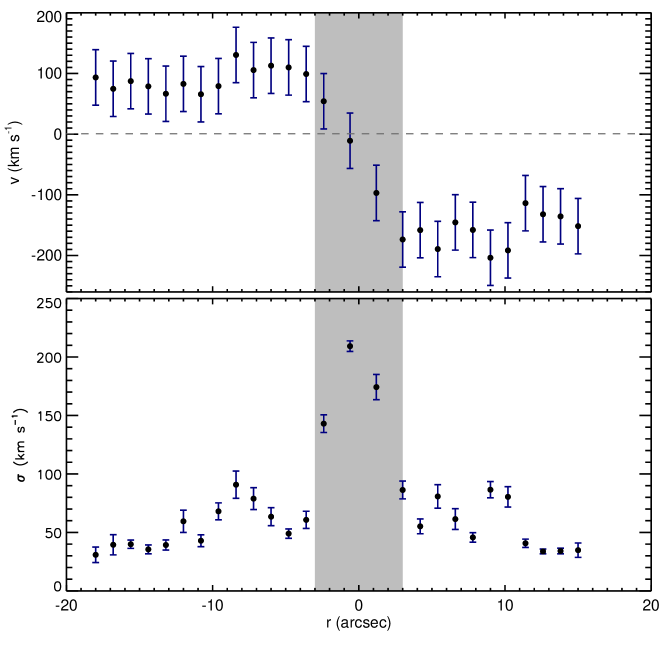
The most striking feature of J08385406 is the large-scale \ha emission extending to 10 kpc from the center of the galaxy in the MMT 2-D longslit spectrum. We measure the distributions of the line-of-sight (LOS) velocity of \ha-emitting gas (namely \ha line profiles) at different spatial positions along the slit. To increase the S/N (compared with Figure 2), we combine the spatial lines every 2 pixels. Velocity measurements are also done for the spatial lines within the normal aperture (namely the main body of the galaxy) since such a kind of measurement does not require exact flux calibration and measurement; the normal apertures (9 pixels) are divided evenly into 3 bins. The distributions are close to normal, and we then fit them with a Gaussian each. From the fitting results we obtain the mean velocity (, namely the centroid of the Gaussian distribution, with respect to the systematic redshift) and velocity dispersion () at every spatial positions; the 1- errors are also given by the fitting. In Figure 5 we plot the radial profiles of (top panel) and (bottom panel). In the spatial axis , zero denotes the position of the central AGN in the slit (see Figure 1) and north is toward positive values. The positive values denote red shifts, and the negative, blue shifts. The values are not corrected for instrumental broadening. The profile shows a steep decrease by 250 when runs from (2.4 kpc south) to (2.4 kpc north). With going outwards along the S branch basically keeps constant at the mean value as measured from the integrated S-branch aperture (86 ), marginally reaching the maximum redshift ( ) at kpc south and then dropping and roughly leveling around the mean. On the positive part (namely the N branch), basically keeps constant at the mean value as measured from the integrated N-branch aperture (162 ), marginally reaching the maximum blueshift ( ) at kpc north and then decreasing again and roughly leveling at 140 towards the larger north end ( kpc). The profile, except in the central region (roughly in the range [, 2] kpc) that is affected by the \ha emission from the AGN BLR and NLR, are basically flat with velocity dispersion values in the range (without correcting for instrumental broadening). Considering the instrumental broadening , the intrinsic velocity dispersion of the extended \ha-emitting gas is very small; only in the two positions with the maximum redshift or blueshift (namely around 5 kpc south and 5.4 kpc north, respectively) reaches a maximum (corrected for instrumental broadening). Both the and profiles are similar to many rotation disks of warm gas reported in the literature (e.g., Walsh et al., 2010; Katkov et al., 2011).
In addition, we do not detect significant starlight continuum on the large scales of the extended \ha emission, neither in the HST images nor in the MMT longslit data; this is evident in Figure 4 and indicated by the continuum levels (close to 0) in panels c and d of Figure 1. It is also worth noting that the physical scale of the extended \ha emission corresponds to or even larger than the faint outer rim of the ring as revealed by the HST images (Figure 4). Several bright spots of the extended \ha emission along the slit (e.g., at kpc south) roughly correspond to the inner rim of the ring.
6 In situ star formation powers the extended \ha
The presence of the spatially extended \ha emission (see §2.1) indicates that ionized warm gas exists on the scales 10 kpc away from the center of the galaxy. In the literature such large-scale emission lines were often reported in dwarf starburst galaxies as powered by in situ star formation activities (e.g., NGC 1569, Martin et al., 2002), but seldom in galaxies with such red colors. Thus two questions emerges naturally as follows. The first question — what powers the large-scale \ha emission line for this object: AGN, star formation, or heating by some kind of shock? The second question — where is the ionized gas from?
As to the first question, assuming all the \ha flux is from hydrogen recombination, the total number of ionizing photons must be large enough to balance the total number of recombination events in the ionized gas. Following Eq. (13.4) of Osterbrock & Ferland (2006), we can write the luminosity of \ha as follows,
| (1) |
where is the nebular covering factor, is the number of \ha photons produced per hydrogen recombination,121212 The parameter is the effective recombination coefficient that reflects the number of recombinations to all levels which ultimately lead to transitions from to (namely emitting \ha photons). The parameter is the Case B recombination coefficient. At K and under Case B condition (see Tables 2.1 & 4.2 of Osterbrock & Ferland 2006), is cm3 s-1, is cm3 s-1, and the Balmer line intensity ratio . According to (cf. Eq. 4.14 of Osterbrock & Ferland, 2006), is cm3 s-1. and is the number of photons that can ionize hydrogen atoms. By means of Eq. (1), then we can estimate the ionizing photons required to produce the observed \ha luminosities of the broad component, the narrow component and the extended, provided that the corresponding covering factors (, and ) are known. The measured broad, narrow and extended \ha luminosities are , , and , respectively.
We first consider the possibility that the ionizing photons are all provided by the central AGN. Adopting the ionizing continuum of the median quasar SED (either radio-loud or radio-quiet) of Elvis et al. (1994) and scaling it to the observed (5100Å) of this object, we obtain the number of the ionizing photons per second. We note that previous studies showed that the SED of LINERs does not likely have the big blue bump (e.g., Ho, 2008; Younes et al., 2012) and thus the number of the ionizing photons of J08385406 (being a LINER) should be less than the above value. On the other hand, typically in AGNs the BLR covering factor and the NLR one (Mor et al., 2009). Considering its disk configuration (§5), the covering factor of the extended \ha-emitting gas to the central source should be very small (say, ). According to Eq. (1), the required number of the ionizing photons accounting for the broad \ha luminosity is per second; per second for the narrow \ha; per second for the extended \ha. Note that here we do not count emission lines other than \ha, and thus the real required ionizing photons should be much more than the above estimated. Hence we can see that the AGN-provided ionizing photons may roughly balance the one required by the broad \ha emission line only, but is not able to further power all the narrow \ha emission line extracted from the normal aperture, let alone the large-scale \ha that should have a tiny covering factor to the central AGN. There might be a possibility that the warm extended gas is powered by stronger AGN activity in the past time, about years ago (corresponding to the distance of the extended \ha emission to the AGN). This is however disfavored by the line-ratio diagnostics of the extended emission (see below).
In light of the old stellar age of the host galaxy, we then consider hot evolved stars as a probable energy source. In galaxies with stellar populations older than Gyr , evolved stars after their asymptotic giant branch phase (post-AGB) can become sufficiently hot ( K) to produce a radiation field capable of ionizing atoms with a substantial ionization potential (Binette et al., 1994; Ho, 2008; Singh et al., 2013). In terms of the BPT diagrams, the emission lines powered by post-AGB stars appear like a LINER spectrum that is just the case of the narrow emission lines of J08385406. Post-AGB stars have a specific ionization rate of s-1 (Binette et al., 1994; Ho, 2008). Multiplied with our derived stellar mass of J08385406 (), the post-AGB stars embedded in the whole galaxy can contribute ionizing photons per second. This value is lower by 1 order of magnitude than either the required by the broad \ha emission even if assuming a complete covering () or the required by the narrow \ha emission assuming , or is 2.7 times lower than the required by the extended \ha emission assuming . It can be regarded reasonable to assume a complete covering of the narrow-\ha-emitting gas to the post-AGB stars because the two are generally co-spatial. It is however not possible for the extended \ha-emitting gas to completely cover the post-AGB stars, because the post-AGB stars are predominantly distributed within the main body of the galaxy (namely within ) but the extended \ha-emitting gas is much farther out and likely in a thin-disk configuration (§5). It thus appears plausible that, considering possible uncertainties in the above estimations, the AGN continuum powers the broad \ha emission line, the post-AGB stars may power (part of) the narrow \ha emission line, but neither is able to further power the large-scale \ha emission. This inference is consistent with the radial surface brightness profile of the extended \ha emission that is irregular without a monotonic dependence with projected radius (§2.2). Actually it is vindicated by the \ha-involving BPT diagram of the normal-aperture narrow lines (§4) and the BPT diagnostics of the extended emission below.
We do not detect any significant spatially extended emission features of low-ionization lines ([O I], [N II], and [S II]) in the 2-dimensional longslit spectrum. The [O I] line is located at the blue end of the MMT spectrum where the spectral quality is poor. The [S II] doublet lines suffer from contamination from the nearby sky lines. For the extended [N II], we try to measure the upper bound of the flux from the spectra of both branches. As the [N II] doublet lines in either branch are rather weak (if not absent), we calculate the flux and flux error for the [N II] line directly from the spectrum of each branch (see panels c and d of Figure 1), which gives erg s-1 cm-2 for the N branch and erg s-1 cm-2 for the S branch. We take the thus-estimated flux plus 2 times the flux error as the upper bound to the [N II] flux, i.e. erg s-1 cm-2 for the N branch and erg s-1 cm-2 for the S branch. We confirm that these values are definitely a secure upper limit, by plotting the [N II] line assuming the line having the same width as the corresponding \ha and the above upper-limit flux for each branch. Thus the line ratio log [N II] for the N branch and log [N II] for the S branch, both being in the H II region of the BPT diagram. This further supports our inference that the extended, line-emitting gas is powered by star burst.
It is also unlikely that the large-scale \ha line is powered by shock heating, at least not primarily. As model calculations suggested in the literature, shocks usually enhance those low ionization forbidden lines (Allen et al., 2008), which is opposite to the situation in J08385406. Certainly, conceptually there are still several other possibilities accounting for the absence of low-ionization emission lines on the large spatial scales, e.g., the suppression for low-ionization lines due to high ionization state, the low-metallicity of the gas, etc. But, low-metallicity gas is not common in the local Universe; the AGN of J08385406 is neither in a high ionization state nor seriously obscured (§4), unlike the AGN-powered cases in forms of either direct photoionization or shock heating (e.g., Fu & Stockton, 2009; Cai et al., 2016).
Summing up the above, we therefore conclude that the ionizing photons for the large-scale emission are mainly provided by the in situ star formation. According to the empirical relation (Kennicutt, 1998), the extended \ha emission requires merely a SFR of 0.01 yr-1.
7 The scenario: tidal accretion and merger
7.1 Creating the ring and extended \ha-emitting gas
As mentioned in §5, the ring shows a disperse shape on its south side in the sky. We note that some parts of the inner region of the ring are filled by the galactic disk component (see the HST FW160 image in Figure 4). Besides, the physical scale of the extended \ha emission is larger than the ring, and the bright spots in the extended \ha emission along the slit orientation are located interior to the ring. Plausibly, the extended \ha emission powered by in situ star formation, the faint galactic disk and the circumgalactic ring have a certain connection.
The kind of galactic rings that are not associated with galactic bars, either coplanar or not with the disk of the host galaxies, are collectively called collisional rings or polar rings. They are generally believed to be formed by a violent interaction (collision or merger) and/or the tidal accretion during such an interaction between two galaxies (Lynds & Toomre, 1976; Theys & Spiegel, 1976; Toomre, 1978; Bournaud & Combes, 2003; Mapelli & Mayer, 2012). Thus, the presence of the circumgalactic ring suggests that J08385406, unbarred and dominated by the bulge, once experienced a recent galactic interaction.
Here we propose a scenarios to explain the origin of the ring and the extended \ha-emitting gas, as well as the galactic disk perhaps, as follows. J08385406 has undergone a recent, violent interaction with an intruder galaxy. In the SDSS field of view around J08385406, we do not find any a galaxy can be (the remnant of) the intruder; this is not like the usual situation of collisional ring events (e.g., Liu et al., 2016). Thus the intruder much have been instead merged with the host (see, e.g., Bournaud & Combes 2003), becoming part of the bulge as in common major mergers. During the interaction/collision stage, as the numerical simulations of Bournaud & Combes (2003) suggested, the gas of the intruder is tidally accreted by the host galaxy and forms the ring. According to their simulations, the intruder should be gas-rich and of a comparable mass to J08385406. Then, in the merging stage, part of the stars of the intruder (or part of the stars of the host as well) is spread, forming the faint disk. Likewise, part of the gas of the intruder (or, secondarily, part of the gas of the host as well) is spread, which is the origin of the large-scale \ha-emitting gas.
As for the rotation-like pattern of the velocity offsets of the extended \ha emission, there are two possible explanations. One possibility is that the ionized gas traces the outflowing gas in galactic winds. The aforementioned violent galactic interaction triggers the star formation activities, which can produce galactic winds, as detected in various kinds of galaxies from ULIRGs to dwarf starburst galaxies (e.g., NGC1569; Martin et al. 2002). The outflowing gas might move outwards in close to perpendicular angles with respect to our line of sight, and thus the observed large-scale \ha emission would have only small blueshifts and redshifts. Yet galactic winds are seldom reported in galaxies with such red colors as J08385406. The other possibility (cf. Bournaud & Combes 2003), as we prefer, is that the extended \ha emission traces the large-scale gas that is formed by the tidal accretion/disruption from the intruder galaxy and that has an angular momentum as the rotation-like pattern suggests. The velocity profile of the extended \ha emission in J08385406 is similar to the large-scale rotation gaseous disks reported in the literature (e.g., Katkov et al., 2011). Thus this explanation fits in well the whole scenario we propose above.
7.2 Triggering the AGN?
It is interesting to think about the following question: How is the IMBH AGN triggered in such a red, old and (presumably) gas-poor galaxy? First of all, we should agree that, as current observations indicate, the majority—likely more than about two third—of low- IMBH AGNs (and almost all the AGNs in nearby galaxies, Ho 2008) are triggered by internal secular processes caused mainly by various instabilities of galactic disks and by nuclear star formation activities (Greene et al. 2008; Jiang et al. 2011; see Kormendy & Ho 2013 for a detailed review). That is, major merger is not the only way to break the ‘angular momentum barrier’ in the AGN fueling passage and trigger the AGN (Jogee, 2006). This is definitely the case for AGNs in local massive galaxies, because for galaxies of such masses () in the local Universe the frequency of ongoing/recent major majors is indeed small (Blanton & Moustakas, 2009), consistent with both the expectation of the hierarchical clustering theory and the observed “cosmic downsizing” phenomenon (Cowie et al., 1996) that most star formation and most AGN activity (Heckman & Best, 2014) now happen in relatively low-mass galaxies.
But, for low-mass galaxies in the local Universe, the major-merger frequency is much higher than the massive cousins. This is mainly because of the large number of low-mass galaxies, and secondarily because they are usually dragged by massive DM halos and thus close to each other, forming ‘groups’ of low-mass galaxies. Both factors are just as the hierarchical clustering theory expects actually (see §1; e.g., Deason et al. 2014). Recently, reported observational cases of dwarf-dwarf major mergers also have increased (e.g., Geha et al., 2005; Nidever et al., 2013; Crnojević et al., 2014; Amorisco et al., 2014; Paudel et al., 2015). Based on a sample of 104 dwarf galaxy pairs, Stierwalt et al. (2015) show that the star formation enhancement observed in massive galaxy pairs extends to the dwarf mass range also. Distorted H I morphologies and the presence of gaseous tails around star-bursting dwarf galaxies have also been attributed to wet major mergers (Nidever et al., 2013; Pearson et al., 2016). Again, all these observations are not inconsistent with the observed “cosmic downsizing”, but raise a long neglected phenomenon—wet major mergers/violent interactions between dwarf galaxies and their same effect onto star formation as their massive cousins did in their active epochs (at higher redshifts).
We can suppose that, like the aforementioned role in triggering star formation, wet major mergers/violent interactions of local gas-rich small galaxies play almost the same role in triggering AGN activity as their massive cousins plausibly did at high redshifts (e.g., ). The high- role is commonly believed in the co-evolution paradigm of supermassive BHs and their massive host galaxies in their quasar epoch (Kormendy & Ho, 2013). Then our proposed scenario for the ring and extended \ha-emitting gas can naturally explain the triggering of the AGN too. Certainly, we should bear in mind a second possibility: the co-occurrence of the recent major merger event and the AGN activity in J08385406 is just accidental, because neither the major-merger rate nor the AGN fraction is small in local low-mass galaxies. The conclusion cannot be drawn until well-defined comparisons are done in major-merger rate between galaxies with AGN activities and the same kind of galaxies without.
What we would like to stress again is that the incidence of major mergers and other violent interactions in local IMBH AGNs is not insignificant at all. According to the studies mentioned in §1 (Jiang et al. 2011, W.-J. Liu et al. 2017, in preparation), the fraction of such violent galaxy interactions in IMBH host galaxies is about 9–16%, which is much higher than in local massive galaxies. In fact, the above values are similar to the fraction of the radio-loud population in AGNs and to the fraction of broad-absorption-line (BAL) quasars; both radio-loud AGNs and BAL quasars have not been neglected for their not being the majority. We think that violent galaxy interactions in IMBH AGNs are also worth further investigations.
8 Summary and future work
J08385406 first caught our attention in the Dong et al. (2012) sample of 309 IMBH AGNs, as it is located at an extreme portion of the parameter space with certain peculiarities: host galaxy being rather red () for a total luminosity mag, and AGN belonging to the ten LINER 1s in the sample. In the present work, we carried out a detailed study with its HST images and MMT longslit spectroscopic data as well as the SDSS data. The analysis of the HST images indicates that J08385406 is an early-type galaxy: the disk is featureless, faint, and of low surface brightness ( mag arcsec-2) whereas the bulge is prominent, red (), relatively compact ( kpc) and accounts for % of the total light in the band. Interestingly, the HST images reveal a circumgalactic ring with a 16 kpc diameter. The ring is clear-cut and narrow on its north side but manifests a dispersed shape on its south side. More surprisingly, the MMT 2-dimensional longslit spectrum reveals large-scale \ha emission with a projected physical size of 20 kpc. The velocity profile of the extended \ha shows a rotation-like pattern, with a mean blueshifted velocity of 162 and mean redshifted velocity of 86 . Our photoionization calculations suggest that the AGN continuum powers the broad \ha emission line, the post-AGB stars power (part of) the normal-aperture narrow emission lines as indicated by the LINER-like narrow-line spectrum in terms of the BPT diagram, but neither is sufficient to further power the large-scale \ha emission. This is vindicated by the BPT diagnostic of the extended emission, which also disfavors any a kind of shock heating but indicates a star formation origin. We propose that both the ring and extended \ha-emitting gas are created by the tidal accretion in a collision event (and then merger) with a gas-rich galaxy of a comparable mass. Provided that wet major mergers (or other violent interactions) of present-day small galaxies play almost the same role in triggering AGN activity as their massive cousins supposedly did at high redshifts (namely the co-evolution of high- quasars and massive galaxies), then our proposed scenario can naturally explain the triggering of the IMBH AGN too. In summary, J08385406 is a good target to study the influence of violent galactic interactions on IMBH AGNs (plausibly) and on their (dwarf) host galaxies.
We are proposing deep and high-spatial-resolution observations in multiple bands to further investigate the concrete astrophysical processes at play in J08385406. IFU observations in the optical and near-infrared, particularly with AO-assisted, will obtain the spatially resolved kinematics of the host-galaxy stars, and the spatial distribution and kinematics of both the star formation and the large-scale warm gas. Radio aperture-synthesis observations of high spatial resolution (e.g., by JVLA, GMRT, and ALMA in particular) will reveals the spatial distribution and kinematics of the cold gas. Those observations will enable us to probe the spatial scales from the circumgalactic down to tens of parsecs from the nucleus, with a panoramic view. Meanwhile, as a straight step forward, it is exciting to find more systems like J08385406 and observationally census the frequency of violent galactic interactions in the dwarf-galaxy world generally, and in the dwarf-AGN world particularly.
We thank the anonymous referee for the thoughtful suggestions and comments with great expertise in spectral and imaging handlings that improved this paper significantly, and thank Chien Y. Peng, Hongyan Zhou, Weimin Gu, and Shaohua Zhang for their helpful discussions. This work is supported by National Basic Research Program of China (973 program No. 2015CB857101), the International Partnership Program of Chinese Academy of Sciences (Grant No. 114A11KYSB20160008), Natural Science Foundation of China grants (NSFC 11473062, 11603036, and 11603021), and the fundings from the Key Laboratory for the Structure and Evolution of Celestial Objects of Chinese Academy of Sciences (Grant No. OP201408) and the CAS Interdisciplinary Innovation Team. QL is supported by the FAST Fellowship. The FAST Fellowship is supported by Special Funding for Advanced Users, budgeted and administrated by Center for Astronomical Mega-Science, Chinese Academy of Sciences (CAMS). This work has made use of the data products of the SDSS and HST, and data taken by the MMT telescope through the Telescope Access Program (TAP). TAP is funded by the Strategic Priority Research Program “The Emergence of Cosmological Structures” (Grant No. XDB09000000), National Astronomical Observatories, Chinese Academy of Sciences, and the Special Fund for Astronomy from the Ministry of Finance. The MMT Observatory is a joint facility of the Smithsonian Institution and the University of Arizona.
References
- Acker et al. (1989) Acker, A., Köppen, J., Samland, M., & Stenholm, B. 1989, The Messenger, 58, 44
- Allen et al. (2008) Allen, M. G., Groves, B. A., Dopita, M. A., Sutherland, R. S., & Kewley, L. J. 2008, ApJS, 178, 20-55
- Amorisco et al. (2014) Amorisco, N. C., Evans, N. W., & van de Ven, G. 2014, Nature, 507, 335
- Baldwin et al. (1981) Baldwin, J. A., Phillips, M. M., & Terlevich, R. 1981, PASP, 93, 5
- Becker et al. (1995) Becker, R. H., White, R. L., & Helfand, D. J. 1995, ApJ, 450, 559
- Bentz et al. (2009) Bentz, M. C., Peterson, B. M., Netzer, H., Pogge, R. W., & Vestergaard, M. 2009, ApJ, 697, 160
- Binette et al. (1994) Binette, L., Magris, C. G., Stasińska, G., & Bruzual, A. G. 1994, A&A, 292, 13
- Blanton & Moustakas (2009) Blanton, M. R., & Moustakas, J. 2009, ARA&A, 47, 159
- Bournaud & Combes (2003) Bournaud, F., & Combes, F. 2003, A&A, 401, 817
- Bruzual & Charlot (2003) Bruzual, G., & Charlot, S. 2003, MNRAS, 344, 1000
- Cai et al. (2016) Cai, Z., Fan, X., Yang, Y., et al. 2016, arXiv:1609.04021 (submitted to ApJ)
- Cisternas et al. (2011) Cisternas, M., Jahnke, K., Inskip, K. J., et al. 2011, ApJ, 726, 57
- Cisternas et al. (2013) Cisternas, M., Gadotti, D. A., Knapen, J. H., et al. 2013, ApJ, 776, 50
- Cowie et al. (1996) Cowie, L. L., Songaila, A., Hu, E. M., & Cohen, J. G. 1996, AJ, 112, 839
- Conselice et al. (2014) Conselice, C. J., Bluck, A. F. L., Mortlock, A., Palamara, D., & Benson, A. J. 2014, MNRAS, 444, 1125
- Crnojević et al. (2014) Crnojević, D., Sand, D. J., Caldwell, N., et al. 2014, ApJ, 795, L35
- Deason et al. (2014) Deason, A., Wetzel, A., & Garrison-Kimmel, S. 2014, ApJ, 794, 115
- Dimitrijević et al. (2007) Dimitrijević, M. S., Popović, L. Č., Kovačević, J.,Dačić, M., & Ilić, D. 2007, MNRAS, 374, 1181
- Dong et al. (2005) Dong, X.-B., Zhou, H.-Y., Wang, T.-G., et al. 2005, ApJ, 620, 629
- Dong et al. (2007) Dong, X., Wang, T., Yuan, W., et al. 2007, ApJ, 657, 700
- Dong et al. (2008) Dong, X., Wang, T., Wang, J., et al. 2008, MNRAS, 383, 581
- Dong et al. (2012) Dong, X.-B., Ho, L. C., Yuan, W., et al. 2012, ApJ, 755, 167
- Elvis et al. (1994) Elvis, M., Wilkes, B. J., McDowell, J. C., et al. 1994, ApJS, 95, 1
- Fitzpatrick (1999) Fitzpatrick, E. L. 1999, PASP, 111, 63
- Fu & Stockton (2009) Fu, H., & Stockton, A. 2009, ApJ, 690, 953
- Gaskell & Ferland (1984) Gaskell, C. M., & Ferland, G. J. 1984, PASP, 96, 393
- Geha et al. (2005) Geha, M., Guhathakurta, P., & van der Marel, R. P. 2005, AJ, 129, 2617
- Gordon et al. (2003) Gordon, K. D., Clayton, G. C., Misselt, K. A., Landolt, A. U., & Wolff, M. J. 2003, ApJ, 594, 279
- Greene & Ho (2005a) Greene, J. E., & Ho, L. C. 2005, ApJ, 627, 721
- Greene & Ho (2005b) Greene, J. E., & Ho, L. C. 2005, ApJ, 630, 122
- Greene & Ho (2007) Greene, J. E., & Ho, L. C. 2007, ApJ, 670, 92
- Greene et al. (2008) Greene, J. E., Ho, L. C., & Barth, A. J. 2008, ApJ, 688, 159-179
- Gu (2015) Gu, W.-M. 2015, ApJ, 799, 71
- Halpern & Steiner (1983) Halpern, J. P., & Steiner, J. E. 1983, ApJ, 269, L37
- Heckman & Best (2014) Heckman, T. M., & Best, P. N. 2014, ARA&A, 52, 589
- Ho et al. (1997) Ho, L. C., Filippenko, A. V., & Sargent, W. L. W. 1997, ApJ, 487, 568
- Ho (2008) Ho, L. C. 2008, ARA&A, 46, 475
- Ho (2009) Ho, L. C. 2009, ApJ, 699, 626
- Hopkins & Hernquist (2006) Hopkins, P. F., & Hernquist, L. 2006, ApJS, 166, 1
- Into & Portinari (2013) Into, T., & Portinari, L. 2013, mnras, 430, 2715
- Ivezić et al. (2002) Ivezić, Ž., Menou, K., Knapp, G. R., et al. 2002, AJ, 124, 2364
- Jiang et al. (2011) Jiang, Y.-F., Greene, J. E., Ho, L. C., Xiao, T., & Barth, A. J. 2011, ApJ, 742, 68
- Jiang et al. (2013) Jiang, N., Ho, L. C., Dong, X.-B., Yang, H., & Wang, J. 2013, ApJ, 770, 3
- Jogee (2006) Jogee, S. 2006, Physics of Active Galactic Nuclei at all Scales, 693, 143
- Kaspi et al. (2000) Kaspi, S., Smith, P. S., Netzer, H., Maoz, D., Jannuzi, B. T., & Giveon, U. 2000, ApJ, 533, 631
- Katkov et al. (2011) Katkov, I. Y., Moiseev, A. V., & Sil’chenko, O. K. 2011, ApJ, 740, 83
- Kauffmann et al. (2003a) Kauffmann, G., et al. 2003a, MNRAS, 341, 33
- Kauffmann et al. (2003b) Kauffmann, G., Heckman, T. M., Tremonti, C., et al. 2003b, MNRAS, 346, 1055
- Kennicutt (1998) Kennicutt, R. C., Jr. 1998, ARA&A, 36, 189
- Kewley et al. (2004) Kewley, L. J., Geller, M. J., & Jansen, R. A. 2004, AJ, 127, 2002
- Kewley et al. (2006) Kewley, L. J., Groves, B., Kauffmann, G., & Heckman, T. 2006, MNRAS, 372, 961
- Kim et al. (2008) Kim, M., Ho, L. C., Peng, C. Y., Barth, A. J., & Im, M. 2008, ApJS, 179, 283-305
- Kocevski et al. (2012) Kocevski, D. D., Faber, S. M., Mozena, M., et al. 2012, ApJ, 744, 148
- Kormendy & Kennicutt (2004) Kormendy, J., & Kennicutt, R. C., Jr. 2004, ARA&A, 42, 603
- Kormendy & Ho (2013) Kormendy, J., & Ho, L. C. 2013, ARA&A, 51, 511
- Kormendy (2016) Kormendy, J. 2016, Galactic Bulges, 418, 431
- Liu et al. (2016) Liu, W.-J., Zhou, H.-Y., Jiang, N., et al. 2016, ApJ, 822, 64
- Lu et al. (2006) Lu, H., Zhou, H., Wang, J., et al. 2006, AJ, 131, 790
- Lynds & Toomre (1976) Lynds, R., & Toomre, A. 1976, ApJ, 209, 382
- Mapelli & Mayer (2012) Mapelli, M., & Mayer, L. 2012, MNRAS, 420, 1158
- Martin et al. (2002) Martin, C. L., Kobulnicky, H. A., & Heckman, T. M. 2002, ApJ, 574, 663
- Martin et al. (2007) Martin, D. C., Wyder, T. K., Schiminovich, D., et al. 2007, ApJS, 173, 342
- Mor et al. (2009) Mor, R., Netzer, H., & Elitzur, M. 2009, ApJ, 705, 298
- Nidever et al. (2013) Nidever, D. L., Ashley, T., Slater, C. T., et al. 2013, ApJ, 779, L15
- Osterbrock & Ferland (2006) Osterbrock, D. E., & Ferland, G. J. 2006, Astrophysics of gaseous nebulae and active galactic nuclei, 2nd. ed. by D.E. Osterbrock and G.J. Ferland. Sausalito, CA: University Science Books, 2006
- Paudel et al. (2015) Paudel, S., Duc, P. A., & Ree, C. H. 2015, AJ, 149, 114
- Pearson et al. (2016) Pearson, S., Besla, G., Putman, M. E., et al. 2016, MNRAS, 459, 1827
- Peng et al. (2002) Peng, C. Y., Ho, L. C., Impey, C. D., & Rix, H.-W. 2002, AJ, 124, 266
- Peng et al. (2010) Peng, C. Y., Ho, L. C., Impey, C. D., & Rix, H.-W. 2010, AJ, 139, 2097
- Schlegel et al. (1998) Schlegel, D. J., Finkbeiner, D. P., & Davis, M. 1998, ApJ, 500, 525
- Sérsic (1968) Sérsic, J. L. 1968, Cordoba, Argentina: Observatorio Astronomico, 1968
- Singh et al. (2013) Singh, R., van de Ven, G., Jahnke, K., et al. 2013, A&A, 558, A43
- Stierwalt et al. (2015) Stierwalt, S., Besla, G., Patton, D., et al. 2015, ApJ, 805, 2
- Storey & Zeippen (2000) Storey, P. J., & Zeippen, C. J. 2000, MNRAS, 312, 813
- Strateva et al. (2001) Strateva, I., Ivezić, Ž., Knapp, G. R., et al. 2001, AJ, 122, 1861
- Theys & Spiegel (1976) Theys, J. C., & Spiegel, E. A. 1976, ApJ, 208, 650
- Toomre (1978) Toomre, A. 1978, Large Scale Structures in the Universe, 79, 109
- van der Wel et al. (2012) van der Wel, A., Bell, E. F., Häussler, B., et al. 2012, ApJS, 203, 24
- Walsh et al. (2010) Walsh, J. L., Barth, A. J., & Sarzi, M. 2010, ApJ, 721, 762
- Wang et al. (2013) Wang, Q. D., Nowak, M. A., Markoff, S. B., et al. 2013, Science, 341, 981
- Wang et al. (2009) Wang, J.-G., Dong, X.-B., Wang, T.-G., et al. 2009, ApJ, 707, 1334
- Xiao et al. (2011) Xiao, T., Barth, A. J., Greene, J. E., et al. 2011, ApJ, 739, 28
- Younes et al. (2012) Younes, G., Porquet, D., Sabra, B., Reeves, J. N., & Grosso, N. 2012, A&A, 539, A104
| Emission Line | CentroidaaVacuum restframe wavelength. | FWHMbbCorrected for instrumental broadening. | Flux |
|---|---|---|---|
| Å | 10-17 erg s-1 cm-2 | ||
| [O II] | 3728.150.19 | 52846 | 21714 |
| H(broad)ccAdopting the profile of the broad component of H. | 4867.07 | 2814 | 8113 |
| H(narrow)ddAdopting the profile of the narrow component of H. | 4862.42 | 475 | 935 |
| [O III] | 5008.640.42 | 47473 | 758 |
| [O I] | 6300.950.37 | 54835 | 1115 |
| [O I]eeAdopting the profile of [O I]6300. | 6364.44 | 548 | 434 |
| H(broad) | 6570.531.22 | 2814210 | 28622 |
| H(narrow) | 6564.210.07 | 47610 | 43813 |
| H(N branch) | 6561.071.00 | 16213 | 280.8 |
| H(S branch) | 6566.491.00 | 1289 | 330.8 |
| [N II] | 6583.040.52 | 46948 | 688 |
| [S II] | 6717.360.54 | 46537 | 1274 |
| [S II]ffAdopting the profile of [S II]6716. | 6731.74 | 465 | 1034 |
| PSF | Bulge | Disk | Ring | |||||||||||
| Band | ||||||||||||||
| (″/kpc) | (″/kpc) | |||||||||||||
| (1) | (2) | (3) | (4) | (5) | (6) | (7) | (8) | (9) | (10) | (11) | (12) | |||
| HST F555W | 21.45 | 14.11 | 1.83 | 18.61 | 16.95 | 0.48/0.28 | 18.52 | 17.04 | 0.92/0.54 | 21.21 | 14.35 | |||
| HST F814W | 21.00 | 14.56 | 4.00 | 16.58 | 18.98 | 0.93/0.55 | 18.26 | 17.30 | 1.03/0.61 | |||||
| HST F160W | 18.83 | 16.73 | 3.29 | 15.07 | 20.49 | 0.63/0.37 | 16.97 | 18.59 | 1.13/0.67 | 17.91 | 17.65 | |||
-
•
Col (1): HST filter.
-
•
Col (2): the integrated magnitudes on the Vega system for PSF component, not corrected for Galactic extinction.
-
•
Col (3): the absolute magnitude for PSF component after Galactic extinction correction.
-
•
Col (4): the Sérsic index.
-
•
Col (5): the integrated magnitudes on the Vega system for bulge component, not corrected for Galactic extinction.
-
•
Col (6): the absolute magnitude for Sérsic component after Galactic extinction correction.
-
•
Col (7): the effective radius of the Sérsic component in unit of arcseconds and the corresponding scale length in unit of kpc.
-
•
Col (8): the integrated magnitudes on the Vega system for disk component, not corrected for Galactic extinction.
-
•
Col (9): the absolute magnitude for disk component after Galactic extinction correction.
-
•
Col (10): the effective radius of the disk component in unit of arcseconds and the corresponding scale length in unit of kpc.
-
•
Col (11): the integrated magnitudes on the Vega system for the outer ring, not corrected for Galactic extinction. The ring magnitude is derived from the residual images.
-
•
Col (12): the absolute magnitude for the outer ring component after Galactic extinction correction.
-
•
a The decomposition result of HST F814W is taken from Jiang et al. (2011).