Discovery of a very bright and intrinsically very luminous, strongly lensed Lyman alpha emitting galaxy at z=2.82 in the BOSS EMISSION-LINE LENS SURVEY†
Abstract
We report the discovery of a very bright (), highly magnified, and yet intrinsically very luminous Ly emitter (LAE) at . This system comprises four images in the observer plane with a maximum separation of and it is lensed by a massive early-type galaxy. It was initially identified in the Baryon Oscillation Spectroscopic Survey (BOSS) Emission-Line Lens Survey for GALaxy-Ly EmitteR sYstems (BELLS GALLERY) survey, and follow-up imaging and spectroscopic observations using the Gran Telescopio Canarias (GTC) and William Herschel Telescope (WHT) confirmed the lensing nature of this system. A lens model using a singular isothermal ellipsoid in an external shear field reproduces quite well the main features of the system, yielding an Einstein radius of 295 010, and a total magnification factor for the LAE of . This LAE is one of the brightest and most luminous galaxy-galaxy strong lenses known. We present initial imaging and spectroscopy showing the basic physical and morphological properties of this lensed system.
Subject headings:
cosmology: observations — galaxies: evolution — gravitational lensing: strong — galaxies: individual (BG1429+1202)1. Introduction
The study of the physical properties of typical high-redshift galaxies has been limited by their faintness ( at ), even for 8-/10-m class telescopes. Over the past years the properties of these high-redshift galaxies have been studied by building large samples of hundreds to thousands individual spectra to construct high signal-to-noise (S/N) composite spectra (e.g. Shapley et al., 2003). Although these techniques have been very successful, they require a large amount of observing time and only probe the average physical properties of these galaxies. Another way to study in detail high-redshift galaxies is using the fortuitous alignments with foreground massive structures which provide natural magnification and associated amplification produced by strong gravitational lensing. Hundreds of strongly lensed galaxies have been discovered in the last years employing various observational techniques, mainly from optical to radio. However, only a handful of optically very bright (), strongly magnified high-redshift galaxies, have been discovered so far (Yee et al., 1996; Allam et al., 2007; Smail et al., 2007; Belokurov et al., 2007; Lin et al., 2009; Dahle et al., 2016) allowing detailed spectroscopic studies of their individual properties, such as stellar populations, chemical composition, and kinematics of the interstellar medium (e.g., Pettini et al., 2000, 2002; Quider et al., 2009, 2010; Dessauges-Zavadsky et al., 2010).
In this Letter, we report the discovery of a bright () quadruply gravitationally lensed Ly emitter (LAE). We provide the first physical and morphological analysis of the lensing galaxy and the lensed LAE. Throughout the Letter, we adopt a cosmology with , and km s-1 Mpc-1. All quoted magnitudes are in the AB system.
2. Discovery and follow-up
In the past years, by searching for secondary emission lines in the spectra of massive elliptical galaxies within the database of the Sloan Digital Sky Survey (SDSS: York et al., 2000), the Sloan Lens ACS Survey (SLACS: e.g., Bolton et al., 2006, 2008), and the Baryon Oscillation Spectroscopic Survey (BOSS) Emission-Line Lens Survey (BELLS: Brownstein et al., 2012) have discovered over 100 lensed star-forming galaxies at moderate redshifts (). Very recently, by applying spectroscopic selection techniques similar to SLACS and BELLS, but adapted to high-redshift Ly emission, Shu et al. (2016a) identified a new sample of 187 high-probability lensed LAE candidate systems at 2 3, the BOSS Emission-Line Lens Survey for GALaxy-Ly EmitteR sYstems (BELLS GALLERY) survey, selected from the final data release (DR12) of the BOSS (Dawson et al., 2013) of the SDSS-III (Eisenstein et al., 2011). Of these, 21 highest-quality candidates were recently observed with the Hubble Space Telescope (HST) and the first results were presented in Shu et al. (2016b).
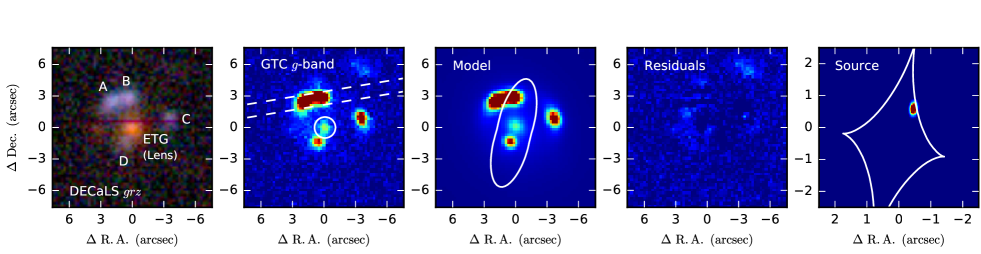
By visual inspection of SDSS and DECaLS666Dark Energy Camera Legacy Survey: http://legacysurvey.org/decamls/ color images of the BELLS GALLERY sample, we found one candidate showing bluish features 33 from the massive early-type galaxy, SDSS J142954.80+120235.6 (hereafter ETG). Its BOSS spectrum (Plate-MJD-Fiber: 5463-56003-121) shows a secondary emission line at (Ly at ; Shu et al., 2016a). The positions of the bluish features with respect to the ETG are consistent with a lensing configuration: a bright lensed image pair, A and B (with a separation of 15), and two fainter images, C and D (see Fig. 1). The lensed image pair, A and B, is identified in SDSS as a single source, SDSS J142954.88+120238.3 (hereafter BG1429+1202 for the lensed LAE, where BG stands for BELLS GALLERY), showing blue colors in DECaLS and SDSS bands (Table 1). The lensed A and B images are also detected in the UKIRT Infrared Deep Sky Survey (UKIDSS: Lawrence et al., 2007) Large Area Survey (LAS), only in Y-band with mag and mag, respectively.
We carried out Director Discretionary Time (DDT) for optical imaging and long-slit spectroscopic observations on 2016 June 29 using the Auxiliary-port Camera (ACAM: Benn et al., 2008) at the William Herschel Telescope (WHT) to confirm the lensing nature of this LAE. The ACAM long-slit was oriented at sky position angle (PA) = , and positioned so as to encompass the two brightest lensed images, A and B, as shown in Fig. 1. Despite the bad seeing conditions that night ( FWHM), we could confirm the lensing nature of this system with the detection in the long-slit spectrum of strong rest-frame UV continuum (with Si iv and C iv in absorption) and Ly emission at a redshift , in agreement with the redshift of the Ly detected in the BOSS fiber spectrum, likely from the lensed image D (see Fig. 1).
| ID | R.A.(1) | Dec.(1) | |||
| (J2000.0) | (J2000.0) | ||||
| ETG | 14:29:54.806 | +12:02:35.53 | 22.88 | 20.51 | 19.00 |
| A(5) | 14:29:54.936 | +12:02:38.23 | 21.48 | 21.23 | 21.32 |
| B(5) | 14:29:54.831 | +12:02:38.48 | 21.64 | 21.34 | 21.31 |
| C | 14:29:54.570 | +12:02:36.69 | 22.27 | 22.22 | 22.02 |
| D | 14:29:54.848 | +12:02:34.24 | 22.57 | 22.30 | 21.85 |
| Total LAE | 20.40 | 20.16 | 20.07 |
Note. — positions with 011 astrometric r.m.s. using GAIA DR1 (Gaia Collaboration et al., 2016);
photometry and 1 errors from the GTC/OSIRIS -band image; and photometry
and 1 errors from the DECaLS DR2 Tractor catalog, except for the lens which were taken from the SDSS DR12
due to image artifacts in DECaLS co-adds, and the lensed images A and B were deblended using GALFIT
(Peng et al., 2002). The magnitudes listed have not been corrected for the Galactic dust extinction, which is 0.104, 0.072,
and 0.040 mag for , , and , respectively (Schlafly & Finkbeiner, 2011).
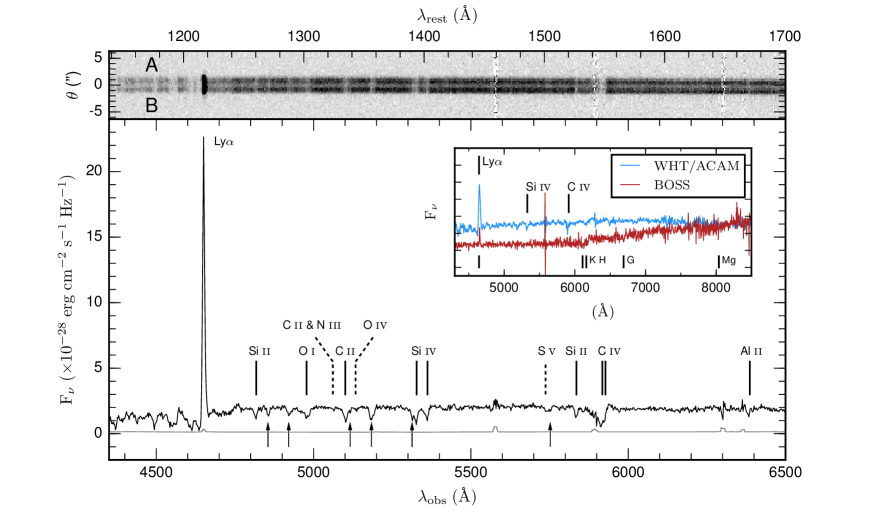
We observed again BG1429+1202 on 2016 July 29, this time in very good seeing conditions (075 FWHM, measured in the 330 s -band acquisition image), using the Optical System for Imaging and low-Intermediate-Resolution Integrated Spectroscopy camera (OSIRIS777http://www.gtc.iac.es/instruments/osiris/) on the Gran Telescopio Canarias (GTC). We used the R1000B grism, which provides a spectral coverage of 3630 - 7500 (950 - 1960 , rest-frame) and a dispersion of 2.12 px-1. The OSIRIS 12 wide long-slit was oriented in the same PA used in the WHT/ACAM spectroscopic observations (Fig. 1). Given this configuration, the corresponding spectral resolution is (or km s-1 FWHM). The total integration time was 44 minutes, split into 4 660 s. The data were reduced with iraf and python tasks.
3. Analysis and Discussion
3.1. Source Properties
The rest-frame UV spectrum of the brightest lensed images A and B, is shown in Fig. 2. Despite the relatively short exposure time, the achieved high S/N GTC/OSIRIS spectrum ( in the continuum) shows a strong Ly emission, and a series of strong absorption lines, similar to those seen in the composite spectrum of hundreds Lyman break galaxies (LBGs) (Shapley et al., 2003). The strongest absorption features are associated to the interstellar medium and stellar winds in a variety of ionization states, from neutral (O i) to highly ionized species (Si iv or C iv). High ionization features with a strong P Cygni profile are seen both in C iv , 1550 and Al iii , 1862 doublets, which is indicative of stellar winds from very young massive stars. However, we identify additional absorption features unrelated to BG1429+1202 (nine absorption features associated to an intervening metal-line system at 2.179 0.001, and one broad absorption line at with an observed equivalent width remains unidentified). Analysis of the spectra for the individual lensed images A and B shows no differences in the profiles of the absorption features neither evidence for velocity offsets between them, as expected if they are both images of the same background source. The same happens to their rest-frame UV slope, , which is essentially flat in . Adopting a simple power-law approximation for the UV spectral range and using the observed and magnitudes ( - rest-frame), we derive , which implies an effective UV extinction or , reflecting modest dust content (Calzetti et al., 2000).
We identified several photospheric absorption features, from which we derived the systemic redshift 2.8224 0.0013 using the cleanest among them: O iv , and a close blend of C ii and N iii at .
The Ly emission line has an observed (A + B) flux of erg s-1 cm-2, much higher than the Ly flux measured within the -radius BOSS fibre ( erg s-1 cm-2). The measured rest-frame equivalent width of Ly is . The errors reflect the uncertainty in the determination of the stellar continuum redward of Ly. Although the line appears unresolved in our low resolution spectrum ( km s-1), it is resolved in the BOSS spectrum. Fitting a Gaussian to the BOSS Ly line, we measured a FWHM of km s-1, after accounting for the instrumental broadening. The nebular C iii] 1906, 1908 doublet is also detected in emission but with low significance () and not resolved in our GTC/OSIRIS spectrum. This galaxy can be classified as a LAE, given the rest-frame equivalent width and the velocity width of the Ly line (e.g., Ouchi et al., 2008). From our spectrum and available photometric data we do not detect evidence of any AGN contribution. However, a more extensive characterization awaits higher spatial resolution imaging and multi-wavelength photometry.
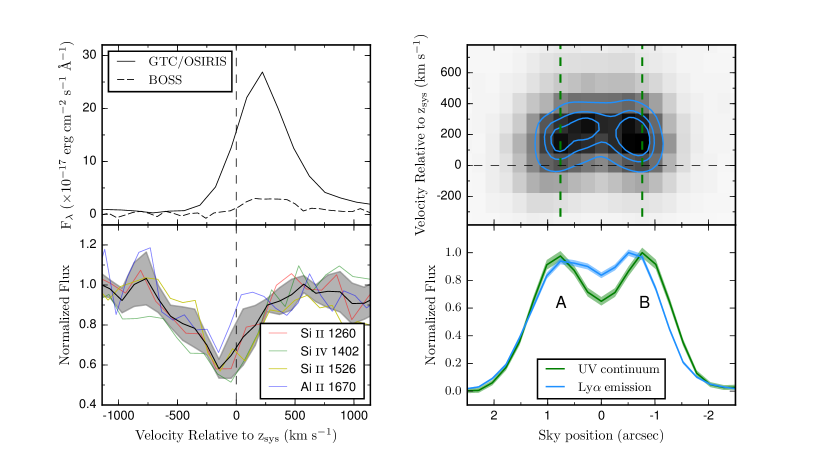
A careful analysis of the kinematics goes beyond the present Letter given the low spectral resolution of these data. However, the high S/N of the GTC/OSIRIS spectrum allows us to detect differences in the kinematics of the Ly emission and interstellar features. Fig. 3 (left panel) shows velocity plots of the Ly emission line and several normalized interstellar absorption lines, relative to . The Ly emission has its peak redshifted with a velocity km s-1, while the interstellar absorption lines appear blueshifted by km s-1, which is consistent with galaxy-scale outflows of material from the galaxy in the form a wind, similar to those seen in other star-forming galaxies at (Shapley et al., 2003).
We also notice that a spatial gradient of the Ly velocity is present in the 2D spectrum (Fig. 3, right upper panel). This velocity structure is seen both in A and B but appears mirrored, as expected for those images in this system as A and B images straddle the fold critical curve (see figure 1). We checked carefully the 2D spectrum to see if this pattern is present in other lines, but we found none with this signature. The 1D spatial distribution of Ly is also compared with that of the rest-frame UV continuum (Fig. 3, right lower panel). The Ly emission appears more extended in the inner region between A and B, than the UV continuum. Deeper and higher spatial resolution observations are needed to constrain the Ly and UV continuum spatial distributions.
3.2. Lens Model
To interpret the properties of the lensed system in more detail, we used the 330 s GTC/OSIRIS -band image obtained in FWHM seeing for accurate lens modeling. As shown in Fig. 1, the lens system comprises four images forming a so-called configuration, when the source lies very close to a caustic. Similar to previous works (Bolton et al., 2008; Brownstein et al., 2012; Shu et al., 2015, 2016b, 2016c), we have developed a lens model using a non-linear optimizer, consisting on minimizing a function using the Levenberg-Marquardt algorithm with the LMFIT package (Newville et al., 2014), where the observational data is compared to the model (see Shu et al., 2016b, for details). The foreground-light is modeled using the elliptical Sérsic profile and similar to Shu et al. (2015, 2016b, 2016c) its subtraction is performed jointly with the lens modeling. The lens model includes a mass distribution of the foreground lens parameterized as a singular isothermal ellipsoid (SIE), and an additional external shear is included to model the higher-order effect from the environment. The surface brightness distribution of the background source is reconstructed parametrically using an elliptical Sérsic model. The foreground-light model is combined with the predicted lensed images and convolved with the point-spread function (PSF) which was modeled with a star in the GTC/OSIRIS -band field-of-view.
The best fit lens model () predicts for the lens an Einstein radius 295010, minor-to-major axis ratio and a position angle deg. The strength and position angle of the external shear is and deg, respectively. The characteristic lensing velocity dispersion defined as is 6 km s-1, where and are the angular diameter distances from the lens and the observer to the source, respectively. We also find a minor-to-major axis ratio of the SIE component (0.34), smaller than that of the light distribution suggested by the -band model result (0.85). The lensing velocity dispersion suggests that cluster or line-of-sight structures also contribute a substantial fraction of convergence. There is no clear evidence of a crowded environment around the ETG, either by visual inspection of color images or in the SDSS photometric redshifts, but to the North there is a galaxy, SDSS J142953.71+120333.9, with a BOSS spectroscopic redshift , very close to the lensing ETG, indicating that a cluster or group of galaxies at may be present, as suggested by the external shear field.
For the source, the lens model gives local magnifications of 3.2, 3.1, 1.8 and 0.7 for images A, B, C and D, respectively, which means that the total magnification is . The source has an effective radius 0159 0007, which corresponds to kpc for the adopted cosmology. The source has a minor-to-major axis ratio and Sérsic index . It is centered at -043 and 056 relative to the center of the lens galaxy.
3.3. Intrinsic Properties
Having determined the magnification of the LAE we can estimate its intrinsic properties. From the total DECaLS DR2 -band magnitude, we determine a rest-frame 1600 luminosity erg s-1 Hz-1. Using the Kennicutt’s (1998) conversion, this rest-frame UV luminosity translates into an intrinsic star formation rate (SFR) of yr-1, when corrected for magnification, reddening and the lower proportion of low-mass stars in the Chabrier (2003) stellar IMF relative to the standard Salpeter (1955) adopted by Kennicutt (a factor of ). Turning to Ly, assuming the space distribution of Ly in the source plane and its lensing magnification are similar to that of the rest-frame UV continuum, and applying the correction for the magnification and the slit losses (the GTC/OSIRIS slit captured a fraction of the total light of BG1429+1202), we derive an intrinsic Ly luminosity erg s-1. Assuming case-B recombination and the Kennicutt’s (1998) conversion, this luminosity translates in a yr-1. Comparing the estimates of SFR from the rest-frame UV and Ly, we measure , consistent with that estimated from LAEs at (e.g., Zheng et al., 2016; Verhamme et al., 2008). However, we should note that the measured results from the assumption that the spatial distribution of Ly (and its magnification) follows the rest-frame UV continuum. Ly halos are hard to be resolved from individual LAEs, and have been studied mainly by using stacking techniques (Steidel et al., 2011; Momose et al., 2016), or in nearby high-redshift analogs (e.g. Yang et al., 2016). However, for a few cases, strong gravitational lensing allows spatially resolved studies of high-redshift galaxies (e.g., Patrício et al., 2016). A more detailed analysis will be possible with high-resolution narrow-band imaging and integral field spectroscopy.
| Object | z | Reference | ||||
| () | ( erg s-1 Hz-1) | ( erg s-1) | ||||
| BG1429+1202 | 2.822 | 20.16 | 8.8 | 6.99 | 28.0 | – |
| MS 1512-cB58 | 2.726 | 20.64 | 30 | 1.16 | – | 1,2 |
| Cosmic Eye | 3.073 | 20.30 | 28 | 2.08 | – | 3 |
| 8 o’clock | 2.735 | 19.22 | 12.3 | 10.55 | – | 4 |
| Cosmic Horseshoe | 2.381 | 19.70 | 24 | 2.74 | 3.3 | 5,6 |
| LBGs | 24.61 | – | 1.06 | – | 7 | |
| LAEs | 25.84 | – | 0.36 | 5.8 | 8 |
Note. — (a) rest-frame UV apparent magnitudes from - or -band, depending on the redshift;
(b) total magnification factor; (c) and (d) intrinsic rest-frame UV and luminosity,
respectively, corrected from the lensing magnification;
References. — (1) Ellingson et al. (1996); (2) Seitz et al. (1998); (3) Smail et al. (2007); (4) Allam et al. (2007); (5) Belokurov et al. (2007); (6) Quider et al. (2009);
(7) Reddy & Steidel (2009); (8) Ouchi et al. (2008).
In order to establish how typical are the intrinsic properties of this galaxy, we compare it with other UV-selected LBGs and LAEs. BG1429+1202 is intrinsically more luminous in the rest-frame UV by a factor of and , relatively to from the luminosity functions of Reddy & Steidel (2009) for LBGs and LAEs selected by narrow-band imaging by Ouchi et al. (2008), respectively. It is also intrinsically very luminous in emission, when compared with from the luminosity functions of LAEs at (factor of ; Ouchi et al., 2008) and LAEs at in CDFS (factor of ; Zheng et al., 2016).
A comparison is presented in table 2 with other well known, exceptionally bright in the optical, galaxy-galaxy lenses: the Cosmic Eye (Smail et al., 2007), MS 1512-cB58 (Yee et al., 1996), the 8 o’clock (Allam et al., 2007), and at lower redshift the Cosmic Horseshoe (Belokurov et al., 2007). BG1429+1202 has similar brightness but is intrinsically very luminous in the rest-frame UV continuum and . It is also the only one emitter (the line of the Cosmic Horseshoe galaxy shares many of the properties of the emitters, but its is below the threshold generally adopted to define it as emitter; Quider et al., 2009). This puts BG1429+1202 in the small group of very bright galaxies that, due to the high magnification and its high intrinsic luminosity, their brightness provides the unique opportunity to obtain high S/N spectroscopy to study in detail its physical properties.
4. Conclusion
In this Letter, we report the discovery of a bright quadruply lensed LAE at . The very bright apparent magnitude results partially from gravitational lensing by a luminous red galaxy, which provides a magnification of . After accounting for the lensing magnification, BG1429+1202 is also intrinsically very luminous in the rest-frame UV and Ly emission by about 19 and 5 times the typical and of LAEs at , respectively, showing low dust content and indications of massive recent star formation. Compared with the few well known strongly lensed galaxies, it is the most luminous one in the Ly line. This makes this source another good laboratory for further detailed studies of the physics of star formation and Ly emission in galaxies during the cosmic epoch of star formation. The new method presented in Shu et al. (2016a, b) and in this work opens a new window to the study of high redshift galaxies by the combination of massive spectroscopic surveys, large-area multi-band imaging, gravitational lensing and follow-up with 10 m telescopes like GTC.
References
- Allam et al. (2007) Allam, S. S., Tucker, D. L., Lin, H., et al. 2007, ApJ, 662, L51
- Belokurov et al. (2007) Belokurov, V., Evans, N. W., Moiseev, A., et al. 2007, ApJ, 671, L9
- Benn et al. (2008) Benn, C., Dee, K., & Agócs, T. 2008, Proc. SPIE, 7014, 70146X
- Bolton et al. (2006) Bolton, A. S., Burles, S., Koopmans, L. V. E., Treu, T., & Moustakas, L. A. 2006, ApJ, 638, 703
- Bolton et al. (2008) Bolton, A. S., Burles, S., Koopmans, L. V. E., et al. 2008, ApJ, 682, 964
- Brownstein et al. (2012) Brownstein, J. R., Bolton, A. S., Schlegel, D. J., et al. 2012, ApJ, 744, 41
- Calzetti et al. (2000) Calzetti, D., Armus, L., Bohlin, R. C., et al. 2000, ApJ, 533, 682
- Chabrier (2003) Chabrier, G. 2003, PASP, 115, 763
- Dahle et al. (2016) Dahle, H., Aghanim, N., Guennou, L., et al. 2016, A&A, 590, L4
- Dawson et al. (2013) Dawson, K. S., Schlegel, D. J., Ahn, C. P., et al. 2013, AJ, 145, 10
- Dessauges-Zavadsky et al. (2010) Dessauges-Zavadsky, M., D’Odorico, S., Schaerer, D., et al. 2010, A&A, 510, A26
- Eisenstein et al. (2011) Eisenstein, D. J., Weinberg, D. H., Agol, E., et al. 2011, AJ, 142, 72
- Ellingson et al. (1996) Ellingson, E., Yee, H. K. C., Bechtold, J., & Elston, R. 1996, ApJ, 466, L71
- Gaia Collaboration et al. (2016) Gaia Collaboration, Brown, A. G. A., Vallenari, A., et al. 2016, ArXiv e-prints, arXiv:1609.04172
- Kennicutt’s (1998) Kennicutt, Jr., R. C. 1998, ApJ, 498, 541
- Lawrence et al. (2007) Lawrence, A., Warren, S. J., Almaini, O., et al. 2007, MNRAS, 379, 1599
- Lin et al. (2009) Lin, H., Buckley-Geer, E., Allam, S. S., et al. 2009, ApJ, 699, 1242
- Newville et al. (2014) Newville, M., Stensitzki, T., Allen, D. B., & Ingargiola, A. 2014, LMFIT: Non-Linear Least-Square Minimization and Curve-Fitting for Python¶, doi:10.5281/zenodo.11813
- Momose et al. (2016) Momose, R., Ouchi, M., Nakajima, K. , et al. 2016, MNRAS, 457, 2318
- Ouchi et al. (2008) Ouchi, M., Shimasaku, K., Akiyama, M., et al. 2008, ApJS, 176, 301
- Patrício et al. (2016) Patrício, V., Richard, J., Verhamme, A., et al. 2016, MNRAS, 456, 4191
- Peng et al. (2002) Peng, C. Y., Ho, L. C., Impey, C. D., & Rix, H.-W. 2002, AJ, 124, 266
- Pettini et al. (2000) Pettini, M., Steidel, C. C., Adelberger, K. L., Dickinson, M., & Giavalisco, M. 2000, ApJ, 528, 96
- Pettini et al. (2002) Pettini, M., Rix, S. A., Steidel, C. C., et al. 2002, ApJ, 569, 742
- Quider et al. (2009) Quider, A. M., Pettini, M., Shapley, A. E., & Steidel, C. C 2009, MNRAS, 398, 1263
- Quider et al. (2010) Quider, A. M., Shapley, A. E., Pettini, M., Steidel, C. C., & Stark, D. P. 2010, MNRAS, 402, 1467
- Reddy & Steidel (2009) Reddy, N. A., & Steidel, C. C. 2009, ApJ, 692, 778
- Salpeter (1955) Salpeter, E. E. 1955, ApJ, 121, 161
- Schlafly & Finkbeiner (2011) Schlafly, E. F., & Finkbeiner, D. P. 2011, ApJ, 737, 103
- Seitz et al. (1998) Seitz, S., Saglia, R. P., Bender, R., et al. 1998, MNRAS, 298, 945
- Shapley et al. (2003) Shapley, A. E., Steidel, C. C., Pettini, M., & Adelberger, K. L. 2003, ApJ, 588, 65
- Shu et al. (2015) Shu, Y., Bolton, A. S., Brownstein, J. R., et al. 2015, ApJ, 803, 71
- Shu et al. (2016a) Shu, Y., Bolton, A. S., Kochanek, C. S., et al. 2016a, ApJ, 824, 86
- Shu et al. (2016b) Shu, Y., Bolton, A. S., Mao, S., et al. 2016b, ArXiv e-prints, arXiv:1608.08707
- Shu et al. (2016c) Shu, Y., Bolton, A. S., Moustakas, L. A., et al. 2016c, ApJ, 820, 43
- Smail et al. (2007) Smail, I., Swinbank, A. M., Richard, J., et al. 2007, ApJ, 654, L33
- Steidel et al. (2011) Steidel, C. C., Bogosavljević, M., Shapley, A. E., et al. 2011, ApJ, 736, 160
- Verhamme et al. (2008) Verhamme, A., Schaerer, D., Atek, H., & Tapken, C. 2008, A&A, 491, 89
- Yang et al. (2016) Yang, H., Malhotra, S., Rhoads, J. E., et al. 2016, ArXiv e-prints, arXiv:1610.05767
- Yee et al. (1996) Yee, H. K. C., Ellingson, E., Bechtold, J., Carlberg, R. G., & Cuillandre, J.-C. 1996, AJ, 111, 1783
- York et al. (2000) York, D. G., Adelman, J., Anderson, Jr., J. E., et al. 2000, AJ, 120, 1579
- Zheng et al. (2016) Zheng, Z.-Y., Malhotra, S., Rhoads, J. E., et al. 2016, ApJS, 226, 23