Heterogeneous morphology and dynamics of polyelectrolyte brush condensates in trivalent counterion solution
Abstract
Recent experiments have shown that trivalent ion, spermidine3+, can provoke lateral microphase segregation in DNA brushes. Using molecular simulations and simple theoretical arguments, we explore the effects of trivalent counterions on polyelectrolyte brushes. At a proper range of grafting density, polymer size, and ion concentration, the brush polymers collapse heterogeneously into octopus-like surface micelles. Remarkably, the heterogeneity in brush morphology is maximized and the relaxation dynamics of chain and condensed ion are the slowest at the 1:3 stoichiometric concentration of trivalent ions to polyelectrolyte charge. A further increase of trivalent ion concentration conducive to a charge inversion elicits modest reswelling and homogenizes the morphology of brush condensate. Our study provides a new insight into the origin of the diversity in DNA organization in cell nuclei as well as the ion-dependent morphological variation in polyelectrolyte brush layer of biological membranes.
Polyelectrolyte brushes are ubiquitous in biological systems. As the main component of outer membrane in Gram-negative bacteria, lipopolysaccharides, consisting of charged O-polysaccharides side chains, form a brush layer and mediate the interaction of bacteria with their environment Schneck et al. (2009). For vertebrates, negatively charged polysaccharide hyaluronic acids play a vital role in the organization of pericellular matrix Attili et al. (2012); Cohen et al. (2004).
Double-stranded DNA brushes on a biochip Karzbrun et al. (2014) at a cell-like density ( kb/) have been developed as a platform to study cell-free gene expression Bracha et al. (2014). Due to the negative charges along the backbone, this synthetic system behaves like a well-defined strong polyelectrolyte brush Bracha et al. (2014), the height of which can be varied by modulating the ionic strength of monovalent salt (NaCl) solution and the grafting density Bracha et al. (2013). Recently, it has been reported that trivalent counterions, spermidine3+ (\ceSpd^3+), can induce a collapse transition of DNA brush into fractal-like dendritic macroscopic domains Bracha and Bar-Ziv (2014). The heterogeneous morphology of DNA condensate points to polyamine-mediated regulation of local DNA configuration and gene expression Cherstvy (2011); Carrivain et al. (2012), underscoring the importance of understanding the effects of multivalent counterions on polyelectrolyte brush Brettmann et al. (2016); Ballauff and Borisov (2016). Compared with uncharged polymer brushes in good or poor solvent, the electrostatic interaction and osmotic pressure, which are readily controlled by the salt concentration and pH, yield additional flexibilities in manipulating polyelectrolyte brushes, and thus holding promise for its wide applications Szilagyi et al. (2014); Pardatscher et al. (2016).
Conventional theoretical approaches, successful in explaining the behaviors of polyelectrolytes in monovalent salt solutions Pincus (1991); Israels et al. (1994); Ballauff and Borisov (2016), are of limited use, particularly, when multivalent counterions are at work. For example, the solution to the mean-field Poisson-Boltzmann theory Netz and Orland (2000) fails to account for phenomena such as ion condensation, charge over-compensation, and collapse of like-charged polymers Markus Deserno and May (2000); Hsiao (2008); Grosberg et al. (2002); Angelini et al. (2003). A prediction from a nonlocal density-functional theory that the exponent in the power-law relation between brush height () and counterion concentration () decreases with the valence of salt ion () Jiang and Wu (2008) contradicts to the finding from a recent MD simulation Guptha and Hsiao (2014) that the transition is sharper for counterions with larger valence, i.e., increases with .
Polyelectrolyte brushes, which retain charged groups along the chain backbone and release ions to the solution, have been modeled explicitly with fully accounted electrostatic interactions Csajka and Seidel (2000). The dependence of brush height on counterion concentration and grafting density has been systematically investigated in mono-, di-, and trivalent ion solutions Guptha and Hsiao (2014). Atomistic simulations of DNA arrays solvated with \ceNa^+, \ceMg^2+, and spermine4+ suggested that the transient “bridging” of multivalent cations drives the collapse of DNA Yoo and Aksimentiev (2016). It was also shown that an excess trivalent counterions over-compensating the polyelectrolyte charges elicits re-entrance transition (decondensation) of brush Hsiao and Luijten (2006); Feng et al. (2015).
The presence of lateral instability (or morphological heterogeneity) in polyelectrolyte brush, once noticed with AFM images Hur et al. (2010), is evident in DNA (strong polyelectrolyte) brush condensates in polyamine solution Bracha and Bar-Ziv (2014).
Simulations and theories have predicted the possibilities of lateral microphase segregation
in homopolymer brush in poor solvent condition for decades Lai and Binder (1992); Grest and Murat (1993); D.R.M. Williams (1993); Zhulina et al. (1998); Carrillo and Dobrynin (2009); He et al. (2014); Pattanayek et al. (2005); Tagliazucchi et al. (2010),
but the effects of multivalent ions on the morphological heterogeneity of polyelectrolyte brushes have not been fully investigated.
Here, we carried out molecular simulations of strong polyelectrolyte brushes in trivalent counterions
to study (1) the conditions for the heterogeneous collapse of brush and
(2) the dynamic characteristics of polymers and multivalent ions in brush condensates.
MODEL AND METHODS
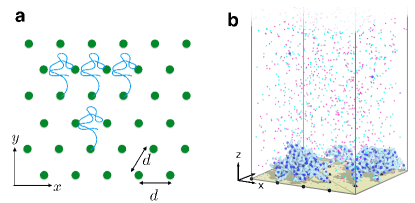
Model. A well tested coarse-grained model of strong polyelectrolyte brush Csajka and Seidel (2000); Crozier and Stevens (2003); Guptha and Hsiao (2014) was used in our study. Total polymer chains were grafted to the uncharged surface at , in a 2D triangular lattice with a lattice spacing (Fig. 2a). Each chain, consisting of -negatively charged monomers and a neutral monomer grafted to the surface, was initially neutralized using -monovalent counterions. The simulation box has a dimension of , where is the size (diameter) of chain monomer. Periodic boundary conditions were applied in and dimensions, and an impenetrable neutral wall was placed at . The location of the wall is far from the brush region, so that the density profiles of ions in the bulk region are effectively constant Ahrens et al. (2004); Kumar and Seidel (2005).
In order to model a flexible strong polyelectrolyte brush in good solvents with multivalent salts, we considered the following energy potentials. First, the finite extensible nonlinear elastic bond potential was used to constrain the bond distance between the neighboring chain monomers,
| (1) |
with a spring constant and a maximum extensible bond length . Second, the excluded volume interaction was modeled in between ions and chain monomers by using the Weeks-Chandler-Andersen potential
| (2) |
when ; otherwise, . Third, we assigned the Columbic interactions between charged particles ,
| (3) |
where is the corresponding charge in the unit of elementary charge , and is the Bjerrum length with the vacuum permittivity . We used for the relative dielectric constant of the solvent. Except for the anchored chain monomers, we considered a repulsion between the wall and any particle whose distance from the wall satisfies , such that
| (4) |
with ; otherwise, .
Note that and its derivative are continuous at .
For simplicity, we assume that all the ions and chain monomers
have the same values of and ,
which are used as the basic length and energy units in this model.
With , , and ,
MD simulations of a single grafted polyelectrolyte chain give
an average bond length .
For double-stranded DNA this bond length maps to the effective charge separation ( Å) along the chain.
Since Å in water at room temperature,
one gets .
Simulation Methods. Simulations were carried out using ESPResSo 3.3.1 package Limbach et al. (2006); Arnold et al. (2013). Depending on the property of interest (static or dynamic) we used two different algorithms for simulations Veitshans et al. (1997); Hyeon and Thirumalai (2005, 2006, 2008). In order to get a well sampled ensemble of configurations and obtain static (equilibrium) property of brush system for a given condition, we set the friction coefficient to a low value and integrated the following underdamped Langevin equation of motion using the velocity Verlet algorithm.
| (5) |
where the random force noise, satisfying and , was used to couple the simulated system to Langevin thermostat. The characteristic time scale of this dynamics is given to be Honeycutt and Thirumalai (1992). We chose the time step of integration and a small friction coefficient . A salt-free brush was first equilibrated for , corresponding to , from an initial configuration where polymer chains were vertically stretched with monovalent counterions homogeneously distributed in the brush region. To simulate the effect of trivalent cations on the brush systems, we randomly added cations and its monovalent coions (anions) into the brush-free zone. The production runs were generated for . A snapshot from simulations was saved every for the analysis.
When examining dynamic behaviors of system (such as configurational relaxation of brush) and evaluating the associated time scale of dynamics, which we report in Fig.8 by using Eq.15, simulations under overdamped condition is more appropriate Hyeon and Thirumalai (2008); Hinczewski et al. (2010). In order to probe the dynamic behavior of brush we switch our simulation algorithm to Brownian dynamics (BD). In BD simulations the following equation of motion is integrated:
| (6) |
where is the bare diffusion coefficient of the th particle, and is the Gaussian random noise satisfying the fluctuation-dissipation theorem . For the diffusion constant of ions and chain monomers, we used , for \ceNa^+, \ceCl^-, \ceSpd^3+ and DNA monomer respectively Lefebvre et al. (2004); Andreasson et al. (1996); Fernandes et al. (2002). For the integration time step of simulation, we chose , which is much smaller than the Brownian time . The last configuration of brush obtained from MD simulation was used as the starting configuration of BD simulation. The total simulation time for BD in each trajectory is .
Because of the slab geometry of our system, an electrostatic layer correction to the Particle-Particle Particle-Mesh algorithm (M+ELC) was used to calculate the long-range Coulomb interactions de Joannis et al. (2002), which required an extension of the simulation box along direction so that there is a vacuum slab above the top impenetrable wall. The height of the slab was chosen to be , and the error tolerance was set to . Differences between the electrostatic potentials of some exemplary configurations, calculated by M+ELC and by MMM2D Arnold and Holm (2002) algorithm, were negligible , indicating that Coulomb interactions have been fairly accounted.
| Group | Group | Group | |||||||||||||||
|---|---|---|---|---|---|---|---|---|---|---|---|---|---|---|---|---|---|
| A | 80 | 2.0 | 0.05 | 8.30 | 0.07 | B | 80 | 0.5 | 2.0 | 2.08 | 0.69 | C | 120 | 1.0 | 1.0 | 2.09 | 0.35 |
| A | 80 | 2.0 | 0.1 | 8.30 | 0.14 | B | 80 | 0.5 | 4.0 | 2.08 | 1.38 | C | 120 | 1.8 | 1.0 | 3.76 | 0.63 |
| A | 80 | 2.0 | 0.2 | 8.30 | 0.28 | C | 40 | 1.0 | 1.0 | 12.5 | 2.08 | C | 120 | 2.0 | 1.0 | 4.18 | 0.70 |
| A | 80 | 2.0 | 0.4 | 8.30 | 0.55 | C | 40 | 1.8 | 1.0 | 22.4 | 3.74 | C | 120 | 2.2 | 1.0 | 4.59 | 0.77 |
| A | 80 | 2.0 | 0.8 | 8.30 | 1.11 | C | 40 | 2.0 | 1.0 | 24.9 | 4.15 | C | 120 | 3.0 | 1.0 | 6.27 | 1.04 |
| A | 80 | 2.0 | 1.0 | 8.30 | 1.38 | C | 40 | 2.2 | 1.0 | 27.4 | 4.57 | C | 120 | 5.0 | 1.0 | 10.4 | 1.74 |
| A | 80 | 2.0 | 2.0 | 8.30 | 2.77 | C | 40 | 3.0 | 1.0 | 37.4 | 6.23 | C | 120 | 9.0 | 1.0 | 18.8 | 3.13 |
| A | 80 | 2.0 | 4.0 | 8.30 | 5.54 | C | 80 | 1.0 | 1.0 | 4.15 | 0.69 | C | 160 | 1.0 | 1.0 | 1.22 | 0.20 |
| B | 80 | 0.5 | 0.05 | 2.08 | 0.02 | C | 80 | 1.8 | 1.0 | 7.47 | 1.25 | C | 160 | 1.8 | 1.0 | 2.20 | 0.37 |
| B | 80 | 0.5 | 0.1 | 2.08 | 0.03 | C | 80 | 2.0 | 1.0 | 8.30 | 1.38 | C | 160 | 2.0 | 1.0 | 2.44 | 0.41 |
| B | 80 | 0.5 | 0.2 | 2.08 | 0.07 | C | 80 | 2.2 | 1.0 | 9.13 | 1.52 | C | 160 | 2.2 | 1.0 | 2.68 | 0.45 |
| B | 80 | 0.5 | 0.4 | 2.08 | 0.14 | C | 80 | 3.0 | 1.0 | 12.5 | 2.08 | C | 160 | 3.0 | 1.0 | 3.66 | 0.61 |
| B | 80 | 0.5 | 0.8 | 2.08 | 0.28 | C | 80 | 5.0 | 1.0 | 20.8 | 3.46 | C | 160 | 5.0 | 1.0 | 6.10 | 1.02 |
| B | 80 | 0.5 | 1.0 | 2.08 | 0.35 | C | 80 | 9.0 | 1.0 | 37.4 | 6.23 | C | 160 | 9.0 | 1.0 | 11.0 | 1.83 |
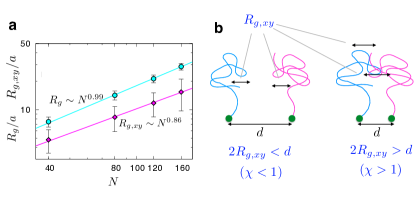
Brushes of varying chain length () and grafting density () were studied at varying trivalent counterion concentration . The parameters explored for the brush system are listed in Table 1. We introduce two dimensionless parameters to describe the system. The extent of lateral overlap between neighboring polymer chains is formulated using the chain overlap parameter , where , which scales as (Fig. 2), is the in-plane component of the gyration radius of a single grafted polyelectrolyte chain. The parameter can be related to the grafting density via . Collective features of brushes are expected to become significant only for (see Fig.2).
Next, we used another dimensionless parameter which defines the ratio of the total positive charges on the trivalent counterions in the simulation box of volume () to the total negative charges on the chain monomers (), i.e., . Thus, becomes 1 () when the concentration of trivalent counterions is set to the 1:3 stoichiometric ratio at which a trivalent ion () neutralizes 3 monomers in the brush.
RESULTS
Effect of trivalent ion on polymer brush. Upon addition of trivalent counterions to the bulk phase, the trivalent ions are spontaneously pulled into the brush phase, replacing the monovalent counterions neutralizing the bare charges on the brush monomers (Fig. 3a). The morphology of brush condensate varies depending on the size of brush chain (), grafting density ( or equivalently ), and trivalent ion concentration ().
For with an increasing trivalent ion concentration () but with (Group A in Table 1), the brush height drops gradually owing to the decrease of the osmotic pressure Bracha et al. (2014), and the lateral distribution of the brush becomes more inhomogeneous. Our study finds that at the height of brush () is minimized (Fig. 3b) and that the grain boundary between chain-free and chain-rich phase projected on the plane becomes clear in the same condition. The density profiles of chain monomers in plane (Fig. 3b) clearly visualize the morphology of brush condensate at various , highlighting that the development of lateral heterogeneity in the brush condensate is maximized at . At this ideal charge compensation point (), the six chains stretched from the corners of a hexagon are organized into aggregates entangled at the center, forming octopus-like surface micelles (Fig. 3b-(3), see also a snapshot in Fig. 4b), demarcated by the grain boundary whose width is about . A further increase of beyond () elicits reswelling of the brush along the -direction, obscuring the boundaries between the surface micelles (Fig. 3b-(4)).
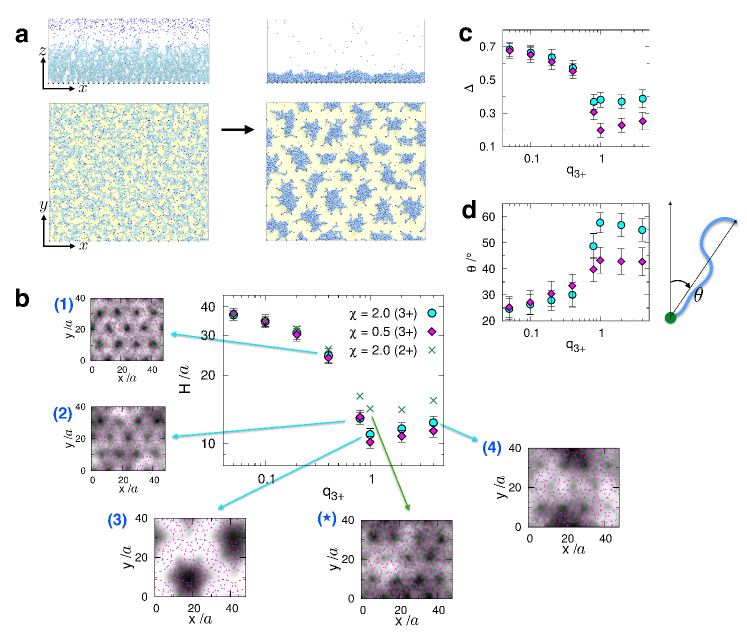
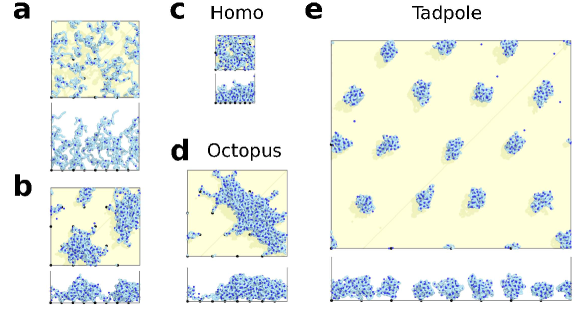
The lateral heterogeneity in brush condensate is unique to the counterions whose valence is greater than two. It is worth noting that as depicted in Fig. 3b-(), addition of divalent counterions even at , where the divalent ions can fully neutralize the total bare charge of chain monomers, does not elicit the heterogeneous brush collapse as in Fig. 3b-(3).
The morphology of a sparsely grafted polyelectrolyte brush condensate () differs greatly from that of a dense brush condensate (Group B in Table 1). Even at high (or high ), ion mediated inter-chain attractions are not strong enough to sustain a fused micelle overcoming the penalty of stretching individual polymer from the grafting point D.R.M. Williams (1993). As a consequence, each grafted chain collapses into a separate tadpole-like/mushroom structure (Figs. 4e).
Changes of the in-plane morphology of the brush are also mirrored in the configuration of individual polyelectrolyte chain. Of immediate notice are the non-monotonic dependences of brush height (), chain asphericity (), and tilt angle () on (Fig. 3). The chains in dense brush at display the greatest compression along the -axis and tilt angle, which can be explained by laterally stretched configurations of the polyelectrolyte chain in the octopus-like condensate. Both and are smaller in a sparse brush () than in a dense one (), pointing to their tadpole-like configuration.
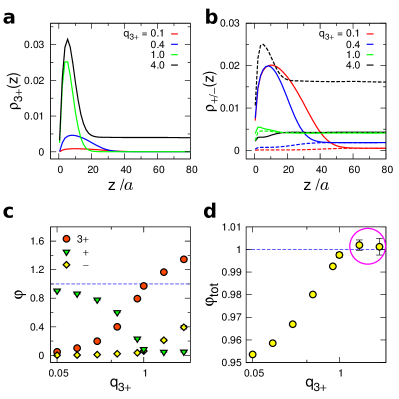
Next, of great interest are the distribution of counterions in the brush and bulk regions. For , when there is only a small amount of trivalent counterions in the system, the monovalent cations are still dominant in the brush region (, compare the red solid lines in Fig.5a and Fig. 5b). But, as increases, more trivalent counterions are condensed into the brush region, compressing the brush into a more compact condensate, and when the 1:3 stoichiometric condition of is reached the distribution of trivalent counterions in the brush region exceeds that of monovalent counterion (, compare the green lines in Fig. 5a and Fig. 5b). For , the excess trivalent counterions are condensed on polyelectrolyte brush region together with monovalent anions (see the black solid/dashed lines in Fig. 5a,b and symbols in Fig.5c). When all the charge ratios of ions are summed up () for , the total charge ratio () is slightly greater than the unity, (Fig. 5d). In fact, this charge inversion is responsible for the reswelling of brush suggested in Figs. 3b-d. Here, it is noteworthy that the density profile of trivalent ions is uniform in the polymer-free zone, which indicates that the simulation box size is sufficiently large and that the effect of box size in the -direction on brush structure is negligible.
In order to further quantify the lateral configuration of the brush, we calculated the in-plane static structure factor,
| (7) |
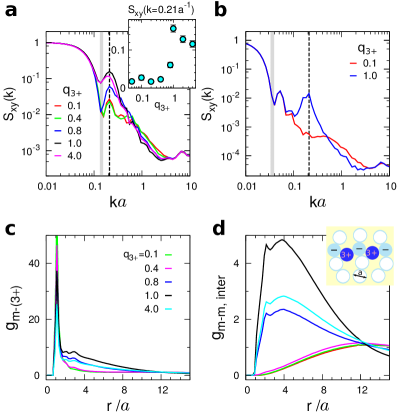
where is the total number of non-grafted chain monomers in the brush, is the position of the th monomer, and is 2D wave vector in the plane. is evaluated by first integrating over the space of , and then averaging over the simulation trajectory. As shown in Fig. 6a, , calculated for and , in the range of is maximized at . This indicates that at a characteristic length scale of there is a repeated pattern in the system, which corresponds to the octopus-like surface micelle domains of size (see the monomer density map of in Fig.3b-(3)).
In accord with our observation that the lateral heterogeneity becomes most evident at in Fig.3, non-monotonic dependence of on , is again maximized sharply at (Fig.6a inset). At , which supposedly corresponds to a homogenous brush phase, a peak is still identified in , but this is due to an artifact of periodic boundaries imposed on the brush system (Fig. 6a). In calculated from brush system (Fig. 6b), this peak at vanishes, while the peak of at in the salted brush () still remains. It is worth noting that the domain size of surface micelle (, the value of which maximizes ) is identical for and brush systems.
All these non-monotonic dependences on
arise from the effective inter-chain monomer attractions mediated by the condensed trivalent counterions.
The pair correlations between the charged monomers and trivalent ions
are strongest at (Fig. 6c).
Furthermore, the inter-chain monomer correlation has the greatest values at and (Fig. 6d).
It is worth noting that the pair correlation function between trivalent ions condensed to the brush is not as sharp or structured as
that of Wigner crystal which was observed in flexible polyelectrolyte chain in free space at relatively good solvent condition collapsed by multivalent ions Lee and Thirumalai (2001).
In fact, the diffusivity of the trivalent ions is finite even when they are trapped in the polyelectrolyte brush (see below).
Still, the pronounced correlation at lends support to the “bridging” mechanism by which charged monomers in polyelectrolyte are in effective attraction mediated by trivalent ions.
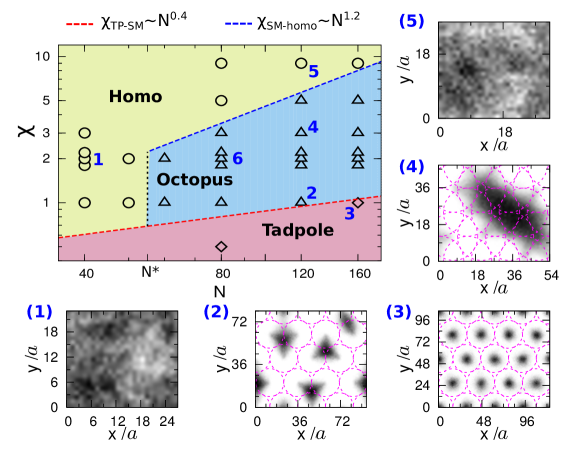
Structural diagram. At , the stoichiometric condition at which the most heterogeneous brush structures emerge, the effects of chain size () and chain overlap (), which is related to the grafting density as , on the morphology of brush are further studied (Group C in Table 1). As depicted in Fig. 7 (see also Fig. 4), three distinct phases are present. As a trivial case, tadpole-like condensates are expected if is very low (see the brush of , Fig.7-(3)). When the polyelectrolyte chains are either short (, Fig.7-(1)) or grafted with a very high density (Fig.7-(5)), the morphology of brush condensates is homogeneous. With , octopus-like surface micelle domains are formed at an intermediate range of (Fig.7-(2) or (4)). Assuming that the collapsed phase of polyelectrolyte brush with trivalent ions is reasonably mapped onto the collapsed polymer brush in a poor solvent, we treated the counterion-mediated interactions as an effective attraction and used the scaling argument Pattanayek et al. (2005) to describe the phase boundaries in Fig.7.
Boundary between tadpole and surface micelle: The free energy of individual tadpole composed of a single chain, like the case of and (Fig.7-(3)), is dominated by its surface energy, , where is an effective surface tension mediated by the salt concentration, and is the size of a tadpole-like structure. Assuming that the surface energy is around per monomer, , where the parameter , which is maximized at , denotes a scale of counterion mediated-effective attraction between chain monomers, and for a collapsed globule of polyelectrolyte chain, is then given by
| (8) |
The free energy of a bigger fused micelle composed of three neighboring chains, like the case of and (Fig.7-(2)), can be expressed as a summation of a surface energy term , and a elastic energy term as a result of stretching monomers in each chain to reach the surface micelle. Taken together, it yields
| (9) |
Finally, balance between and leads to a critical grafting distance (or grafting density, ), . Therefore, the phase boundary between tadpole and fused surface micelle has the following scaling behavior in terms of the chain overlap parameter () and .
| (10) |
Boundary between surface micelle and homogeneously collapsed layer: In a similar way, the free energy per unit area of a homogeneously collapsed layer, like the case of and (Fig.7-(5)), is ,
| (11) |
where the factor 2 arises because there are two interfaces with the collapsed polymer; one at the grafting points and another at the interface with the bulk.
Meanwhile, for an octopus-like domain of size , containing chains within a surface area defined by , the surface energy is , and the elastic energy is where we used the relationships of and . Hence the total free energy, per unit area, in octopus-like condensate with arms, is
| (12) |
Minimization of the free energy, , with respect to gives a minimum value of , at the following size :
| (13) |
By balancing with , we also obtain the critical grafting density between these two phases, and hence the chain overlap parameter which scales with and as follows.
| (14) |
To recapitulate, for , which is the scaling exponent for collapsed polymer,
the phase boundary between tadpole and fused micelle (surface micelle) is
,
and the phase boundary between homogeneously collapsed brush and octopus-like surface micelle is
.
Therefore, the surface micelle phase is enclosed by these two boundaries
and its area in Fig.7 is maximized when , where the strength of effective attraction between monomers reaches its maximum value ().
The vertical boundary (the dotted line in Fig.7) between homogeneous and octopus phases at is due to large fluctuations of short chains which predominate over the counterion-induced attraction between neighboring chains and prevent them from aggregating into a metastable octopus-like surface micelle.
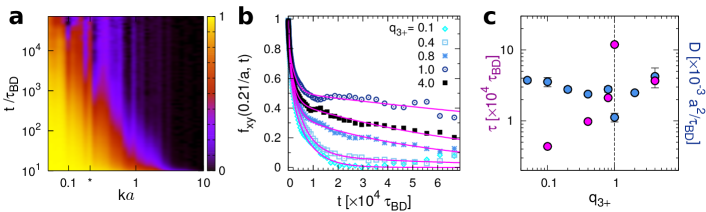
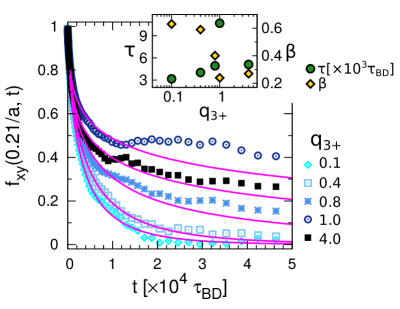
Dynamics of brush condensate. The intermediate scattering function for chain monomers Hansen and McDonald (2006),
| (15) |
is evaluated using the trajectories generated from Brownian dynamics simulations. describes the conformational relaxation of brush chains on different spatial scales. The heatmap of , for the brush with is plotted in Fig. 8a.
The fast decaying behavior of , i.e., on small length scales (), indicates that the monomers inside the collapsed surface micelles are fluidic, and that the trivalent ion-mediated polymer-polymer attractions are still transient. In contrast, the relaxation dynamics of polymer brush in a larger length scale () is rather slow. The scattering function , which probes the dynamics of brush on the length scale of surface micelle size (), exhibits slow decaying behavior, which is fitted to a multi-exponential function (Fig. 8b) or to a stretch-exponential function with (Fig. S1). Together with the exponent of stretch-exponential less than 1, which is a quintessential marker of glassy dynamics Kang et al. (2015), the non-monotonic dependence of on should be noted (Fig. 8c). The relaxation dynamics of octopus-like surface micelle at is fold slower than that at . Given that the size of polyelectrolyte chain we simulated is finite (), it is expected that the relaxation time of octopus-like surface micelle would effectively be divergent at a mesoscopic chain size as in Ref. Bracha and Bar-Ziv (2014). Once trapped in a dynamically metastable state, the heterogeneous configurations of surface micelle are maintained for an extended amount of time.
At , when the relaxation dynamics of polyelectrolyte chain is the slowest, the trivalent ions trapped in the brush region exhibit the slowest dynamics as well; the diffusion coefficient of trivalent ions trapped in the brush region, which can be calculated from an ensemble averaged mean square displacement, is minimal ( , Fig. 8c) and is only of that in the bulk ( ). When , the effective correlation between trapped ions and monomers becomes smaller than the value at (see Fig.6c), giving rise to a greater diffusivity (Fig.8c).
DISCUSSION
At high trivalent counterion concentration (), dense polyelectrolyte brushes composed of long chains ( and ) collapse to spatially inhomogeneous brush condensates. The octopus-like surface micelle domains, demarcated by chain-depleted grain boundaries, become most evident at the ionic condition of . Our structural diagram (Fig.7), the accompanying scaling arguments, and dynamics of brush condensates assessed by intermediate scattering functions (Eq.15, Fig.8) qualitatively capture the essence of the experimental observations by Bracha et al. Bracha and Bar-Ziv (2014). In their experiment, DNA brushes underwent a transition into macroscopic dendritic domains, only if the spermidine concentration was greater than the critical value (). Just like the vertical phase boundary at demonstrated in the structural diagram of our study, the minimal chain length of kb was required for the growth of dendritic domains. It was also observed that for , the collapsed domains were smaller in a denser brush of shorter chains, which is consistent with the prediction from our scaling argument . The scaling relationship of further explains the various size of octopus-like micelle domain depicted in (2), (4), (6) in Fig. 7. According to Fig. 7, the heterogeneous morphology of collapsed brush is more likely to be acquired for large ; however, when the grafting density is extremely high () crossing the phase boundary of , the morphology of brush condensate becomes homogeneous regardless of .
It is noteworthy that there have been a large amount of studies on a collection of free polyelectrolytes in solution Stevens (1999); Sayar and Holm (2006); Fazli and Golestanian (2007). Yet, the geometric constraint of the brush system with one end being grafted makes substantial difference. While the two systems share similarity in that the attraction between two polymer chains is initiated and mediated by counterions, which in a certain condition for free polyelectrolytes leads to a macrophase segregation through infinite bundling Stevens (1999); Sayar and Holm (2006); Fazli and Golestanian (2007), the very constraint on the one termini in brush system limits the size of aggregates leading to lateral microphase segregation, the domain size of which is determined by and (or ), i.e., .
A few cautionary remarks are in place in comparing our studies with the existing dsDNA biochip experiments. Compared with the DNA brush experiment Bracha and Bar-Ziv (2014), the simulated brush is more than an order of magnitude shorter, but with a higher grafting density. Importantly, we have not taken into account the finite chain stiffness of double-stranded DNA Stevens (2001) by reasoning that the ratio of contour () and persistence lengths () of dsDNA used in biochip experiment () is large enough to ignore the effect of chain stiffness on overall conclusion of our study. However, in reality the local chain stiffness does affect the local co-alignment of brush condensate, which is propagated and amplified into a macroscopic scale. As a consequence, the chain organization inside octopus-like domain differ from that inside the dendritic domain in Ref. Bracha and Bar-Ziv (2014), where tens to hundreds chains are co-aligned in a width of 20 – 100 nm and tightly packed in the hexagonal columnar order Hud and Downing (2001); Bracha and Bar-Ziv (2014). In addition, different models for ions and polyamine compounds, such as their size and charge distribution Lyubartsev and Nordenskiöld (1997); Yu et al. (2016) and spatial inhomogeneity in grafting density could modulate the critical salt concentration for maximal heterogeneity.
Furthermore, although our study was carried out through a specific protocol of preparation, that is by adding trivalent salt to the chain-free zone (bulk) and waiting for the system to be equilibrated, it may well be that the result of this exercise changes with the protocol of how the trivalent ions are added. As reported by the experiments Bracha and Bar-Ziv (2014); Pardatscher et al. (2016), different modes of incorporating spermidine into brush (e.g., the rate by which trivalent counterions are added) lead to slightly different critical concentrations, different collapse dynamics, and different morphologies. All these kinetic effects of spermidine addition are closely linked to the ultra-slow dynamics of brush condensates at , underscored in Fig.8, and are of great interest for the future study.
To recapitulate, we study indicates that when a condition is met, lateral heterogeneity develops in pericellular matrices Schneck et al. (2009) as well as in DNA biochip.
The results of our study also imply that the local compactness of DNA in interphase chromosome is manipulated
through dynamic controls over the DNA density and the biogenic polyamine concentration Yoo et al. (2016),
which in turn regulates DNA transcription activities.
ACKNOWLEDGMENTS
We are grateful to Bae-Yeun Ha and Wonmuk Hwang for useful comments. We thank the Center for Advanced Computation in KIAS for providing supercomputing resources.
References
- Schneck et al. (2009) Schneck, E.; Papp-Szabo, E.; Quinn, B. E.; Konovalov, O. V.; Beveridge, T. J.; Pink, D. A.; Tanaka, M. J. R. Soc. Interface 2009, 6 Suppl 5, S671–678.
- Attili et al. (2012) Attili, S.; Borisov, O. V.; Richter, R. P. Biomacromolecules 2012, 13, 1466–1477.
- Cohen et al. (2004) Cohen, M.; Joester, D.; Geiger, B.; Addadi, L. ChemBioChem 2004, 5, 1393–1399.
- Karzbrun et al. (2014) Karzbrun, E.; Tayar, A. M.; Noireaux, V.; Bar-Ziv, R. H. Science 2014, 345, 829–832.
- Bracha et al. (2014) Bracha, D.; Karzbrun, E.; Daube, S. S.; Bar-Ziv, R. H. Acc. Chem. Res. 2014, 47, 1912–1921.
- Bracha et al. (2013) Bracha, D.; Karzbrun, E.; Shemer, G.; Pincus, P. A.; Bar-Ziv, R. H. Proc. Natl. Acad. Sci. USA 2013, 110, 4534–4538.
- Bracha and Bar-Ziv (2014) Bracha, D.; Bar-Ziv, R. H. J. Am. Chem. Soc. 2014, 136, 4945–4953.
- Cherstvy (2011) Cherstvy, A. G. Phys. Chem. Chem. Phys. 2011, 13, 9942–9968.
- Carrivain et al. (2012) Carrivain, P.; Cournac, A.; Lavelle, C.; Lesne, A.; Mozziconacci, J.; Paillusson, F.; Signon, L.; Victor, J.-M.; Barbi, M. Soft Matter 2012, 8, 9285–9301.
- Brettmann et al. (2016) Brettmann, B. K.; Laugel, N.; Hoffmann, N.; Pincus, P.; Tirrell, M. J. Polym. Sci., Part A: Polym. Chem. 2016, 54, 284–291.
- Ballauff and Borisov (2016) Ballauff, M.; Borisov, O. V. Polymer 2016, 98, 402 – 408, Special Issue: Polymer Brushes.
- Szilagyi et al. (2014) Szilagyi, I.; Trefalt, G.; Tiraferri, A.; Maroni, P.; Borkovec, M. Soft Matter 2014, 10, 2479–2502.
- Pardatscher et al. (2016) Pardatscher, G.; Bracha, D.; Daube, S. S.; Vonshak, O.; Simmel, F. C.; Bar-Ziv, R. H. Nat. Nanotech. 2016,
- Pincus (1991) Pincus, P. Macromolecules 1991, 24, 2912–2919.
- Israels et al. (1994) Israels, R.; Leermakers, F. A. M.; Fleer, G. J.; Zhulina, E. B. Macromolecules 1994, 27, 3249–3261.
- Netz and Orland (2000) Netz, R. R.; Orland, H. Euro. Phys. J. E 2000, 1, 203–214.
- Markus Deserno and May (2000) Markus Deserno, C. H.; May, S. Macromolecules 2000, 33, 199–206.
- Hsiao (2008) Hsiao, P.-Y. J. Phys. Chem. B 2008, 112, 7347–7350.
- Grosberg et al. (2002) Grosberg, A. Y.; Nguyen, T. T.; Shklovskii, B. I. Rev. Mod. Phys. 2002, 74, 329–345.
- Angelini et al. (2003) Angelini, T. E.; Liang, H.; Wriggers, W.; Wong, G. C. L. Proc. Natl. Acad. Sci. USA 2003, 100, 8634–8637.
- Jiang and Wu (2008) Jiang, T.; Wu, J. J. Phys. Chem. B 2008, 112, 7713–7720.
- Guptha and Hsiao (2014) Guptha, V. S.; Hsiao, P.-Y. Polymer 2014, 55, 2900 – 2912.
- Csajka and Seidel (2000) Csajka, F. S.; Seidel, C. Macromolecules 2000, 33, 2728–2739.
- Yoo and Aksimentiev (2016) Yoo, J.; Aksimentiev, A. Nucleic Acids Res. 2016, gkw081+.
- Hsiao and Luijten (2006) Hsiao, P.-Y.; Luijten, E. Phys. Rev. Lett. 2006, 97, 148301.
- Feng et al. (2015) Feng, L.; Laderman, B.; Sacanna, S.; Chaikin, P. Nat. Mater. 2015, 14, 61–65.
- Hur et al. (2010) Hur, J.; Witte, K. N.; Sun, W.; Won, Y.-Y. Langmuir 2010, 26, 2021–2034.
- Lai and Binder (1992) Lai, P.-Y.; Binder, K. J. Chem. Phys. 1992, 97, 586–595.
- Grest and Murat (1993) Grest, G. S.; Murat, M. Macromolecules 1993, 26, 3108–3117.
- D.R.M. Williams (1993) D.R.M. Williams, J. Phys. II France 1993, 3, 1313–1318.
- Zhulina et al. (1998) Zhulina, E.; Singh, C.; Balazs, A. C. J. Chem. Phys. 1998, 108, 1175–1183.
- Carrillo and Dobrynin (2009) Carrillo, J.-M. Y.; Dobrynin, A. V. Langmuir 2009, 25, 13158–13168.
- He et al. (2014) He, G.-L.; Merlitz, H.; Sommer, J.-U. J. Chem. Phys. 2014, 140.
- Pattanayek et al. (2005) Pattanayek, S. K.; Pham, T. T.; Pereira, G. G. J. Chem. Phys. 2005, 122.
- Tagliazucchi et al. (2010) Tagliazucchi, M.; de la Cruz, M. O.; Szleifer, I. Proc. Natl. Acad. Sci. USA 2010, 107, 5300–5305.
- Crozier and Stevens (2003) Crozier, P. S.; Stevens, M. J. J. Chem. Phys. 2003, 118, 3855–3860.
- Ahrens et al. (2004) Ahrens, H.; Förster, S.; Helm, C. A.; Kumar, N. A.; Naji, A.; Netz, R. R.; Seidel, C. J. Phys. Chem. B 2004, 108, 16870–16876.
- Kumar and Seidel (2005) Kumar, N. A.; Seidel, C. Macromolecules 2005, 38, 9341–9350.
- Limbach et al. (2006) Limbach, H. J.; Arnold, A.; Mann, B. A.; Holm, C. Comput. Phys. Commun. 2006, 174, 704–727.
- Arnold et al. (2013) Arnold, A.; Lenz, O.; Kesselheim, S.; Weeber, R.; Fahrenberger, F.; Roehm, D.; Košovan, P.; Holm, C. ESPResSo 3.1 — Molecular Dynamics Software for Coarse-Grained Models. 2013.
- Veitshans et al. (1997) Veitshans, T.; Klimov, D.; Thirumalai, D. Folding Des. 1997, 2, 1–22.
- Hyeon and Thirumalai (2005) Hyeon, C.; Thirumalai, D. Proc. Natl. Acad. Sci. U. S. A. 2005, 102, 6789–6794.
- Hyeon and Thirumalai (2006) Hyeon, C.; Thirumalai, D. Biophys. J. 2006, 90, 3410–3427.
- Hyeon and Thirumalai (2008) Hyeon, C.; Thirumalai, D. J. Am. Chem. Soc. 2008, 130, 1538–1539.
- Honeycutt and Thirumalai (1992) Honeycutt, J. D.; Thirumalai, D. Biopolymers 1992, 32, 695–709.
- Hinczewski et al. (2010) Hinczewski, M.; von Hansen, Y.; Dzubiella, J.; Netz, R. R. J. Chem. Phys. 2010, 132, 06B615.
- Lefebvre et al. (2004) Lefebvre, X.; Palmeri, J.; David, P. J. Phys. Chem. B 2004, 108, 16811–16824.
- Andreasson et al. (1996) Andreasson, B.; Nordenskiöld, L.; Schultz, J. Biophys. J. 1996, 70, 2847 – 2856.
- Fernandes et al. (2002) Fernandes, M. X.; Ortega, A.; López Martínez, M. C.; García de la Torre, J. Nucleic Acids Res. 2002, 30, 1782–1788.
- de Joannis et al. (2002) de Joannis, J.; Arnold, A.; Holm, C. J. Chem. Phys. 2002, 117, 2496–2512.
- Arnold and Holm (2002) Arnold, A.; Holm, C. Comput. Phys. Commun. 2002, 148, 327 – 348.
- Aronovitz, J.A. and Nelson, D.R. (1986) Aronovitz, J.A.,; Nelson, D.R., J. Phys. (Paris) 1986, 47, 1445–1456.
- Hyeon et al. (2006) Hyeon, C.; Dima, R. I.; Thirumalai, D. J. Chem. Phys. 2006, 125.
- Lee and Thirumalai (2001) Lee, N. K.; Thirumalai, D. Macromolecules 2001, 32, 3446–3457.
- Hansen and McDonald (2006) Hansen, J.-P.; McDonald, I. R. Theory of Simple Liquids, 3rd ed.; Academic Press, 2006.
- Kang et al. (2015) Kang, H.; Yoon, Y.-G.; Thirumalai, D.; Hyeon, C. Phys. Rev. Lett. 2015, 115, 198102.
- Stevens (1999) Stevens, M. J. Phys. Rev. Lett. 1999, 82, 101.
- Sayar and Holm (2006) Sayar, M.; Holm, C. Europhys. Lett. 2006, 77, 16001.
- Fazli and Golestanian (2007) Fazli, H.; Golestanian, R. Phys. Rev. E. 2007, 76, 041801.
- Stevens (2001) Stevens, M. J. Biophys. J. 2001, 80, 130 – 139.
- Hud and Downing (2001) Hud, N. V.; Downing, K. H. Proc. Natl. Acad. Sci. USA 2001, 98, 14925–14930.
- Lyubartsev and Nordenskiöld (1997) Lyubartsev, A. P.; Nordenskiöld, L. J. Phys. Chem. B 1997, 101, 4335–4342.
- Yu et al. (2016) Yu, J.; Mao, J.; Yuan, G.; Satija, S.; Jiang, Z.; Chen, W.; Tirrell, M. Macromolecules 2016, 49, 5609–5617.
- Yoo et al. (2016) Yoo, J.; Kim, H.; Aksimentiev, A.; Ha, T. Nature Commun. 2016, 7, 11045.
I Supporting Information