SG1120-1202: Mass-Quenching as Tracked by UV Emission in the Group Environment at z
Abstract
We use the Hubble Space Telescope to obtain WFC3/F390W imaging of the supergroup SG1120-1202 at , mapping the UV emission of 138 spectroscopically confirmed members. We measure total (F390W–F814W) colors and visually classify the UV morphology of individual galaxies as “clumpy” or “smooth.” Approximately 30% of the members have pockets of UV emission (clumpy) and we identify for the first time in the group environment galaxies with UV morphologies similar to the jellyfish galaxies observed in massive clusters. We stack the clumpy UV members and measure a shallow internal color gradient, which indicates unobscured star formation is occurring throughout these galaxies. We also stack the four galaxy groups and measure a strong trend of decreasing UV emission with decreasing projected group distance (Rproj). We find that the strong correlation between decreasing UV emission and increasing stellar mass can fully account for the observed trend in (F390W–F814W)–Rproj, i.e., mass-quenching is the dominant mechanism for extinguishing UV emission in group galaxies. Our extensive multi-wavelength analysis of SG1120-1202 indicates that stellar mass is the primary predictor of UV emission, but that the increasing fraction of massive (red/smooth) galaxies at Rproj and existence of jellyfish candidates is due to the group environment.
Subject headings:
galaxies: clusters: individual (SG1120-1202) - galaxies: evolution - galaxies: starburst - galaxies: morphology1. Introduction
How galaxies evolve as a function of their local environment continues to be a rich topic of exploration for both observational and theoretical studies. The origins of well-established trends such as the increasing fraction of blue/star-forming/disk-dominated galaxies in galaxy clusters at higher redshift (e.g. Butcher & Oemler, A., 1978; Dressler, 1980; Stanford et al., 1998; Cooper et al., 2010)seem to be rooted in environmental processes. However, dissecting the relative importance of physical mechanisms such as ram pressure stripping (Gunn & Gott III, 1972; Abadi et al., 1999), galaxy harassment (Moore et al., 1998), tidal interactions (Byrd & Valtonen, 1990), and gas starvation (Larson et al., 1980; Bekki et al., 2002) remains a challenge.
In the hierarchical formation model (Peebles, 1970), galaxy clusters are built by merging smaller groups. Observations of nearby groups show they have more in common with galaxy clusters than with the field population, i.e., higher early-type fractions and lower mean star-formation rates than the field (Hashimoto et al., 1998; Zabludoff & Mulchaey, 1998; Tran et al., 2001), and observations at highlight the importance of the group environment in transforming late to early-type galaxies (Gallazzi et al., 2009; Iovino et al., 2010; Koyama et al., 2010).
Motivated by the rapid evolution of the spiral population since (Dressler et al., 1997; Kodama et al., 2001; Postman et al., 2005; Wilman et al., 2008), many investigations focus on the transformation of infalling spirals, either via a rapid, triggered burst of star formation or quenching of subsequent star formation. Simulations are sufficiently advanced that new insight can be obtained by, e.g. comparing star-forming regions and gas-loss rates to observations (Tonnesen et al., 2007). Also, galaxy mass may have a more dominant role in quenching star formation when clusters are still assembling (Peng et al., 2010; Muzzin et al., 2012), i.e., when galaxies are in a more group-like environment. However, to connect galaxies evolving in groups to more massive clusters requires identifying the progenitors of local clusters, i.e., galaxy groups at higher redshift.
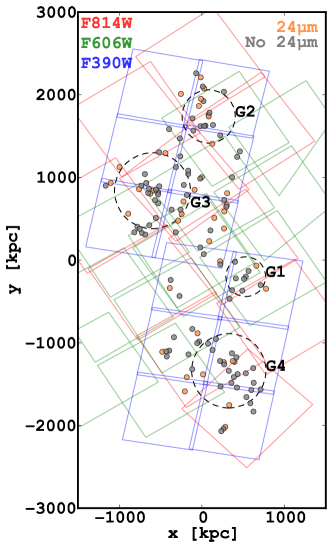
The supergroup SG1120-1202 (hereafter SG1120) at provides a unique laboratory for studying galaxies in a group environment before the groups merge to form a more massive galaxy cluster. SG1120 was discovered in the Las Campanas Deep Cluster Survey (Gonzalez et al., 2001) and is composed of four X-ray luminous galaxy groups that will merge to form a cluster comparable in mass to Coma (Gonzalez et al., 2005). Our extensive multi-wavelength observations show that most of SG1120’s members have early-type morphologies (%; Kautsch et al., 2008) and that most of the S0 members formed before the cluster phase (Just et al., 2011). However, the fraction of members that are bright 24m sources is nearly as high as in the field (% Tran et al., 2009). Spectroscopy with integral field units also show that several SG1120 members have outflowing winds that may aid in quenching star formation (Freeland et al., 2011).
In this paper, we focus on current star formation as traced by UV emission using Hubble Space Telescope imaging with WFC3/F390W. By combining with our existing ACS/F814W mosaic, we obtain high-resolution color maps of the supergroup members to pinpoint (dust-free) star-forming regions and measure internal color gradients. We compare the UV maps to stellar masses and projected group distance to quantify the relative importance of mass versus environmental quenching. Throughout the paper, we use = 70 km s-1 Mpc-1, . At z = 0.37, this corresponds to a scale of 5.12 kpc arcsec-1 and a look-back time of 4 Gyr.
2. Observations
Gonzalez et al. (2005) identified a merging system of four X-ray luminous groups with a total combined mass of (hereafter called SG1120; see Table 1 for SG1120 properties). The individual galaxy groups lie on the local relation, and a virial analysis using their X-ray masses and relative locations indicates that these groups are bound to each other, likely infalling for the first time, and will merge into a single system by . A weak-lensing analysis based on HST imaging supports this picture (Smit et al., 2015), and 174 group galaxies have been spectroscopically confirmed using Magellan, MMT, and VLT/VIMOS.
Previous studies comparing SG1120 to clusters have found comparable fractions of early-type members (Kautsch et al., 2008) but also enhanced fractions of m sources (Tran et al., 2009). The high fraction of early-type galaxies combined with enhanced star formation in SG1120 indicates that the transition to the cluster environment is well underway even in the group environment. The combination of cluster and field-like properties make SG1120 a unique laboratory for investigating how environmental processes drive and/or quench star formation.
| Index | ||||||||
|---|---|---|---|---|---|---|---|---|
| (J2000) | (J2000) | (keV) | (km ) | (kpc) | (members) | |||
| 1 | 11:20:07.48 | -12:05:09.1 | 0.3522 | 2.2 | 1.3 | 303 | 240 | 28 |
| 2 | 11:20:13.33 | -11:58:50.6 | 0.3707 | 1.7 | 8.0 | 406 | 320 | 27 |
| 3 | 11:20:22.19 | -12:01:46.1 | 0.3712 | 1.8 | 8.9 | 580 | 460 | 54 |
| 4 | 11:20:10.14 | -12:08:51.6 | 0.3694 | 3.0 | 2.3 | 576 | 460 | 47 |
2.1. Hubble Space Telescope Imaging
We employ HST imaging of an mosaic across three filters: F390W (WFC3/UVIS), F606W (ACS/WFC), and F814W (ACS/WFC) for a total of 44 pointings (combined primary and parallels) during cycles 14 (GO 10499) and 19 (GO 12470). The exposure times in F814W and F390W were 2000 s and 2610 s, respectively. At , these three filters probe rest-frame UV and optical emission to track both recent star formation and the existing stellar population. Furthermore, the high resolution of HST/WFC3 resolves the internal structure and the fine details of the individual galaxies. We measure galaxy sizes (radii) using F814W and use F390W to identify compact star-forming regions. The F606W is only used to generate the color images for a subset of members; the F606W coverage is not as extensive as F390W and F814W (see Fig. 1).
Of the original sample of 174 spectroscopically confirmed members, we exclude 31 because they do not have imaging in either F814W or F390W. Furthermore, eight galaxies fall near boundaries on the CCD and so our measurements are unreliably noisy, leaving a total of 136 confirmed supergroup galaxies for which we can measure galaxy colors and visually classify their F390W emission. For details on the spectroscopy and stellar mass measurements from multi-band ground-based observations, we refer the reader to Tran et al. (2009).
2.2. Measuring Galaxy Colors
To measure colors and fluxes via Source Extractor (Bertin & Arnouts, 1996), we first redrizzle our data to align all images. We utilize the default HST pipeline through the calibration and flat-fielding step (flt output images), but redrizzle our data via AstroDrizzle (S. Gonzaga, W. Hack, A. Fruchter, 2012) to combine our mosaic with optimized pixel resampling and astrometry. To retain resolution and to ensure detection of small-scale star forming regions, we apply the finest pixel resolution, 00396/pixel (WFC3/UVIS), and resample the other two datasets (ACS F606W and F814W) from their native scale (005’/pixel) to match. Resampling all images to a common resolution facilitates consistent color measurements across multi-band imaging. This resampling does not alter colors by more than 2%. We use the final-wht-type parameter to ensure our output weight maps are inverse variance maps as per the expected input to SExtractor (see Skelton et al., 2014 for more details).
We measure colors with SExtractor (Bertin & Arnouts, 1996) in dual-image mode, which uses a reference image (here F814W) for detection and then measures fluxes in the target image (F390W or F814W). Only by using the same detection map can we directly compare colors and sizes across the filters. All pixels that are associated with a galaxy in the detection image (segmentation map) are used in calculating its flux in the target image.
We utilize published values for instrument and filter-specific fields such as zeropoints, FWHM, etc., and use default parameters for all fields except minimum detection. We adjust minimum detection area to prevent faulty detections from entering our catalogs, especially in F390W, where object sizes are substantially smaller and the background noisier. Our choice for detection area includes all galaxy members, while filtering most of the false detections such as those along the imaging boundaries and in inter-chip regions. Table 2 includes the magnitudes in F814W and F390W and half-light radius in F814W for all spectroscopically confirmed group galaxies.
2.3. Identifying UV Emission from Star Formation
We visually inspect the HST imaging to identify SG1120 members that have bright pockets of UV emission indicative of ongoing (unobscured) star formation. The O and B type stars illuminating these regions burn for Myrs and, while they constitute less than 7% of stellar mass (Wuyts et al., 2012), these massive stars effectively trace new sites of unobscured star formation. We note that the absence of OB-type stars does not imply that a galaxy is devoid of star formation, e.g. UV light is easily reprocessed to longer wavelengths by dust that is then detected at m.
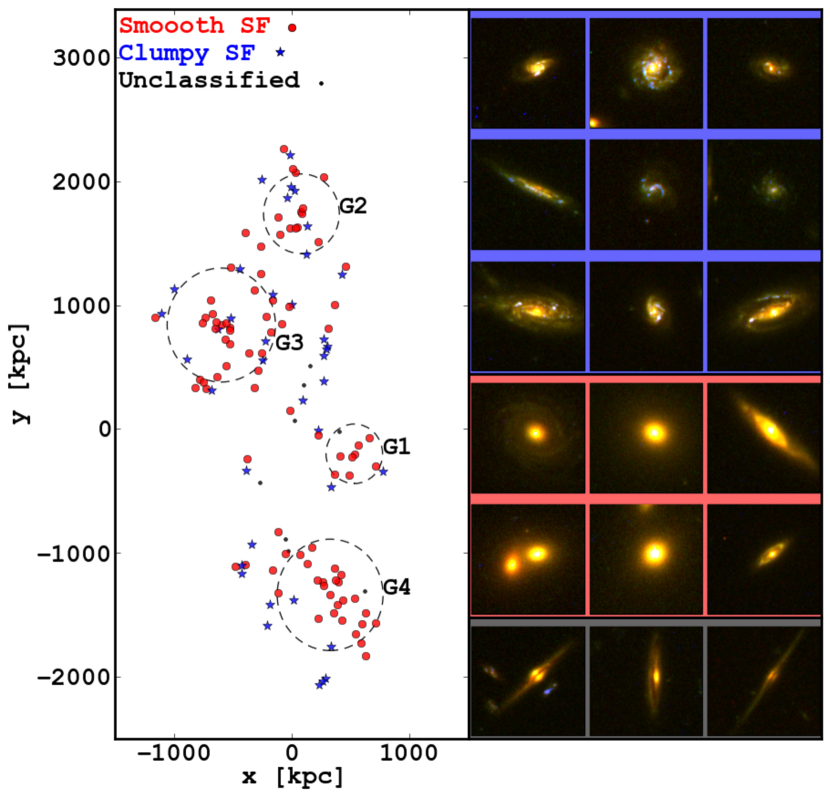
J.M. and K.T. separately examined the HST imaging in the individual filters as well as in the combined RGB images (see Fig. 2, right). Group members are classified as “clumpy” if UV-bright regions exist throughout the galaxy and “smooth” if there are no such regions. Several galaxies are edge-on disks and therefore cannot be reliably classified; these are denoted as “none.”
The right side of Figure 2 shows RGB images for a sample of each visual classification, and Table 2 includes the classification for each galaxy, including “jellyfish” candidates. Because of their increased rest-frame UV flux, regions of ongoing (unobscured) star formation are visible as blue pockets of light (F390W) in the RGB images. Approximately 30% of the supergroup have “clumpy” UV emission.
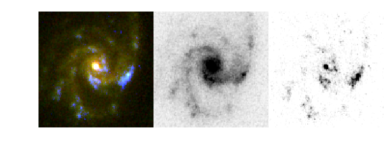
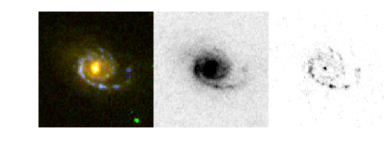
We use the F390W imaging to visually identify jellyfish candidates, which are characterized by asymmetric ultraviolet clumps with trails of knots and filaments (Smith et al., 2010). The high resolution of HST imaging allows us to visually identify such features according to the criteria used in the literature (e.g. Smith et al., 2010; Owers et al., 2012; Ebeling et al., 2014) even at . In Fig. 3 we include two such examples with RGB thumbnails and grayscale images of F814W and F390W. The side-by-side comparison allows the rest-frame UV emission of trails to directly contrast the underlying stellar population.
2.4. Spitzer/MIPS m Fluxes
We use the Spitzer MIPS m fluxes from Saintonge et al. (2008) and Tran et al. (2009). To summarize, the m observations were retrieved from the Spitzer archive and spectral energy distributions were fit to determine the IR luminosities and corresponding star-formation rates of each source (see Saintonge et al., 2008 for details). At , the 80% completeness limit corresponds to or, equivalently, a star-formation rate of . Figure 1 shows the spatial distribution of the m-detected group galaxies that also have the required F390W and F814W imaging. Following Tran et al. (2009), we attribute the IR emission to dusty star formation (contamination by active galactic nuclei is %).
3. Results
3.1. UV Morphology Correlates with Projected Distance
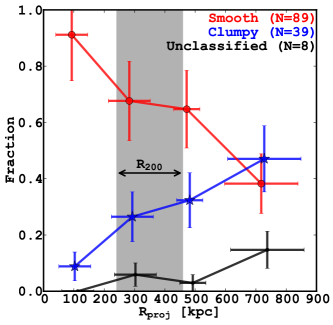
As shown by Kautsch et al. (2008), the trend of increasing early-type fraction in denser environments is already established in the SG1120. We build on this morphology–density relation by examining the spatial distribution of supergroup galaxies with pockets of UV emission (“clumpy”; Fig. 2, right). We stack all four galaxy groups and find that the fraction of members with patches of UV emission (clumpy) increases with increasing distance from the group centers (Figure 4). The tendency for clumpy members to be at larger projected distances from the cores suggests that newly accreted group galaxies with UV-bright star-forming regions are extinguished as they fall into the groups. While there are a handful of members with “clumpy” emission in the group cores, their position may be due primarily to projection effects.
3.2. Color–Magnitude Diagrams (CMDs)
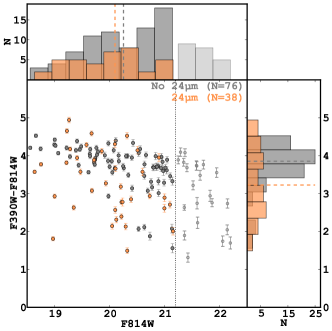
CMDs are an efficient method for tracing how a galaxy evolves as its stellar population ages. As a galaxy’s star-formation rate decreases, its colors redden and move it from the blue cloud to the red sequence within the CMD. Rest-frame unobscured UV emission is particularly effective at measuring unobscured SF rates because it is generated by the youngest and most massive main-sequence OB-type stars with lifetimes of Myr. In Figure 5, we compare the (F390W–F814W) distributions for different populations of supergroup members based on their IR (m) and UV (F390W) emission.
In Fig. 5 (top), we compare the color distribution of m members to those that are undetected. Although m and UV flux both trace star formation (Kennicutt Jr et al., 2012), the correlation with (F390W–F814W) colors can be weak because UV emission is easily reprocessed by dust, which then emits in the far-infrared (Meurer et al., 1999). The 28 IR-detected supergroup galaxies above our completeness limit of are about 0.3 dex bluer than the non-IR members, and a KS test confirms that the difference is significant (). Note that while the m members tend to be blue, they also span the full range in (F390W–F814W) color and include some of the reddest galaxies.
The transition from star-forming to quiescent galaxy also usually corresponds to changes in morphology from late- to early-type (van Dokkum et al., 1998; Balogh et al., 2004; Bell et al., 2004). We compare the supergroup galaxies based on their clumpy/smooth classification (Figure 5, bottom) and find that these two populations differ in average (F390W–F814W) color by dex, i.e. more than three times larger than the IR vs. non-IR members. When considering all of the members, the average (F390W–F814W) colors for smooth and clumpy are and respectively; if we consider only , the average (F390W–F814W) are and .
To summarize, the supergroup galaxies with smooth light profiles tend to be very uniform in color, to have color shallow gradients, to be red, to have early-type morphologies, and to populate the group cores (Figs. 2 & 4, Kautsch et al., 2008). In contrast, the clumpy galaxies contain both red and blue components, span the range in galaxy color, tend to have prominant disks, and are mostly outside the group cores.
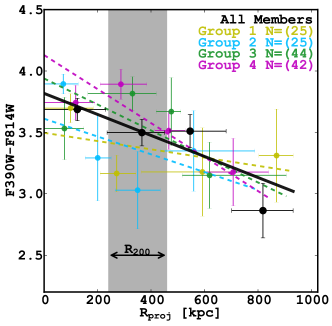
3.3. Total Galaxy Color Correlates with Projected Distance
In Fig. 6, we compare how total (F390W–F814W) color and local environment are correlated by stacking the four groups into a single system and using the projected radius (Rproj) from the nearest Brightest Group Galaxy (defined as the group center). The projected radius serves as a proxy for environmental density. For an analysis of how the m emission depends on local environment in SG1120, we refer to Tran et al. (2009).
Supergroup galaxies in the group cores are redder than those at larger distances. A least-squares fit to the total galaxy color and projected distance for the stacked groups (Fig. 6, black line) measures a strong correlation of
| (1) |
at confidence (errors in slope and offset are 2.64 and 0.12, respectively). Least-squares fits to the individual groups measure the same general trend. Figure 6 includes the error bars that represent each bin’s range in Rproj and standard deviation in (F390W–F814W). As galaxies approach their group cores, their increasingly red (F390W–F814W) colors indicate that their star formation is quenching.
3.4. Correlations with Stellar Mass
To test if the correlation between total galaxy color and projected distance in SG1120 (see §3.3) is driven by an increasing number of massive, passive galaxies in the group cores, we compare (F390W–F814W) color to stellar mass (M⋆) in Fig. 7. A least-squares fit confirms a strong correlation of
| (2) |
(errors in slope and offset are 0.08 and 0.06, respectively) shown as a solid line in Fig. 7: more massive supergroup members have redder (F390W–F814W) colors. Although 22 galaxies are below our spectroscopic completeness limit (which we take to estimate our mass completeness), the slope of Eq. 2 changes by less than when we exclude galaxies below this limit.
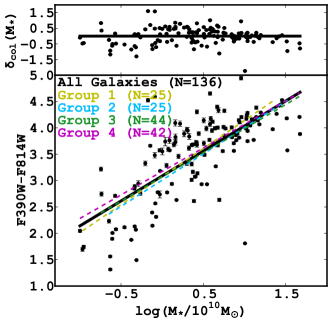
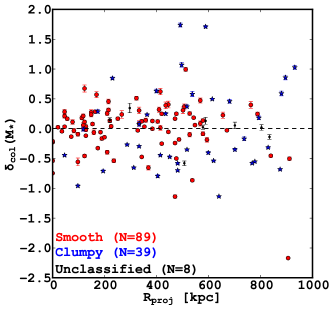
We now combine the measured relation between total galaxy color and stellar mass (Fig. 7) with the measured relation between total galaxy color and projected group distance (Fig. 6). Mass and projected group distance correlate with a slope of , but we seek to separate the effects of these properties on total galaxy color. For each supergroup galaxy, we calculate a color deviation defined as the difference between the galaxy’s measured (F390W–F814W) color and the expected value given its stellar mass from Eq. 2. Once we account for the correlation between total galaxy color and stellar mass, the trend between (F390W–F814W) color and Rproj disappears (Fig. 8). Least-squares fits to and Rproj for the different galaxy populations confirm slopes within of zero (all galaxies: ), i.e., the observed trend between (F390W–F814W) color and Rproj is driven by stellar mass.
We test whether M⋆ can also explain the decreasing fraction of members with pockets of UV emission (clumpy) with decreasing group distance (Fig. 4; §3.1). The clumpy members tend to have lower stellar mass compared to the smooth members with average (M⋆/M⊙) of and , respectively. Least-squares fits to and Rproj of both clumpy and smooth members confirm trends consistent with zero, (clumpy: , smooth: ), i.e. the correlation between UV morphology and projected group distance disappears once we account for stellar mass.
To confirm that stellar mass is the key parameter driving this relation, we test whether projected group-centric distance provides an equally good explanation of the observed correlation. The correlation between color and radius is much weaker than the trend with mass. If we define as the difference between the galaxy’s measured (F390W–F814W) color and the expected color given its Rproj from Eq. 1, then the residual scatter is appreciably larger (0.74 versus 0.52) and is strongly correlated with stellar mass (slope of ).
We find that the primary predictor for a galaxy’s total (F390W–F814W) color and UV morphology is its stellar mass, i.e. mass-quenching (Peng et al., 2010). The increasing fraction of massive galaxies in the core is due to this environmental effect, whereas the increasing fraction of passive galaxies merely reflects mass. Our results in the group environment of SG1120 mirror results by Muzzin et al. (2012) for galaxy clusters at .
3.5. Internal Color Gradients
With high-resolution imaging from HST, we map internal color gradients at multiple half-light radii for individual supergroup galaxies. We measure the (F390W–F814W) at three circular annuli corresponding to 1.0, 1.75, and 2.5 half-light radii, where r1/2 is measured in the F814W imaging. While other studies use more annuli to measure internal color gradients (e.g. Tamura et al., 2000; Welikala & Kneib, 2012; Allen et al., 2015), we focus our analysis on three radii to ensure a robust comparison of the galaxies’ disks to their centers, while ensuring that measurement apertures are larger than the PSF for both filters.
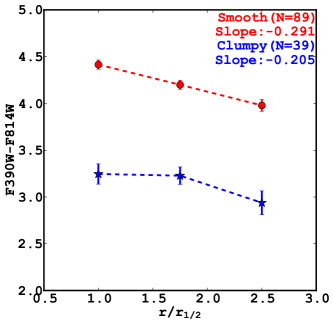
We stack internal color gradients for the clumpy and smooth supergroup galaxies (Fig. 9) and confirm that smooth members are dex redder than clumpy members. The average (F390W–F814W) color in each annulus is measured from the galaxy distribution (either clumpy or smooth) and the corresponding error is determined from 1000 boot-strapped realizations. The gradients of clumpy and smooth galaxies have slopes of and , respectively.
We also stack and measure internal color gradients for the m-detected and non-IR members. As expected, the m members are bluer (F390W–F814W) throughout their galaxy disks and centers compared to the non-IR members.
4. Discussion
A number of physical mechanisms continue to be explored to explain the changes in galaxy properties with environment. Ram pressure stripping (Gunn & Gott III, 1972), tidal interactions with other galaxies or with the cluster potential (Moore et al., 1998), morphological quenching (Martig et al., 2009), and environmental strangulation (Larson et al., 1980) each provide different processes that can explain the observed differences in UV emission (see Boselli & Gavazzi, 2006 for a comprehensive review of such mechanisms). However, given the breadth of these studies and the range of (sometimes) contradictory conclusions, we do not attempt to solve this issue definitively here with only one system.
Instead, we consider a few clues from supergroup SG1120. The galaxies are spatially segregated by UV emission even before the cluster forms (Figs. 2 & 6), and stellar mass is the key. Most of the members with pockets of UV-bright star formation (“clumpy”) tend to be fainter (lower-mass) galaxies (Fig. 5), and a statistically significantly trend between (F390W–F814W) color and stellar mass (Fig. 7, Eq. 2) drives this relation. Both results reinforce the link between increasing stellar mass and decreasing star formation (“mass-quenching”; Peng et al., 2010).
However, this is not to say that environment is unimportant (see also Cooper et al., 2010). First, there is mass-segregation in the group environment where the fraction of massive galaxies increases with decreasing Rproj. Second, we find for the first time group galaxies with UV tails and asymmetric UV emission (Fig. 2, top 3 rows) similar to those of jellyfish galaxies. These jellyfish candidates are interpreted as signs of shocked gas fronts in merging clusters (Owers et al., 2012) which is consistent with the incipient merger of the four X-ray luminous galaxy groups that make up SG1120. Third, the slope of the UV color-stellar mass relation in SG1120 may be different from that of the field.
The increasing fraction of UV emitting/clumpy members with increasing projected group distance (Figs. 4 & 6) mirrors the same trend for m members (Tran et al., 2009). The shallow internal color gradients (Fig. 9) of both the clumpy and smooth populations suggest that quenching should happen uniformly throughout a galaxy’s disk and core once it is within of the group core (Fig. 4). The UV emitting galaxies tend to have lower stellar masses and can thus fade into the faint quiescent members that are prevalent in low-redshift clusters (De Lucia & Blaizot, 2007). Alternatively, these quenched galaxies can merge to form more massive (quiescent) members in the group cores (Tran et al., 2008).
5. Conclusions
We map the UV emission in a supergroup at by combining high-resolution imaging from the Hubble Space Telescope with extensive ground-based multi-band imaging and spectroscopy. SG1120 is composed of four X-ray luminous galaxy groups that will merge and form a galaxy cluster by (Gonzalez et al., 2005). We use WFC3/F390W and ACS/F814W imaging of supergroup galaxies to measure total (F390W–F814W) colors, visually separate UV morphology into “clumpy” and “smooth” systems, and measure internal color gradients.
These observations indicate that stellar mass is the primary predictor of UV emission in the supergroup galaxies (“mass-quenching”) while environment drives the higher fraction of massive galaxies in the group cores.
We show for the first time that several group members have UV morphologies similar to the jellyfish galaxies in massive X-ray luminous clusters. The incipient merger of the four groups in SG1120 is consistent with the interpretation that jellyfish galaxies are signs of gas shocks due to mergers.
Approximately 30% (38/128) of the visually classified supergroup galaxies have pockets of UV emission (“clumpy”; Fig. 2), a fraction that is comparable to the m members (32%; Tran et al., 2009). The clumpy UV members have shallow internal (F390W–F814W) color gradients (Fig. 9).
To measure UV properties as a function of projected group distance (Rproj), we stack the four galaxy groups into a single system. We find that the UV emission, as measured by the total (F390W–F814W) color and by the clumpy/smooth classification, is strongly correlated with projected group distances (Figs. 4 & 6). We show that both of these trends in UV with Rproj are driven by the strong underlying correlation between (F390W–F814W) and stellar mass: group galaxies with UV emission tend to be lower luminosity/lower-mass members, and these systems are more common at RprojR200 (Figs. 7 & 8).
However, we do find evidence of environmental processes. Most importantly, the higher density environment of the group cores (Rproj) means an increase in the fraction of members that are massive and red/smooth (mass-segregation). Also, the supergroup contains jellyfish candidates whose UV morphologies likely are shaped by interactions with the intragroup gas.
Our analysis of the supergroup galaxies indicate that stellar mass is the primary predictor of a galaxy’s UV properties (mass-quenching), but it is environment that regulates the galaxy mass distribution and shapes jellyfish galaxies.
References
- Abadi et al. (1999) Abadi, M. G., Moore, B., & Bower, R. G. 1999, Monthly Notices of the Royal Astronomical Society, 308, 947
- Allen et al. (2015) Allen, R. J., Kacprzak, G. G., Spitler, L. R., et al. 2015, ApJ, 1
- Balogh et al. (2004) Balogh, M. L., Baldry, I. K., Nichol, R., et al. 2004, The Astrophysical Journal, 615, L101
- Bekki et al. (2002) Bekki, K., Couch, W. J., & Shioya, Y. 2002, ApJ, 577, 651
- Bell et al. (2004) Bell, E., Wolf, C., Meisenheimer, K., et al. 2004, ApJ, 608, 752
- Bertin & Arnouts (1996) Bertin, E., & Arnouts, S. 1996, Astronomy and Astrophysics Supplement Series, 117, 393
- Boselli & Gavazzi (2006) Boselli, A., & Gavazzi, G. 2006, Publications of the Astronomical Society of the Pacific, 118, 517
- Butcher & Oemler, A. (1978) Butcher, H., & Oemler, A., J. 1978, The Astrophysical Journal, 219, 18
- Byrd & Valtonen (1990) Byrd, G., & Valtonen, M. 1990, The Astrophysical Journal, 350, 89
- Cooper et al. (2010) Cooper, M. C., Coil, A. L., Gerke, B. F., et al. 2010, Monthly Notices of the Royal Astronomical Society, 409, 337
- De Lucia & Blaizot (2007) De Lucia, G., & Blaizot, J. 2007, Monthly Notices of the Royal Astronomical Society, 375, 2
- Dressler (1980) Dressler, A. 1980, The Astrophysical Journal, 236, 351
- Dressler et al. (1997) Dressler, A., Oemler, A., Jr., et al. 1997, Astrophysical Journal, 490, 577
- Ebeling et al. (2014) Ebeling, H., Stephenson, L. N., & Edge, A. C. 2014, The Astrophysical Journal, 781, L40
- Freeland et al. (2011) Freeland, E., Tran, K.-V. H., Irwin, T., et al. 2011, The Astrophysical Journal, 742, L34
- Gallazzi et al. (2009) Gallazzi, A., Bell, E. F., Wolf, C., et al. 2009, The Astrophysical Journal, 690, 1883
- Gonzalez et al. (2005) Gonzalez, A., Tran, K.-V., Conbere, M., Zaritsky, D., & Journal, T. A. 2005, ApJL, 624, L73
- Gonzalez et al. (2001) Gonzalez, A. H., Zaritsky, D., Dalcanton, J., & Nelson, A. 2001, ApJS, 137, 117
- Gunn & Gott III (1972) Gunn, J., & Gott III, J. 1972, ApJ, 176, 1
- Hashimoto et al. (1998) Hashimoto, Y., Oemler, Jr., A., Lin, H., & Tucker, D. L. 1998, The Astrophysical Journal, 499, 589
- Iovino et al. (2010) Iovino, A., Cucciati, O., Scodeggio, M., et al. 2010, Astronomy and Astrophysics, 509, A40
- Just et al. (2011) Just, D. W., Zaritsky, D., Tran, K.-V. H., et al. 2011, The Astrophysical Journal, 740, 54
- Kautsch et al. (2008) Kautsch, S. J., Gonzalez, A. H., Soto, C. a., et al. 2008, The Astrophysical Journal Letters, 688, L5
- Kennicutt Jr et al. (2012) Kennicutt Jr, R. C., Evans II, N. J., Kennicutt, R. C., & Evans, N. J. 2012, Annual Review of Astronomy and Astrophysics, 50, 531
- Kodama et al. (2001) Kodama, T., Smail, I., Nakata, F., Okamura, S., & Bower, R. G. 2001, The Astrophysical Journal, 562, L9
- Koyama et al. (2010) Koyama, Y., Kodama, T., Shimasaku, K., et al. 2010, Monthly Notices of the Royal Astronomical Society, 403, 1611
- Larson et al. (1980) Larson, R. B., Tinsley, B. M., & Caldwell, C. N. 1980, The Astrophysical Journal, 237, 692
- Martig et al. (2009) Martig, M., Bournaud, F., Teyssier, R., & Dekel, A. 2009, The Astrophysical Journal, 707, 250
- Meurer et al. (1999) Meurer, G. R., Heckman, T. M., & Calzetti, D. 1999, The Astrophysical Journal, 521, 64
- Moore et al. (1998) Moore, B., Lake, G., & Katz, N. 1998, The Astrophysical Journal, 495, 139
- Muzzin et al. (2012) Muzzin, A., Wilson, G., Yee, H. K. C., et al. 2012, The Astrophysical Journal, 746, 188
- Owers et al. (2012) Owers, M. S., Couch, W. J., Nulsen, P. E. J., & Randall, S. W. 2012, The Astrophysical Journal, 750, L23
- Peebles (1970) Peebles, P. J. E. 1970, The Astronomical Journal, 75, 13
- Peng et al. (2010) Peng, Y.-j., Lilly, S. J., Kovač, K., et al. 2010, The Astrophysical Journal, 721, 193
- Postman et al. (2005) Postman, M., Franx, M., Cross, N. J. G., et al. 2005, The Astronomical Journal, 623, 721
- S. Gonzaga, W. Hack, A. Fruchter (2012) S. Gonzaga, W. Hack, A. Fruchter, J. M. 2012, STScI, 63
- Saintonge et al. (2008) Saintonge, A., Tran, K.-V. H., & Holden, B. P. 2008, ArXiv eprints, 685, 5
- Skelton et al. (2014) Skelton, R. E., Whitaker, K. E., Momcheva, I. G., et al. 2014, The Astrophysical Journal Supplement Series, 214, 24
- Smit et al. (2015) Smit, M., Schrabback, T., Velander, M., et al. 2015, Astronomy & Astrophysics, 1
- Smith et al. (2012) Smith, R. J., Lucey, J. R., Price, J., Hudson, M. J., & Phillipps, S. 2012, Monthly Notices of the Royal Astronomical Society, 419, 3167
- Smith et al. (2010) Smith, R. J., Lucey, J. R., Hammer, D., et al. 2010, Monthly Notices of the Royal Astronomical Society, 408, 1417
- Stanford et al. (1998) Stanford, S., Eisenhardt, P. R., & Dickinson, M. 1998, ApJ, 10
- Tamura et al. (2000) Tamura, N., Kobayashi, C., Arimoto, N., Kodama, T., & Ohta, K. 2000, The Astronomical Journal, 119, 2134
- Tonnesen et al. (2007) Tonnesen, S., Bryan, G. L., & van Gorkom, J. H. 2007, The Astrophysical Journal, 671, 1434
- Tran et al. (2009) Tran, K.-V., Saintonge, A., Moustakas, J., et al. 2009, ApJ, 705, 809
- Tran et al. (2008) Tran, K.-V. H., Moustakas, J., Gonzalez, A. H., et al. 2008, ApJ, 17
- Tran et al. (2001) Tran, K.-V. H., Simard, L., Zabludoff, A. I., & Mulchaey, J. S. 2001, ApJ, 549, 172
- van Dokkum et al. (1998) van Dokkum, P. G., Franx, M., Kelson, D. D., et al. 1998, ApJ, 500, 714
- Welikala & Kneib (2012) Welikala, N., & Kneib, J.-p. 2012, arXiv:1202.0494, 13
- Wilman et al. (2008) Wilman, D. J., Pierini, D., Tyler, K., et al. 2008, The Astrophysical Journal, 680, 1009
- Wuyts et al. (2012) Wuyts, S., Förster Schreiber, N. M., Genzel, R., et al. 2012, The Astrophysical Journal, 753, 114
- Zabludoff & Mulchaey (1998) Zabludoff, A. I., & Mulchaey, J. S. 1998, ApJ, 496, 39
| NameaaNames follow the SDSS format: JHHMMSS.sDDMMSS.s for R.A. and decl. in sexagesimal units. | bbErrors corresponding to adopting different conversion factors for F24μm to F8-1000μm are % . | Half-light RadiusccFor galaxies with r1/2 kpc, Source Extractor measurements of the error on their spheroid radii are % . | ddMagnitudes are observed-frame. | ddMagnitudes are observed-frame. | eeSee Tran et al. (2009) for errors in mass calculation. | Clumpy | ||||
|---|---|---|---|---|---|---|---|---|---|---|
| (kpc) | (mJy) | F814W (kpc) | ||||||||
| J112023.8-120326.1 | 0.3708 | 527 | 3.22 | 19.76 | 0.002 | 23.96 | 0.029 | 11.0 | Smooth | |
| J112019.3-120516.9 | 0.3545 | 911 | 1.45 | 20.69 | 0.002 | 23.77 | 0.028 | 10.4 | Smooth | |
| J112028.8-120127.6 | 0.3403 | 517 | 1.96 | 3.52 | 19.68 | 0.002 | 22.75 | 0.013 | 10.4 | Clumpy |
| J112027.4-120050.0 | 0.3527 | 491 | 0.24 | 3.91 | 20.32 | 0.003 | 24.84 | 0.033 | 9.8 | Clumpy |
| J112026.0-120240.4 | 0.3733 | 404 | 0.12 | 3.62 | 20.99 | 0.005 | 23.61 | 0.028 | 10.4 | Clumpy |
| J112021.3-120149.6 | 0.3677 | 72 | 3.40 | 18.74 | 0.001 | 22.93 | 0.018 | 11.5 | Smooth | |
| J112022.2-120146.0 | 0.3713 | 0 | 0.13 | 1.44 | 19.72 | 0.001 | 23.60 | 0.021 | 11.7 | Smooth |
| J112023.4-120106.7 | 0.3719 | 220 | 2.79 | 19.22 | 0.002 | 23.42 | 0.023 | 11.1 | Smooth | |
| J112023.9-120134.3 | 0.3687 | 148 | 1.20 | 21.41 | 0.004 | 25.09 | 0.041 | 10.1 | Smooth | |
| J112012.2-120736.3 | 0.3717 | 415 | 1.50 | 21.37 | 0.004 | 25.45 | 0.051 | 10.2 | Smooth | |
| J112011.5-120432.6 | 0.3693 | 363 | 0.25 | 2.90 | 20.20 | 0.003 | 23.38 | 0.018 | 10.0 | Clumpy |
| J112009.7-120810.2 | 0.3672 | 215 | 2.23 | 19.41 | 0.001 | 23.79 | 0.032 | 11.1 | Smooth | |
| J112009.6-120541.1 | 0.3533 | 235 | 1.45 | 20.89 | 0.004 | 23.90 | 0.030 | 10.4 | Smooth | |
| J112009.3-120830.4 | 0.3672 | 128 | 2.13 | 19.74 | 0.001 | 23.67 | 0.028 | 10.9 | Smooth | |
| J112007.5-120509.1 | 0.3532 | 0 | 3.20 | 19.28 | 0.002 | 23.25 | 0.020 | 11.3 | Smooth | |
| J112007.4-120953.7 | 0.3671 | 384 | 2.20 | 19.46 | 0.001 | 23.62 | 0.024 | 11.1 | Smooth | |
| J112007.0-120455.7 | 0.3525 | 77 | 1.39 | 20.84 | 0.003 | 24.55 | 0.038 | 10.4 | Smooth | |
| J112006.8-121008.1 | 0.3700 | 471 | 0.42 | 21.36 | 0.002 | 23.99 | 0.029 | 10.7 | Smooth | |
| J112006.2-120920.0 | 0.3695 | 333 | 2.37 | 20.96 | 0.004 | 24.80 | 0.056 | 10.3 | Smooth | |
| J112024.6-120311.1 | 0.3731 | 471 | 2.17 | 19.00 | 0.001 | 23.42 | 0.017 | 11.4 | Smooth | |
| J112014.6-120360.0 | 0.3691 | 655 | 1.73 | 21.64 | 0.007 | 25.13 | 0.051 | 9.9 | Smooth | |
| J112014.5-120422.7 | 0.3496 | 589 | 0.20 | 1.93 | 23.32 | 0.023 | 24.92 | 0.038 | 8.3 | Smooth |
| J112029.6-120134.0 | 0.3688 | 568 | 2.34 | 20.55 | 0.003 | 24.73 | 0.041 | 10.6 | Smooth | |
| J112024.3-120142.4 | 0.3717 | 164 | 0.10 | 3.58 | 19.58 | 0.002 | 23.86 | 0.026 | 11.0 | Smooth |
| J112017.3-120211.5 | 0.3675 | 399 | 0.47 | 2.98 | 20.60 | 0.004 | 24.17 | 0.032 | 10.0 | Clumpy |
| J112011.0-120831.0 | 0.3680 | 123 | 0.03 | 2.57 | 19.28 | 0.001 | 23.46 | 0.026 | 11.1 | Smooth |
| J112008.0-120542.3 | 0.3511 | 174 | 2.02 | 19.62 | 0.001 | 23.18 | 0.018 | 10.9 | Smooth | |
| J112009.2-120434.0 | 0.3529 | 220 | 3.87 | 20.98 | 0.006 | 24.57 | 0.040 | 10.1 | Unclassified | |
| J112006.6-120937.0 | 0.3642 | 358 | 1.27 | 20.88 | 0.002 | 24.61 | 0.036 | 10.4 | Smooth | |
| J112006.3-121027.8 | 0.3742 | 578 | 2.41 | 20.26 | 0.002 | 23.93 | 0.034 | 10.7 | Smooth | |
| J112010.1-121012.6 | 0.3695 | 415 | 6.10 | 6.20 | 18.75 | 0.001 | 22.52 | 0.013 | 11.1 | Clumpy |
| J112005.8-120443.4 | 0.3514 | 184 | 0.35 | 2.86 | 19.41 | 0.002 | 23.35 | 0.021 | 11.0 | Smooth |
| J112005.1-120529.0 | 0.3501 | 210 | 1.36 | 20.77 | 0.003 | 23.94 | 0.033 | 10.4 | Smooth | |
| J112004.3-120537.7 | 0.3727 | 287 | 0.23 | 2.57 | 20.22 | 0.002 | 22.99 | 0.017 | 10.1 | Clumpy |
| J112018.8-120732.1 | 0.3649 | 778 | 2.25 | 20.53 | 0.002 | 22.59 | 0.010 | 9.7 | Clumpy | |
| J112016.8-120906.6 | 0.3660 | 517 | 0.37 | 2.35 | 21.10 | 0.003 | 23.81 | 0.027 | 9.4 | Clumpy |
| J112013.4-120747.3 | 0.3714 | 415 | 1.41 | 21.10 | 0.003 | 24.56 | 0.040 | 10.2 | Smooth | |
| J112006.3-120845.3 | 0.3724 | 297 | 1.86 | 21.58 | 0.004 | 25.32 | 0.079 | 10.0 | Unclassified | |
| J112020.6-120806.7 | 0.3541 | 839 | 0.26 | 1.75 | 20.73 | 0.002 | 23.66 | 0.024 | 10.1 | Smooth |
| J112019.9-120817.7 | 0.3327 | 768 | 1.99 | 19.98 | 0.002 | 22.91 | 0.018 | 10.5 | Clumpy | |
| J112015.9-120847.8 | 0.3710 | 445 | 2.00 | 19.71 | 0.001 | 23.54 | 0.021 | 10.8 | Smooth | |
| J112012.7-120802.3 | 0.3535 | 322 | 2.34 | 19.98 | 0.002 | 24.30 | 0.032 | 10.8 | Smooth | |
| J112010.2-120851.6 | 0.3720 | 0 | 4.04 | 18.56 | 0.001 | 22.76 | 0.020 | 11.7 | Smooth | |
| J112008.8-120859.3 | 0.3713 | 113 | 2.71 | 19.65 | 0.001 | 23.82 | 0.032 | 11.0 | Smooth | |
| J112007.5-120857.3 | 0.3756 | 210 | 1.40 | 20.32 | 0.002 | 24.32 | 0.035 | 10.6 | Smooth | |
| J112009.5-120828.5 | 0.3688 | 128 | 0.59 | 3.52 | 19.21 | 0.001 | 23.03 | 0.011 | 10.9 | Smooth |
| J112021.3-120154.6 | 0.3725 | 82 | 1.24 | 20.79 | 0.003 | 24.48 | 0.037 | 10.6 | Smooth | |
| J112011.5-120440.2 | 0.3509 | 343 | 1.41 | 20.80 | 0.003 | 24.48 | 0.027 | 10.4 | Smooth | |
| J112009.0-120513.2 | 0.3510 | 123 | 2.74 | 20.41 | 0.003 | 23.55 | 0.029 | 10.4 | Smooth | |
| J112007.7-120514.3 | 0.3540 | 36 | 2.23 | 19.97 | 0.002 | 23.83 | 0.025 | 10.9 | Smooth | |
| J112019.6-115920.5 | 0.3707 | 502 | 1.01 | 21.58 | 0.004 | 25.31 | 0.055 | 10.2 | Smooth | |
| J112018.5-120050.2 | 0.3758 | 404 | 1.52 | 20.93 | 0.004 | 24.61 | 0.030 | 10.4 | Smooth | |
| J112019.5-120803.9 | 0.3730 | 763 | 1.82 | 21.25 | 0.004 | 25.13 | 0.057 | 10.3 | Smooth | |
| J112014.2-120859.9 | 0.3664 | 312 | 0.69 | 6.27 | 19.00 | 0.002 | 21.93 | 0.014 | 10.5 | Clumpy |
| J112005.1-120935.5 | 0.3717 | 445 | 1.40 | 21.35 | 0.003 | 25.17 | 0.057 | 10.2 | Smooth | |
| J112014.1-120415.8 | 0.3700 | 578 | 2.74 | 20.11 | 0.003 | 24.51 | 0.033 | 10.7 | Unclassified | |
| J112021.1-120015.0 | 0.3755 | 471 | 1.69 | 20.05 | 0.002 | 23.61 | 0.023 | 10.7 | Smooth | |
| J112013.0-120319.9 | 0.3724 | 701 | 2.53 | 21.83 | 0.009 | 24.77 | 0.054 | 9.7 | Unclassified | |
| J112008.8-120026.0 | 0.3867 | 599 | 2.77 | 21.36 | 0.007 | 23.26 | 0.022 | 9.4 | Clumpy | |
| J112013.3-115847.1 | 0.3735 | 20 | 2.56 | 19.64 | 0.002 | 23.68 | 0.025 | 11.1 | Smooth | |
| J112015.3-115708.4 | 0.3537 | 543 | 1.99 | 18.99 | 0.001 | 23.29 | 0.013 | 11.2 | Smooth | |
| J112013.3-115850.6 | 0.3706 | 0 | 0.24 | 2.58 | 18.64 | 0.001 | 22.21 | 0.004 | 11.5 | Smooth |
| J112013.2-115841.4 | 0.3704 | 46 | 1.79 | 19.77 | 0.002 | 23.79 | 0.023 | 11.0 | Smooth | |
| J112010.4-120151.9 | 0.3771 | 906 | 2.45 | 2.43 | 18.97 | 0.001 | 20.78 | 0.002 | 11.0 | Smooth |
| J112010.5-120220.1 | 0.3750 | 896 | 1.04 | 4.32 | 20.10 | 0.004 | 24.40 | 0.039 | 10.4 | Clumpy |
| J112008.4-120012.9 | 0.3680 | 568 | 1.66 | 21.04 | 0.004 | 24.65 | 0.041 | 10.3 | Smooth | |
| J112014.6-115913.5 | 0.3711 | 154 | 1.43 | 20.63 | 0.003 | 24.41 | 0.030 | 10.6 | Smooth | |
| J112015.7-115923.7 | 0.3712 | 251 | 1.88 | 19.79 | 0.001 | 23.89 | 0.026 | 10.9 | Smooth | |
| J112016.6-120106.4 | 0.3684 | 476 | 2.83 | 19.48 | 0.002 | 23.73 | 0.024 | 11.0 | Smooth | |
| J112016.6-120058.7 | 0.3680 | 497 | 1.92 | 21.52 | 0.006 | 24.73 | 0.037 | 9.3 | Clumpy | |
| J112014.4-120114.0 | 0.3690 | 619 | 0.70 | 4.26 | 19.35 | 0.002 | 21.98 | 0.011 | 10.2 | Clumpy |
| J112013.8-115912.2 | 0.3705 | 118 | 2.04 | 20.07 | 0.002 | 24.22 | 0.032 | 10.9 | Smooth | |
| J112012.7-115955.0 | 0.3706 | 333 | 0.13 | 1.99 | 21.15 | 0.004 | 23.16 | 0.015 | 9.4 | Clumpy |
| J112015.5-120143.9 | 0.3753 | 512 | 0.16 | 4.77 | 19.26 | 0.002 | 24.20 | 0.033 | 11.0 | Smooth |
| J112017.8-120024.8 | 0.3744 | 537 | 3.02 | 21.13 | 0.006 | 23.21 | 0.022 | 9.4 | Smooth | |
| J112017.9-115942.3 | 0.3690 | 435 | 1.03 | 21.70 | 0.005 | 25.47 | 0.056 | 10.1 | Smooth | |
| J112008.9-120931.1 | 0.3721 | 225 | 2.45 | 20.04 | 0.002 | 23.89 | 0.024 | 10.8 | Smooth | |
| J112008.9-120819.7 | 0.3683 | 189 | 1.62 | 20.34 | 0.002 | 23.83 | 0.029 | 10.5 | Smooth | |
| J112009.4-120906.4 | 0.3673 | 97 | 2.62 | 20.09 | 0.001 | 23.76 | 0.032 | 10.7 | Smooth | |
| J112009.7-120920.0 | 0.3652 | 148 | 1.51 | 20.40 | 0.002 | 24.35 | 0.038 | 10.6 | Smooth | |
| J112010.7-121104.0 | 0.3500 | 681 | 0.53 | 4.63 | 19.86 | 0.002 | 23.98 | 0.031 | 10.6 | Clumpy |
| J112010.0-120601.5 | 0.3580 | 333 | 1.72 | 21.86 | 0.005 | 24.62 | 0.040 | 9.7 | Clumpy | |
| J112011.0-121108.5 | 0.3510 | 701 | 2.59 | 20.63 | 0.003 | 22.74 | 0.022 | 9.5 | Clumpy | |
| J112010.9-120836.3 | 0.3680 | 97 | 0.86 | 22.14 | 0.005 | 24.88 | 0.066 | 10.0 | Smooth | |
| J112011.5-120928.7 | 0.3692 | 215 | 2.65 | 20.94 | 0.003 | 24.91 | 0.040 | 10.3 | Smooth | |
| J112011.5-120828.3 | 0.3702 | 159 | 1.90 | 20.99 | 0.003 | 24.28 | 0.040 | 10.1 | Smooth | |
| J112011.3-121114.2 | 0.3667 | 737 | 2.42 | 22.06 | 0.009 | 23.80 | 0.031 | 9.0 | Clumpy | |
| J112015.1-120722.9 | 0.3720 | 589 | 0.17 | 3.43 | 20.90 | 0.004 | 24.85 | 0.057 | 10.3 | Unclassified |
| J112014.8-120742.3 | 0.3692 | 507 | 2.35 | 20.75 | 0.003 | 24.07 | 0.038 | 10.4 | Unclassified | |
| J112015.1-120746.3 | 0.3720 | 507 | 2.24 | 20.53 | 0.003 | 24.60 | 0.043 | 10.6 | Smooth | |
| J112015.9-120712.7 | 0.3706 | 671 | 2.23 | 19.07 | 0.001 | 23.13 | 0.016 | 11.2 | Smooth | |
| J112016.5-120812.8 | 0.3713 | 527 | 2.30 | 20.63 | 0.003 | 24.09 | 0.037 | 10.4 | Smooth | |
| J112017.1-120940.2 | 0.3512 | 589 | 0.46 | 4.90 | 19.67 | 0.002 | 24.26 | 0.019 | 9.9 | Clumpy |
| J112017.9-120554.8 | 0.3900 | 834 | 3.15 | 22.19 | 0.012 | 23.89 | 0.037 | 9.0 | Unclassified | |
| J112019.5-120536.0 | 0.3746 | 932 | 1.27 | 4.98 | 19.22 | 0.001 | 23.88 | 0.032 | 10.6 | Clumpy |
| J112020.0-120805.8 | 0.3449 | 793 | 2.27 | 22.14 | 0.008 | 24.18 | 0.029 | 9.0 | Clumpy | |
| J112010.9-120234.9 | 0.3744 | 829 | 0.61 | 5.16 | 20.10 | 0.004 | 22.67 | 0.017 | 9.9 | Clumpy |
| J112009.6-120114.1 | 0.3698 | 788 | 2.14 | 20.16 | 0.003 | 24.17 | 0.032 | 10.7 | Smooth | |
| J112010.9-115752.1 | 0.3692 | 353 | 3.06 | 19.02 | 0.001 | 23.28 | 0.019 | 11.4 | Smooth | |
| J112023.3-120329.7 | 0.3758 | 537 | 2.89 | 21.14 | 0.005 | 24.47 | 0.044 | 9.8 | Clumpy | |
| J112010.5-120223.8 | 0.3744 | 880 | 3.07 | 21.59 | 0.011 | 24.33 | 0.038 | 9.3 | Clumpy | |
| J112010.9-120207.8 | 0.3770 | 875 | 3.98 | 20.73 | 0.005 | 22.61 | 0.012 | 9.6 | Clumpy | |
| J112010.9-120315.3 | 0.3497 | 640 | 0.21 | 2.68 | 20.32 | 0.003 | 21.81 | 0.009 | 9.7 | Clumpyf f footnotemark: |
| J112011.5-115935.2 | 0.3681 | 266 | 0.84 | 21.95 | 0.006 | 25.50 | 0.064 | 10.0 | Smooth | |
| J112012.4-120250.3 | 0.3747 | 804 | 0.17 | 3.43 | 20.51 | 0.004 | 24.65 | 0.048 | 10.5 | Unclassified |
| J112012.6-115910.6 | 0.3712 | 118 | 1.89 | 20.24 | 0.002 | 23.97 | 0.032 | 10.7 | Clumpy | |
| J112013.2-120345.2 | 0.3684 | 614 | 0.62 | 6.39 | 19.47 | 0.003 | 23.04 | 0.015 | 10.1 | Clumpyf f footnotemark: |
| J112014.0-115744.5 | 0.3339 | 343 | 0.07 | 2.82 | 19.93 | 0.003 | 23.20 | 0.016 | 10.7 | Smooth |
| J112014.0-115913.1 | 0.3692 | 128 | 2.02 | 20.17 | 0.002 | 24.02 | 0.032 | 10.8 | Smooth | |
| J112014.1-115814.3 | 0.3325 | 195 | 3.72 | 21.14 | 0.007 | 22.70 | 0.019 | 9.4 | Clumpy | |
| J112014.5-115808.9 | 0.3742 | 230 | 0.19 | 3.47 | 20.11 | 0.003 | 23.77 | 0.022 | 9.9 | Clumpyf f footnotemark: |
| J112014.3-115739.8 | 0.3713 | 369 | 3.76 | 21.60 | 0.011 | 23.83 | 0.036 | 9.4 | Smooth | |
| J112014.7-120117.2 | 0.3701 | 594 | 1.77 | 20.89 | 0.004 | 24.21 | 0.038 | 10.3 | Smooth | |
| J112014.6-115718.1 | 0.3741 | 481 | 0.27 | 4.27 | 20.05 | 0.003 | 22.19 | 0.013 | 9.9 | Clumpy |
| J112014.9-115825.6 | 0.3736 | 174 | 0.12 | 3.14 | 21.00 | 0.004 | 23.89 | 0.030 | 9.7 | Clumpy |
| J112015.9-115855.1 | 0.3692 | 200 | 1.79 | 19.73 | 0.001 | 23.49 | 0.021 | 10.9 | Smooth | |
| J112016.8-120156.3 | 0.3712 | 420 | 2.41 | 19.44 | 0.002 | 23.18 | 0.019 | 11.0 | Smooth | |
| J112017.3-120132.4 | 0.3711 | 384 | 1.81 | 19.65 | 0.002 | 23.63 | 0.022 | 11.0 | Smooth | |
| J112017.6-120241.1 | 0.3338 | 450 | 1.04 | 4.53 | 20.29 | 0.003 | 22.42 | 0.016 | 9.7 | Clumpy |
| J112017.7-115757.2 | 0.3549 | 435 | 0.39 | 2.86 | 20.39 | 0.003 | 23.24 | 0.026 | 9.7 | Clumpy |
| J112018.2-120256.8 | 0.3761 | 476 | 0.10 | 6.56 | 20.23 | 0.005 | 23.01 | 0.019 | 9.9 | Smooth |
| J112017.8-120230.5 | 0.3708 | 410 | 1.55 | 20.84 | 0.004 | 24.82 | 0.043 | 10.5 | Smooth | |
| J112018.5-120324.3 | 0.3737 | 578 | 4.41 | 19.91 | 0.003 | 23.92 | 0.030 | 10.8 | Smooth | |
| J112019.2-120230.7 | 0.3701 | 328 | 1.89 | 19.73 | 0.002 | 23.62 | 0.020 | 10.9 | Smooth | |
| J112020.1-120017.2 | 0.3692 | 481 | 0.19 | 3.70 | 20.12 | 0.003 | 22.43 | 0.019 | 9.9 | Clumpy |
| J112021.6-120143.2 | 0.3716 | 46 | 1.37 | 20.66 | 0.003 | 24.68 | 0.031 | 10.7 | Smooth | |
| J112021.1-120135.5 | 0.3677 | 97 | 2.84 | 21.42 | 0.007 | 22.74 | 0.019 | 9.4 | Clumpyf f footnotemark: | |
| J112021.3-120215.6 | 0.3735 | 169 | 2.48 | 20.43 | 0.003 | 24.76 | 0.048 | 10.7 | Smooth | |
| J112021.8-120208.2 | 0.3712 | 118 | 1.67 | 20.86 | 0.004 | 24.57 | 0.041 | 10.5 | Smooth | |
| J112022.7-120307.5 | 0.3742 | 420 | 3.82 | 18.66 | 0.001 | 23.19 | 0.020 | 11.5 | Smooth | |
| J112021.7-120250.4 | 0.3686 | 333 | 1.64 | 21.02 | 0.003 | 24.70 | 0.046 | 10.4 | Smooth | |
| J112022.6-120153.2 | 0.3455 | 46 | 0.90 | 2.45 | 20.21 | 0.002 | 22.61 | 0.016 | 9.9 | Clumpy f f footnotemark: |
| J112022.9-120151.4 | 0.3714 | 56 | 0.99 | 20.30 | 0.002 | 24.29 | 0.028 | 10.8 | Smooth | |
| J112022.7-120141.4 | 0.3708 | 46 | 1.10 | 21.04 | 0.003 | 24.94 | 0.037 | 10.4 | Smooth | |
| J112023.2-120127.6 | 0.3731 | 123 | 1.26 | 21.29 | 0.004 | 25.38 | 0.059 | 10.2 | Smooth | |
| J112025.0-120324.1 | 0.3723 | 548 | 2.35 | 19.39 | 0.001 | 23.53 | 0.022 | 11.2 | Smooth | |
| J112024.2-120316.1 | 0.3703 | 486 | 1.61 | 20.00 | 0.001 | 23.71 | 0.026 | 10.9 | Smooth |