Is there a Disk of Satellites around the Milky Way?
Abstract
The “Disk of satellites” (DoS) around Milky Way is a highly debated topic with conflicting interpretations of observations and their theoretical models. We perform a comprehensive analysis of all dwarfs detected in the Milky Way and find that the DoS structure depends strongly on the plane identification method and the sample size. In particular, we demonstrate that a small sample size can artificially produce a highly anisotropic spatial distribution and a strong clustering of the angular momentum of the satellites. Moreover, we calculate the evolution of the 11 classical satellites with proper motion measurements and find that the thin DoS in which they currently reside is transient. Furthermore, we analyze two cosmological simulations using the same initial conditions of a Milky Way-sized galaxy, an N-body run with dark matter only and a hydrodynamic one with both baryonic and dark matter, and find that the hydrodynamic simulation produces a more anisotropic distribution of satellites than the N-body one. Our results suggest that an anisotropic distribution of satellites in galaxies can originate from baryonic processes in the hierarchical structure formation model, but the claimed highly-flattened, coherently-rotating DoS of the Milky Way may be biased by small-number selection effect. These findings may help resolve the contradictory claims of DoS in galaxies and the discrepancy among numerical simulations.
1 Introduction
Four decades ago, it was first reported that five bright satellite galaxies of the Milky Way (MW) align in a plane inclined to the Galactic stellar disk (Lynden-Bell, 1976), a phenomenon later dubbed as “disk of satellites” (DoS) (Kroupa et al., 2005) that included 11 bright MW dwarfs. Recently, it was claimed that 8 of these satellites co-rotate in the DoS (Metz et al., 2008; Pawlowski & Kroupa, 2013). Numerical simulations with the standard Lambda Cold Dark Matter (CDM) model have been largely unsuccessful to reproduce such a spatially-thin, kinematically-coherent structure, which has been strongly criticized as a failure of the standard CDM cosmology (Kroupa et al., 2005; Pawlowski et al., 2015a).
To date, more than three dozens of dwarf galaxies have been detected around the MW (McConnachie, 2012; Koposov et al., 2015), and it was suggested that all satellites lie in the original DoS formed by the 11 classical satellites (Pawlowski et al., 2015b). More intriguingly, it was recently reported that about half of the satellites in Andromeda (15 out of 27) form a DoS around the host (Pawlowski & Kroupa, 2013; McConnachie et al., 2009; Conn et al., 2013), and that 13 out of the 15 co-planar satellites co-rotate based on line-of-sight velocities (Ibata et al., 2013). Outside of the Local Group, one study (Ibata et al., 2014) found 22 galaxies in the Sloan Digital Sky Survey (SDSS) catalog which have diametrically opposed satellite pairs with anti-correlated velocities, and the authors suggested that co-planar and co-rotating DoS is common in the Universe.
The origin of the DoS, however, has remained an unsolved mystery. On the one hand, many advanced CDM simulations have failed to produce such thin, co-rotating DoS in galaxies. While some sophisticated simulations have managed to produce an anisotropic distribution of satellites (Pawlowski et al., 2015a; Buck et al., 2016; Sawala et al., 2016; Zhu et al., 2016; Papastergis & Shankar, 2016), no consensus of coherent motion was found in the DoS (Buck et al., 2016; Sawala et al., 2016; Bahl & Baumgardt, 2014; Cautun et al., 2015a).
On the other hand, the interpretation of DoS from observations has been called into question. Buck et al. (2016) demonstrated that line-of-sight velocities are not representative of the full 3-D velocity of a galaxy and they cannot be used to derive coherent motion in Andromeda satellites. Furthermore, recent investigations of the SDSS galaxies by Cautun et al. (2015b) and Phillips et al. (2015) found that the excess of pairs of anti-correlated galaxies is very sensitive to sample selection and it is consistent with the random noise corresponding to an under-sampling of the data.
In order to resolve the controversies surrounding the DoS, we reanalyze the observed satellites of the MW and compare them with advanced simulations. We focus on the following important issues: (1) effects of the plane identification method and sample size on the DoS properties, (2) the stability of the planar structure; and (3) effects of baryons on the distribution and evolution of satellites.
The paper is organized as follows. In we introduce the methods used in this study, including the techniques to identify the planar structure, the model to project future evolution of the current satellites, and the cosmological simulations with and without baryons. We present our results in , namely the structural and kinematic properties of the observed satellites using different plane identification methods and sample sizes in , the dynamical evolution of the observed 11 classical satellites in , and the DoS structure and its evolution from two cosmological simulations in . We summarize our findings and their implications in .
2 Methods
We use two types of techniques to analyze the present distribution of the positions of the observed satellites around the MW: the Principal Component Analysis (PCA) and the Tensor of Inertia (TOI).
For our specific case of 3D positional data, PCA can be thought of as fitting an ellipsoid to the data, where the ratio of minor and major axis () indicates the anisotropy of the dwarf distribution. If the distribution of the dwarfs is perfectly planar, then . In the TOI method, which is often used in literature (Allgood et al., 2006), we calculate the moment of inertia matrix of the satellites and diagonalize it. The eigenvalues of this matrix gives the three axes () of the fitted ellipsoid to the dwarf distribution. It has been argued that distant dwarfs in this distribution have a greater chance of being outliers, hence they should carry less weight in the TOI calculations. Here we consider three different weights for satellite distances, namely and , respectively, as used by different groups in literature (Pawlowski et al., 2015a; Cautun et al., 2015b; Sawala et al., 2016). We discuss these methods in more detail in a companion paper (Maji et al. 2017, in prep).
Moreover, in order to investigate the stability of the DoS, we employ the galaxy dynamics software Galpy 111http://galpy.readthedocs.io/en/latest/ (Bovy, 2015) to predict the future position and velocity of the observed 11 classical satellites. We use a realistic MW potential with three components: a power-law density profile (cut-off at 1.9 kpc) for the central bulge, a stellar disk represented by a combination of 3 Miyamoto-Nagai potentials (MN3 model) with varying disk mass and radial scalelength (Smith et al., 2015), and Navarro-Frenk-White (Navarro et al., 1996) density profile for the dark matter halo. We take the initial position and velocities in galactic coordinates from Pawlowski & Kroupa (2013) and convert them into galactocentric cartesian coordinates (Johnson & Soderblom, 1987).
Finally, in order to understand the origin of the DoS, we compare two cosmological simulations of a MW-size galaxy, one with both baryons and dark matter (hereafter referred to as “Hydro Simulation”, Marinacci et al. 2014) and the other with dark matter only (hereafter referred to as “DMO Simulation”, Zhu et al. 2016). The Hydro simulation includes a list of important baryonic physics, such as a two-phase ISM, star formation, metal cooling, and feedback from stars and active galactic nuclei (AGN). We refer the reader to Marinacci et al. (2014) for more details on the this simulation. The dwarf galaxies (subhalos) in the simulations are identified using the Amiga Halo Finder (Knollmann & Knebe, 2009), a density-based group finder algorithm.
3 Results
3.1 DoS properties with different methods and sample sizes
3.1.1 Structural properties
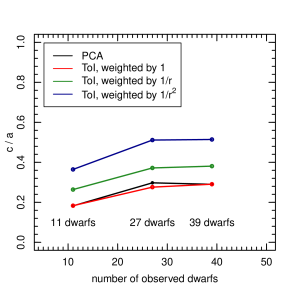
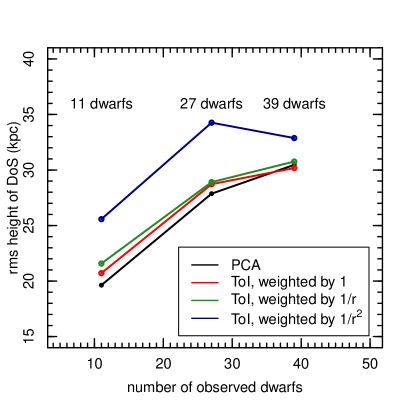
A comparison of the DoS structure using different plane identification methods (PCA and TOI) and different sample sizes is illustrated in Figure 1. The sample of 39 currently confirmed dwarfs of the MW (McConnachie, 2012; Koposov et al., 2015) includes the 11 classical satellites (Kroupa et al., 2005) and the 27 most massive nearby ones in the previous analysis (Pawlowski & Kroupa, 2013). Clearly, when the satellite number increases from the original 11 to the full sample of 39, the “isotropy” of the DoS (represented by the ratio between semi-minor and semi-major axes of the principal components, ) increases from to using the PCA and unweighted TOI methods, and the “thickness” of the DoS (represented by the root-mean-square height of the fitted plane) increases rapidly from kpc to kpc. For a weighted TOI with typically used in the analysis of cosmological simulations (Sawala et al., 2016), the DoS becomes more isotropic and thicker. This figure demonstrates that the DoS structure is subjected to selection effects, which explains the different claims reported in the literature using different methods and sample sizes (Sawala et al., 2016; Pawlowski et al., 2015b).
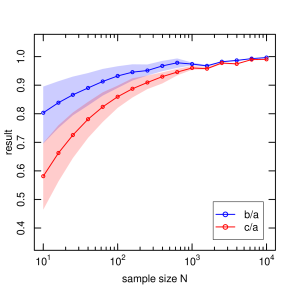
In order to test the effect of sample size on the anisotropy measurements in more detail, we sample an isotropic distribution (input and = 1) with objects. We repeatedly draw random samples with given size from the sphere and calculate and ratios of the sample using the unweighted TOI method. The variation of these anisotropy ratios with the sample size is shown in Fig 2. For large sample size N, the output ratios do point to the true results of both ratios being 1. On the other hand, for small (e.g. N10), it does not adequately sample the sphere, resulting in very biased estimates (for , median ). We discuss this effect in more detail in a companion paper (Maji et al. in prep.) where we place 11 satellites at their observed distances, vary the input from 0.4 to 1.0 and perform a Monte Carlo simulation with realizations. We find that for all input values, the output is consistently biased towards lower value. With an input , there is a 20 chance that the system has . We also find that weighted TOI method () consistently gives better result (closer to true value) compared to the unweighted method. This analysis indicates that the system appears to be more anisotropic when the sample size is very small because a small sample size systematically yields a lower ratio than the true underlying anisotropy of the system.
3.1.2 Kinematic properties
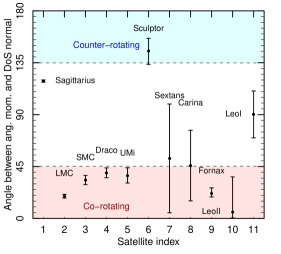
In a recent study by Pawlowski & Kroupa (2013), it was suggested that 7 to 9 out of the 11 classical MW satellites are co-rotating because the angles between their angular momenta and the DoS normal of the 11 satellites fall within 45 degrees. We use the same criterion for corotation in this study and show the angular momentum distribution of the satellites in Figure 3. As shown in the left panel of the figure 8 satellites appear in the corotation region (similar to the result of Pawlowski & Kroupa 2013), but given the large error bars of Sextans and Carina, only 6 (LMC, SMC, Draco, UMi, Fornax and LeoII) can be robustly considered as corotating. However, this sample size is very small and apparent clustering can often be found in random distributions. This effect, known as the clustering illusion (Clarke, 1946), can lead to misinterpretation of the data as we demonstrate below.
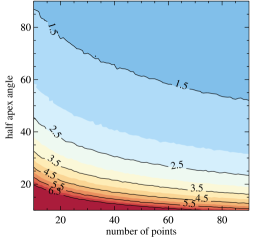
In order to understand the significance of the co-rotation and the effect of sample size, we perform a “clustering” test. Our null hypothesis is that there is no coherent motion on the DoS plane, i.e. there is no clustering of the angular momentum on the sphere. We use Monte Carlo simulations to numerically test the apparent clustering seen in the observed satellite angular momenta. We draw random data points from a uniform distribution on a sphere and search for clustering for each draw within a given apex angle. This experiment is repeated for trials. First, we carry out this experiment with a fixed number , i.e. the number of classical MW satellites. It is found that the median number of clustered points within 45 degrees is 4, and the chance of finding 5 or 6 clustered points within 45 degrees, similar to the clustering for observed satellites, is for 5 and for 6 points, respectively. Next, we repeat the simulation with a varying number of points. To quantify the effect of sample size, we define a bias parameter as the ratio between the observed number of clustered points and an expected number proportional to the solid angle () of the cone (). The resulting distribution of clustering from these experiments are shown in Figure 3.
This figure demonstrates that for smaller sample size, the clustering bias is significantly higher at given small angles. A strong clustering factor (2.5 - 3.5) at and angle can be found due to the intrinsic fluctuations of random points alone. This test shows that, even though the intrinsic distribution is uniform, the points can appear highly clustered for a small sample size. Therefore, we caution that the evidence of coherent rotation in the 11 observed satellites may not be conclusively different from that of a random data sample.
3.2 Dynamical evolution of satellites
Recently, Lipnicky & Chakrabarti (2016) studied the dynamics history of the 11 “classical” satellites and suggested that the DoS would lose its significance in less than one Gyr in the past. In order to investigate the future evolution of DoS, we use the galactic dynamics software Galpy (Bovy, 2015) to predict the future trajectories of the 11 classical satellites.
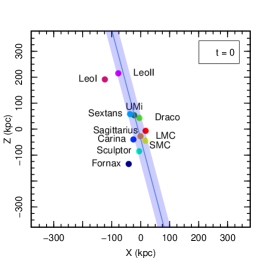
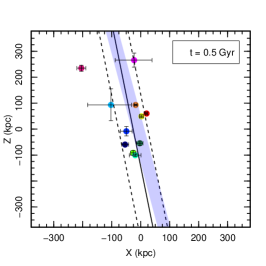
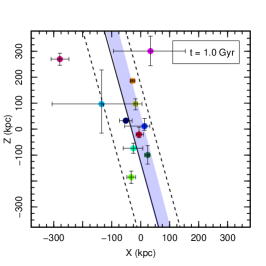
Figure 4 shows the future positions of the 11 satellites using a realistic MW potential with three components: a dark matter halo with the NFW density profile (Navarro et al., 1996), a central bulge with a power-law density profile cut off at 1.9 kpc, and a stellar disk with the MN3 potential (Smith et al., 2015). Note that the points only represent the final positions at these times, not the detailed orbits of the satellites, and that nearby satellites such as Sagittarius may complete more than one orbit in 1 Gyr while distant ones such as LeoII may move only a fraction of their orbits. To estimate the error bars in the positions, we model the present velocities as a normal distribution taking as a standard deviation their present-day uncertainties. We take 1000 random samples from this velocity distribution, calculate their future trajectories and take the 16th and 84th percentile value (which approximate the 1 confidence interval) of these future position distribution as our lower and upper error bars. Some of these satellites have large proper motion errors which propagates a significant uncertainty in far future positions, so predictions beyond 1 Gyr are not trustable (Lipnicky & Chakrabarti, 2016).
From this figure, we find that the 11 satellites are moving away from the present DoS at future times. The new fitted DoS is thicker with (height 45 kpc) at Gyr and (height 64 kpc) at t=1 Gyr, compared to the thin DoS ( kpc) at the present time. We have also explored two different MW potentials, by replacing the stellar disk with a one component Miyamoto-Nagai potential (Bovy, 2015, MW2014 model), and a NFW dark matter halo only potential, but the resulting positions (not shown to avoid overcrowding) are very similar to those from Figure 4. These calculations show that, for these idealized potentials, the MW satellites tend to move away from the present DoS, increasing its thickness and suggesting that the current thin DoS may be a transient structure.
3.3 Evolution of DoS isotropy in simulations
In order to understand the nature and the origin of the DoS, we analyze the satellites from two cosmological simulations of a MW-sized galaxy, the Hydro Simulation with comprehensive baryonic physics including star formation and feedback processes (Marinacci et al., 2014), and the DMO Simulation which is a pure N-body run (Zhu et al., 2016). We find that baryons can significantly affect the abundance and spatial distribution of satellites (see also Zhu et al., 2016). For example, within 1 Mpc, only luminous suhalos with star formation are found in the Hydro Simulation and they are distributed anisotropically, in sharp contrast to the subhalos which show isotropic distribution in the DMO Simulation.
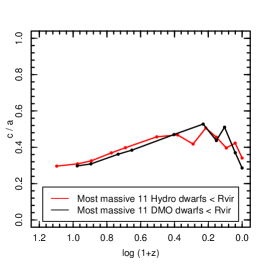
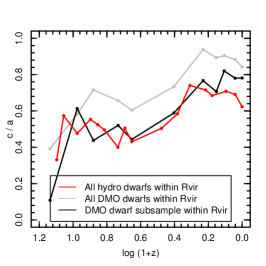
Figure 5 shows the isotropy ratio of both simulations as a function of redshift for three samples: the 11 most massive dwarfs within the virial radius (which have a similar mass range as the observed 11 “classical” satellites of the MW), dwarfs within the virial radius of the central galaxy, and dwarfs within 1 Mpc from the galaxy. These groups show three distinct trends in the evolution of . When we select only the 11 most massive halos within the virial radius, the two simulations show similar highly anisotropic distribution throughout time, and at the ratio is close to the observed value (). For dwarfs within , the ratio generally increases as redshift approaches for all three samples i.e., the Hydro dwarfs, all DMO dwarfs, and DMO dwarf subsample (massive DMO dwarfs with same sample size as the Hydro counterpart). This is mainly due to the rising abundance of dwarfs within the virial radius and phase mixing (Henriksen & Widrow, 1997). The satellite infall near the center can be chaotic and even if some satellites are accreted as a group from similar directions, as they move through the galactic potential, the neighboring satellites in phase-space can become out of phase with time, resulting in a smooth phase-space distribution of satellites. This phase mixing is more effective for satellites closer to the center (Helmi et al., 2003), which may explain the increased inside .
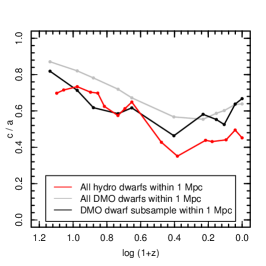
On a galactic scale of 1 Mpc from the central galaxy, we find a remarkable difference between the Hydro and DMO simulations. At high redshift () the satellite distributions are almost isotropic but over time the c/a ratio of both simulations declines, although the decrease is much more significant in the Hydro simulation ( at ) compared to the DMO one ( at ), even with the same sample size.
On a cosmic scale ( Mpc), we find that both ratios ( and ) continue to decrease, which suggest that the anisotropic dwarf distribution may be part of the large scale filamentary structure. We discuss this in more detail in a companion paper (Maji et al., in prep). Our results suggest that on Mpc scales, the distribution of dwarfs around a central galaxy is anisotropic as part of the large-scale filamentary structure. It has been suggested by many detailed DMO simulations that anisotropic satellite distribution can result from filamentary accretion of the satellites around the host galaxy and the infall history can impact the final orientation of the satellites in the position-velocity space (Aubert et al., 2004; Libeskind et al., 2005, 2014; Lovell et al., 2011; Tempel et al., 2014; Buck et al., 2016).
There are two factors responsible for the different satellite distributions between Hydro and DMO simulation: the difference in the satellite abundance and the effects of baryonic processes. Overall, the satellite abundance in DMO simulation is much higher than that in the Hydro run, which in turn results in a more isotropic distribution, which is evident in Fig 5 (middle panel). Furthermore, in the Hydro Simulation the dwarfs are subjected to additional baryonic processes, e.g. adiabatic contraction, tidal disruption and reionization (Zhu et al., 2016) that can significantly change the abundance, star formation activity, infall time, and trajectory of the satellites. For very massive subhalos the effects are mild and the most massive halos in both simulations are essentially the same, resulting in very similar evolution for the 11 massive satellites. However, for intermediate mass halos the tidal effects impacts the dynamics of the halos and even in similar mass range, halos in DMO and Hydro simulation have different properties. Hence, in spite of having the same sample size, the halos within 1 Mpc shows a significantly different distribution for simulations with and without baryons. Similar results have also been suggested by recent studies (e.g., Ahmed et al. 2016; Zhu et al. 2016; Sawala et al. 2016; Zolotov et al. 2012). Therefore, the inclusion of baryonic impacts may solve the discrepancy in the DoS anisotropy from previous simulations (Pawlowski et al., 2015a; Sawala et al., 2016).
4 Conclusions
In summary, we have performed a comprehensive reanalysis of the observed satellites of the MW using different plane identification methods and sample size. We have carried out Monte Carlo simulations to investigate the effects of sample size on the DoS properties, have calculated the future evolution of the 11 classical satellites in order to test the stability of the current DoS, and have compared two cosmological simulations in order to understand the evolution of satellites and effects of baryons on the DoS properties. We find that the measured DoS properties strongly depends on the plane identification method and the sample size, and that a small sample size may artificially show high anisotropy and strong clustering. Furthermore, we find that the DoS structure may be transient, and that baryonic processes play an important role in determining the distribution of satellites. We conclude that the evidence for an ultra-thin, coherently-rotating DoS of the MW is not conclusive. Our findings suggest that the spatial distribution and kinematic properties of satellites may be determined by the assembly history and dynamical evolution of each individual galaxy system, rather than being a universal DoS phenomenon.
5 Acknowledgments
YL acknowledges support from NSF grants AST-0965694, AST-1009867, AST-1412719 and MRI-1626251. We thank the anonymous referee, and Dr. Marcel Pawlowski and Dr. Yohan Dubois for thoughtful comments which have helped improve our manuscript. We acknowledge the Institute For CyberScience at The Pennsylvania State University for providing computational resources and services that have contributed to the research results reported in this paper. The Institute for Gravitation and the Cosmos is supported by the Eberly College of Science and the Office of the Senior Vice President for Research at the Pennsylvania State University.
References
- Ahmed et al. (2016) Ahmed, S. H., Brooks, A. M., & Christensen, C. R. 2016, ArXiv e-prints
- Allgood et al. (2006) Allgood, B., Flores, R. A., Primack, J. R., Kravtsov, A. V., Wechsler, R. H., Faltenbacher, A., & Bullock, J. S. 2006, MNRAS, 367, 1781
- Aubert et al. (2004) Aubert, D., Pichon, C., & Colombi, S. 2004, MNRAS, 352, 376
- Bahl & Baumgardt (2014) Bahl, H., & Baumgardt, H. 2014, MNRAS, 438, 2916
- Bovy (2015) Bovy, J. 2015, ApJS, 216, 29
- Buck et al. (2016) Buck, T., Dutton, A. A., & Macciò, A. V. 2016, MNRAS, 460, 4348
- Cautun et al. (2015a) Cautun, M., Bose, S., Frenk, C. S., Guo, Q., Han, J., Hellwing, W. A., Sawala, T., & Wang, W. 2015a, MNRAS, 452, 3838
- Cautun et al. (2015b) Cautun, M., Wang, W., Frenk, C. S., & Sawala, T. 2015b, MNRAS, 449, 2576
- Clarke (1946) Clarke, R. D. 1946, Journal of the Institute of Actuaries, 72, 481–481
- Conn et al. (2013) Conn, A. R., Lewis, G. F., Ibata, R. A., Parker, Q. A., Zucker, D. B., McConnachie, A. W., Martin, N. F., Valls-Gabaud, D., Tanvir, N., Irwin, M. J., Ferguson, A. M. N., & Chapman, S. C. 2013, ApJ, 766, 120
- Helmi et al. (2003) Helmi, A., White, S. D. M., & Springel, V. 2003, MNRAS, 339, 834
- Henriksen & Widrow (1997) Henriksen, R. N., & Widrow, L. M. 1997, Physical Review Letters, 78, 3426
- Ibata et al. (2014) Ibata, N. G., Ibata, R. A., Famaey, B., & Lewis, G. F. 2014, Nature, 511, 563
- Ibata et al. (2013) Ibata, R. A., Lewis, G. F., Conn, A. R., Irwin, M. J., McConnachie, A. W., Chapman, S. C., Collins, M. L., Fardal, M., Ferguson, A. M. N., Ibata, N. G., Mackey, A. D., Martin, N. F., Navarro, J., Rich, R. M., Valls-Gabaud, D., & Widrow, L. M. 2013, Nature, 493, 62
- Johnson & Soderblom (1987) Johnson, D. R. H., & Soderblom, D. R. 1987, AJ, 93, 864
- Knollmann & Knebe (2009) Knollmann, S. R., & Knebe, A. 2009, ApJS, 182, 608
- Koposov et al. (2015) Koposov, S. E., Belokurov, V., Torrealba, G., & Evans, N. W. 2015, ApJ, 805, 130
- Kroupa et al. (2005) Kroupa, P., Theis, C., & Boily, C. M. 2005, A&A, 431, 517
- Libeskind et al. (2005) Libeskind, N. I., Frenk, C. S., Cole, S., Helly, J. C., Jenkins, A., Navarro, J. F., & Power, C. 2005, MNRAS, 363, 146
- Libeskind et al. (2014) Libeskind, N. I., Knebe, A., Hoffman, Y., & Gottlöber, S. 2014, MNRAS, 443, 1274
- Lipnicky & Chakrabarti (2016) Lipnicky, A., & Chakrabarti, S. 2016, ArXiv e-prints
- Lovell et al. (2011) Lovell, M. R., Eke, V. R., Frenk, C. S., & Jenkins, A. 2011, MNRAS, 413, 3013
- Lynden-Bell (1976) Lynden-Bell, D. 1976, MNRAS, 174, 695
- Marinacci et al. (2014) Marinacci, F., Pakmor, R., & Springel, V. 2014, MNRAS, 437, 1750
- McConnachie (2012) McConnachie, A. W. 2012, AJ, 144, 4
- McConnachie et al. (2009) McConnachie, A. W., Irwin, M. J., Ibata, R. A., Dubinski, J., Widrow, L. M., Martin, N. F., Côté, P., Dotter, A. L., Navarro, J. F., Ferguson, A. M. N., Puzia, T. H., Lewis, G. F., Babul, A., Barmby, P., Bienaymé, O., Chapman, S. C., Cockcroft, R., Collins, M. L. M., Fardal, M. A., Harris, W. E., Huxor, A., Mackey, A. D., Peñarrubia, J., Rich, R. M., Richer, H. B., Siebert, A., Tanvir, N., Valls-Gabaud, D., & Venn, K. A. 2009, Nature, 461, 66
- Metz et al. (2008) Metz, M., Kroupa, P., & Libeskind, N. I. 2008, ApJ, 680, 287
- Navarro et al. (1996) Navarro, J. F., Frenk, C. S., & White, S. D. M. 1996, ApJ, 462, 563
- Papastergis & Shankar (2016) Papastergis, E., & Shankar, F. 2016, A&A, 591, A58
- Pawlowski et al. (2015a) Pawlowski, M. S., Famaey, B., Merritt, D., & Kroupa, P. 2015a, ApJ, 815, 19
- Pawlowski & Kroupa (2013) Pawlowski, M. S., & Kroupa, P. 2013, MNRAS, 435, 2116
- Pawlowski et al. (2015b) Pawlowski, M. S., McGaugh, S. S., & Jerjen, H. 2015b, MNRAS, 453, 1047
- Phillips et al. (2015) Phillips, J. I., Cooper, M. C., Bullock, J. S., & Boylan-Kolchin, M. 2015, MNRAS, 453, 3839
- Sawala et al. (2016) Sawala, T., Frenk, C. S., Fattahi, A., Navarro, J. F., Bower, R. G., Crain, R. A., Dalla Vecchia, C., Furlong, M., Helly, J. C., Jenkins, A., Oman, K. A., Schaller, M., Schaye, J., Theuns, T., Trayford, J., & White, S. D. M. 2016, MNRAS, 457, 1931
- Smith et al. (2015) Smith, R., Flynn, C., Candlish, G. N., Fellhauer, M., & Gibson, B. K. 2015, MNRAS, 448, 2934
- Tempel et al. (2014) Tempel, E., Stoica, R. S., Martínez, V. J., Liivamägi, L. J., Castellan, G., & Saar, E. 2014, MNRAS, 438, 3465
- Zhu et al. (2016) Zhu, Q., Marinacci, F., Maji, M., Li, Y., Springel, V., & Hernquist, L. 2016, MNRAS, 458, 1559
- Zolotov et al. (2012) Zolotov, A., Brooks, A. M., Willman, B., Governato, F., Pontzen, A., Christensen, C., Dekel, A., Quinn, T., Shen, S., & Wadsley, J. 2012, ApJ, 761, 71