Decay of COSAC and Ptolemy Mass Spectra at Comet 67P/Churyumov-Gerasimenko
Context. The Rosetta lander Philae successfully landed on the nucleus of comet 67P/Churyumov-Gerasimenko on 12 November 2014. Philae is equipped with two gas analyzers: The Cometary Sampling and Composition experiment (COSAC) and the gas chromatograph and mass spectrometer Ptolemy.
Aims. COSAC is designed for in situ analysis of organic molecules on 67P while Ptolemy is optimised to measure ratios of stable isotopes.
Methods. On 12 to 14 November 2014 both instruments measured the organic composition of the comet nucleus material through seven measurements in sniffing mode during Philae’s hopping and at its final landing site Abydos. We compare the temporal evolution of intensities of several ion species identified by both mass spectrometers. For COSAC this is the first analysis of the temporal behaviour of the measured ion species.
Results. All ion species showed the highest intensities in the first spectra measured by both instruments about 20 to 30 minutes after Philae’s first touchdown at Agilkia, and a decay during the six consecutive measurements at Abydos. Both instruments measured a nearly identical decay of the water peak ( 18), and also CO ( 28) behaved similarly. In the COSAC measurements the peak at 44 decays much slower than all the other ion species, including the water peak. In particular, the 44 peak decays much slower in the COSAC measurements than in the Ptolemy data. This supports our earlier interpretation that COSAC for the first time analyzed a regolith sample from a cometary nucleus in situ, while Ptolemy measured cometary gas from the ambient coma. The 44 peak measured by COSAC was likely dominated by organic species, whereas the peak measured by Ptolemy was interpreted to be mostly due to . Ion species heavier than 30 tend to decay somewhat slower in the COSAC measurements than in the Ptolemy data, which may be related to differences in the exhaust designs between both instruments.
Key Words.:
Astrochemistry, Comets individual: 67P/Churyumov-Gerasimenko, Comets: general, Astrobiology, Space vehicles: instruments1 Introduction
On 12 November 2014 Philae successfully landed on its target comet 67P/Churyumov-Gerasimenko (hereafter 67P) at a heliocentric distance of 2.99 AU (Biele et al. 2015). Philae carries two evolved gas analyzers on board: The Cometary Sampling and Composition (COSAC) experiment designed for in situ analysis of organic molecules on 67P (Goesmann et al. 2007) and the gas chromatograph/mass spectrometer Ptolemy optimised to measure ratios of stable isotopes (Wright et al. 2007).
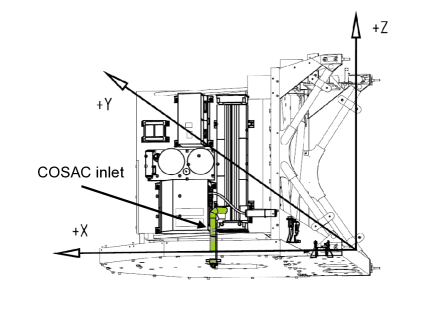
Both instruments were successfully operated from 12 to 14 November 2014 during Philae’s hopping and at its final landing site Abydos (during the so-called First Science Sequence of Philae). In this time interval COSAC performed seven measurements in so-called sniffing mode (this term refers to a direct measurement of the ambient volatiles released from the comet, without prior gas chromatographic separation). Results from the first of these measurements obtained about 25 minutes after the first touchdown at Agilkia were published by Goesmann et al. (2015), while the remaining six COSAC spectra obtained at Abydos were not previously described in detail. From the circumstances of the first touchdown it is believed that COSAC collected with its twin vent tubes – located at the bottom of Philae pointing toward the cometary surface (Figure 1, left panel) – a tiny amount of the cometary regolith that was raised in a dust cloud during touchdown and later sublimed inside the instrument (Goesmann et al. 2015). A dust cloud was indeed recorded by the Rosetta navigation camera close to Agilkia a few minutes after touchdown, approximately of material was excavated (Biele et al. 2015).
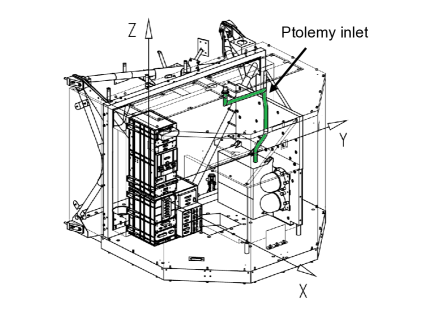
Ptolemy measurements were taken 12 to 15 minutes before each of the seven COSAC measurements. Results were published by Wright et al. (2015) and Morse et al. (2015). In the latter paper the authors consider the temporal evolution of three abundant cometary species: , CO and . Ptolemy likely collected ambient gas, which during the first measurement consisted of the ambient coma as well as additional gas from the recently disturbed regolith and dust cloud, because Ptolemy’s vent tubes are located at the top of Philae and were pointing away from the cometary surface at the time of the measurements (Figure 1, right panel).
In this paper we evaluate the time evolution of several ion species that were identified in the COSAC and Ptolemy spectra, with a particular emphasis on the peaks at a mass per unit charge 18, 28 and 44 (, CO and partially ).
2 Analysis
| Meas. | Day | UTC | TIC | |||||||||||||||
|---|---|---|---|---|---|---|---|---|---|---|---|---|---|---|---|---|---|---|
| Number | 2014 | [hh:mm] | 15 | 16 | 17 | 18 | 27 | 28 | 29 | 30 | 31 | 43 | 44 | 45 | 57 | 59 | 61 | |
| 0 | 16 Oct | 14:30 | 373 | 1 | 5 | 2 | 19 | 2 | 23 | 4 | 2 | 3 | 2 | 23 | 0 | 0 | 2 | 0 |
| 1 | 12 Nov | 16:02 | 19242 | 141 | 59 | 536 | 2521 | 70 | 137 | 172 | 62 | 77 | 112 | 121 | 114 | 95 | 65 | 30 |
| 2 | 13 Nov | 06:48 | 5161 | 10 | 25 | 178 | 797 | 12 | 43 | 22 | 6 | 9 | 16 | 93 | 4 | 5 | 5 | -3 |
| 3 | 13 Nov | 08:50 | 2915 | 15 | 20 | 91 | 393 | 6 | 35 | 12 | 7 | 0 | 10 | 85 | 0 | 3 | -6 | -4 |
| 4 | 13 Nov | 10:52 | 1962 | 4 | 0 | 56 | 210 | 1 | 23 | 16 | 11 | 8 | 2 | 74 | 0 | 0 | -1 | -1 |
| 5 | 13 Nov | 12:54 | 1651 | 6 | 10 | 47 | 188 | 8 | 28 | 16 | 3 | -2 | 9 | 60 | 1 | 1 | -1 | 4 |
| 6 | 14 Nov | 02:59 | 798 | 6 | 9 | 11 | 56 | 7 | 30 | 4 | 0 | 2 | 2 | 40 | 0 | 0 | 0 | 0 |
| 7 | 14 Nov | 12:44 | 728 | 0 | 6 | 11 | 63 | 1 | 20 | 2 | 0 | 1 | 8 | 46 | 1 | 2 | 0 | 2 |
Notes. The noise is about 10 ion counts per integer bin.
| Meas. | Day | UTC | TIC | |||||||||||
|---|---|---|---|---|---|---|---|---|---|---|---|---|---|---|
| Number | 2014 | [hh:mm] | 15 | 18 | 27 | 28 | 30 | 31 | 43 | 44 | 57 | 59 | 61 | |
| 0 | 16 Oct | 17:23 | 171 | 2 | 112 | 2 | 5 | 2 | 0 | 0 | 10 | 3 | 1 | 0 |
| 1 | 12 Nov | 15:54 | 6721 | 150 | 2142 | 38 | 211 | 45 | 314 | 257 | 575 | 414 | 130 | 79 |
| 2 | 13 Nov | 06:35 | 923 | 10 | 610 | 10 | 20 | 1 | 7 | 15 | 107 | 3 | 3 | 6 |
| 3 | 13 Nov | 08:37 | 455 | 6 | 304 | 2 | 9 | 1 | 3 | 8 | 64 | 3 | 1 | 1 |
| 4 | 13 Nov | 10:39 | 284 | 2 | 191 | 2 | 6 | 1 | 1 | 7 | 38 | 1 | 1 | 2 |
| 5 | 13 Nov | 12:41 | 117 | 8 | 79 | 1 | 2 | 1 | 1 | 4 | 17 | 1 | 1 | 1 |
| 6 | 14 Nov | 02:54 | 39 | 0 | 21 | 0 | 1 | 0 | 0 | 4 | 6 | 0 | 0 | 0 |
| 7 | 14 Nov | 12:36 | 54 | 0 | 22 | 0 | 2 | 0 | 1 | 2 | 23 | 0 | 0 | 0 |
Notes. Entries for 18 () are the sum of ion species at 16, 17, 18 and 19; those at 28 (CO) are the sum of 28 and 29 and those for 44 () are the sum of 44 and 45 (Morse et al. 2015).
Philae reached the comet surface and made its first touchdown on 12 November 2014, 15:34:04 UTC at the Agilkia landing site. Instead of a nominal landing, Philae bounced and continued its journey across the surface of 67P and finally came to rest at Abydos at 17:31:17 UTC, about two hours after its first touchdown. The first COSAC spectrum was taken about 25 minutes after the first touchdown during Philae’s hoppings, and the following six spectra were collected at Abydos on 13 and 14 November 2014 (Table 1). An additional COSAC spectrum that was taken on 16 October 2014 at a distance of about 10 km from the nucleus we take as a reference for the instrumental background (measurement #0 in Table 1). The instrumental settings were identical for all measurements so that we can directly compare these data.
Our analysis is based on peak lists generated from each spectrum. The peak lists contain the total number of ions counted in predefined mass bins centred close to the integer of the respective peak, after subtraction of background noise determined in separate bins adjacent to the peak. Table 1 lists the total number of ions for the most intense peaks in the COSAC spectra. Details about the algorithm for generating the peak lists can be found in Goesmann et al. (2015, Supplementary Material).
Figure 2 (left) shows peak intensities derived from the COSAC peak lists. The noise level is approximately 10 ion counts per integer bin, and only in the first spectrum do many ion species show a much higher count rate significantly above the noise level. Intensities extracted from the first five spectra for ion species 18, 28, 44 and for the total ion counts (TIC) show an approximate exponential drop during the initial 22 hours after Philae’s first touchdown. Peak intensities for the other species are very much influenced by noise (see Table 1). The peak intensities for all ion species tend to level off approximately 20 hours after touchdown, indicating that they become dominated by noise. We therefore ignore the last two COSAC spectra in our analysis.
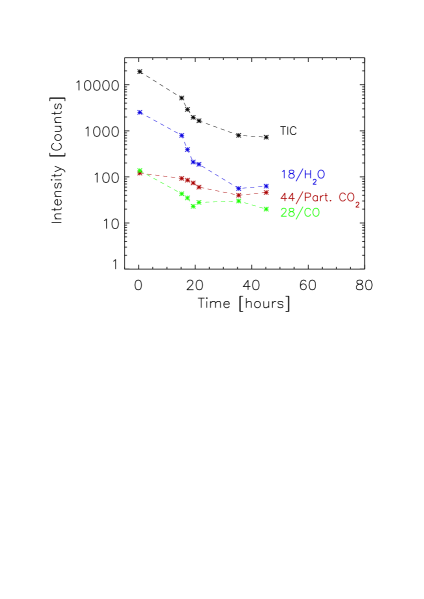
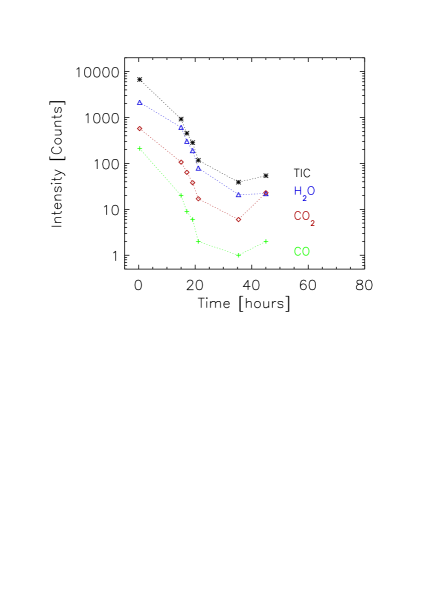
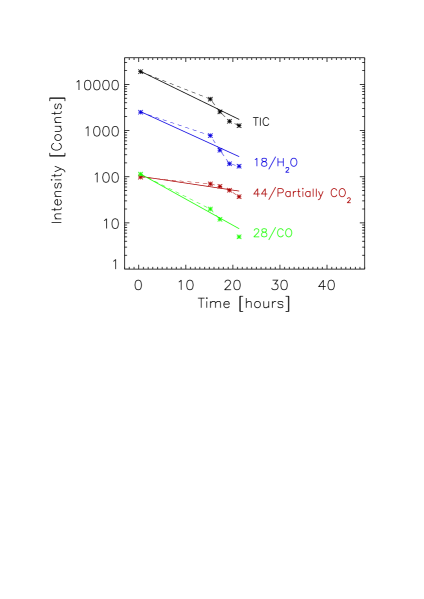
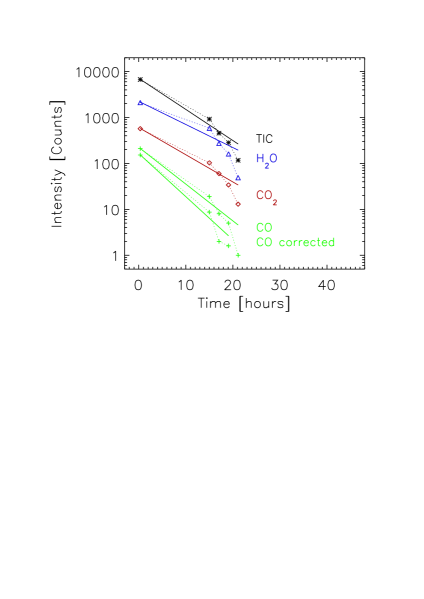
Figure 2 (right panel) shows Ptolemy data for , CO and measured between 12 and 14 November 2014 (Morse et al. 2015). It should be noted that the ion counts given for these three species are summed ion counts for up to four bins to account for hydrogen abstraction (i.e. the addition or subtraction of one or more protons to the ion species under consideration): 16, 17, 18 and 19 to derive the intensities of , 28 and 29 for CO and 44 and 45 to get the intensity of . The analysis of the Ptolemy data was described in detail by Morse et al. (2015). The peak intensities for , CO and measured with Ptolemy level off after approximately 20 hours and display a flattening similar to that found in the COSAC measurements. Therefore, we also ignore these two final Ptolemy spectra.
We assumed that comet material entered the COSAC vent tubes (Figure 1, left panel) which – during Philae’s first touchdown at Agilkia – pointed downwards, i.e. towards the cometary nucleus (Goesmann et al. 2015). Once inside COSAC the material was heated to so that gases could evolve from the grains. In the ideal case of a closed system and with enough material available, the partial pressure in the system would have increased with time up to the relevant vapor pressure at the tube temperature. The real system, however, is not closed and gas could escape from the tubes. Therefore, we assume an approximately exponential pressure drop in the tubes.
No thermal sensors are located on the vent tubes of COSAC, therefore the temperature can only be derived indirectly based on the temperatures of the closest thermal sensors on board Philae and on simulations with a thermal mathematical model. The analysis based on the temperature recorded during Philae’s operation at 67P by two COSAC sensors at the electronic box and on the gas chromatograph and the Philae baseplate sensor showed a temperature variation from the first touchdown to the end of Philae’s operation at Abydos. The simulations showed that the temperature at the COSAC mass spectrometer likely dropped from at first touchdown to (Cozzoni 2016) at the time when measurement #5 was performed, and a similar drop can be expected for the exhaust tubes as well. The Ptolemy internal temperature sensor measured a drop by only 4 K from 273 K to 269 K between measurement #1 and #5 (Morse et al. 2015, their Tab. 1).
Even though the temperature of COSAC dropped by about 20 K during the analysis period reported here, it remained much higher than the cometary environment and should have only marginally contributed toward species decay in the instrument. We therefore make the simplifying assumption that the temperature remained constant. We believe this is a reasonable assumption because also at about 260 K, the gas pressure in the system remained far below the vapor pressure of the three species considered (otherwise our mass spectra would have been saturated). Then – to a first order approximation – the pressure of each individual species should follow an exponential decay curve. For Ptolemy we made a similar assumption with the exception that ambient coma gas entered the vent tubes of Ptolemy, which pointed away from the comet surface.
In Figure 3 we show the temporal behaviour of , CO and in the COSAC and Ptolemy spectra during the initial 22 hours after touchdown at Agilkia. (measurement #1 to #5 in Tables 1 and 2). For both instruments in measurement #1 all peaks were above the background noise level while in the later spectra many peaks, in particular all peaks above 45, had dropped to the background level. For COSAC we subtracted the peak intensities derived from this reference spectrum from the other measurements in order to correct for instrumental background. Note that the background of 18 was quite low and thus the correction is not significant; only the results for 28 are affected by the background correction.
It should be noted that in our analysis of the COSAC spectra we also consider peaks for ion species with a rather low count rate. This applies in particular to peaks at 30, 31, 45, 57 and 59. In these cases, only the COSAC spectrum #1 showed strong intensities well above the noise level, which is estimated at about 10 counts per integer bin. In the other spectra measured 15 to 22 hours later these peaks are very weak and, thus, the slopes we derive here are likely lower limits for the true slopes. Hence, the peaks for these species likely dropped even faster than implied by our slope fitting.
The Ptolemy data for , CO and were taken from Morse et al. (2015, their Tab. 3). To the CO peak for Ptolemy we applied a correction for the contribution of fragments to the CO peak. We assumed a ratio of 10/1 based on the NIST database (Stein 2015; Morse et al. 2015). The corrected and uncorrected data are compared in Figure 3.
We also applied a correction for instrumental background to the Ptolemy data. We assumed 30, 2 and 4 counts for , CO and , respectively, measured beyond 30 km from the nucleus (Morse et al. 2015). The effect of this correction is very small, changing the fitted slope only in the third digit after the decimal point. We assumed a zero background for all the other species. The correction for instrumental background in the Ptolemy data is thus totally negligible in our analysis.
3 Results
| Slope | ||
|---|---|---|
| COSAC | Ptolemy | |
| TIC | ||
| 15 | ||
| 16 | – | |
| 17 | – | |
| 18 | ||
| 27 | ||
| 28 | ||
| 29 | – | |
| 30 | ||
| 31 | ||
| 43 | ||
| 44 | ||
| 45 | – | |
| 57 | ||
| 59 | ||
| 61 | ||
Notes. A weighting of the individual data points was used for the fits, being the intensity (counts) of the respective peak. The uncertainties given are uncertainties for the slopes of the fit curves.

In Figure 4 we compare the slopes derived from fitting exponentials to the count rates of the individual peaks in the COSAC and Ptolemy spectra. For the fit each data point was weighted with the square root of the total number of ion counts in the peak. This assures that peaks with a higher statistical significance get a higher weight in the fit. Figure 4 shows that the temporal behaviour differs between individual ion species.
3.1 COSAC
In the COSAC spectra the peak at 44 exhibits the slowest drop of all peaks considered in our analysis. It decays significantly slower than, for example, the water peak at 18. For both COSAC and Ptolemy the peak at 18 is by far the strongest in the spectra (Tab. 1 and 2). Furthermore, in the COSAC spectra the slope for the total ion counts (TIC) is indistinguishable within the measurement accuracy from the slope of the peak (Tab. 3) .
For COSAC the slopes tend to fall into two or, possibly, three categories:
-
A)
Most of the species show a trend very similar to the water peak. This is particularly obvious for 17, 27, 28 and 30.
- B)
-
C)
15, 45, 57 and 59 show a somewhat steeper decrease than water. However, given the low number of counts, all of these species may also be compatible with the water peak.
3.2 Ptolemy
In Figure 4 the entries for 18, 28 and 44 for Ptolemy are the summed up values from several other peaks: The groups defined by Morse et al. (2015) – water, CO, , TIC and ’other’ – were defined to correct for the effects of hydrogen abstraction, a feature of the ion trap (see also Section 2). We can therefore directly compare the slopes for these species derived from COSAC and Ptolemy. For ion species at other values, hydrogen abstraction can shift the peak location depending on the affected molecule and without a detailed knowledge of the underlying molecule, no correction for hydrogen abstraction can be applied.
The results from Ptolemy are generally similar to the COSAC results, except for 44 (mostly in the case of Ptolemy). A variation in the decay of the peak intensities is also evident in the Ptolemy spectra. The 18 peak shows striking agreement with the value measured by COSAC. For Ptolemy, the water peak decays somewhat slower than do the total ion counts.
Up to 30 the peaks in the Ptolemy spectra show a similar trend to those found for COSAC, while heavier species tend to decay somewhat faster than for COSAC. The most significant difference occurs for 44. For Ptolemy the decay of this peak is close to the value measured for water while for COSAC, this peak decays much more slowly. It supports our earlier interpretation that Ptolemy and COSAC measured different samples of cometary material (see Section 4).
4 Discussion
The interpretation of the COSAC data put forward by Goesmann et al. (2015) is in conformity with data interpretations from other scientific payloads made both aboard the Philae Lander and the Rosetta Orbiter. For instance, data from the Surface Electrical Sounding and Acoustic Monitoring Experiment (SESAME) on Philae and Philae’s landing gear indicated that Agilkia apparently has a soft and granular surface ( in thickness) on top of a more rigid, icy subsurface (Roll et al. 2016; Roll & Witte 2016). In contrast, Abydos was found to consist mostly of rigid, icy material (Biele et al. 2015; Spohn et al. 2015).
The Visual Infrared and Thermal Imaging Spectrometer (VIRTIS) on board Rosetta revealed that solar insolation causes sublimation of ice, mostly from the uppermost surface layers. When in shadow or on the night-side a temperature inversion is present between the now colder surface and a subsurface that remains warmer for a longer duration. These observed diurnal variations probably trigger the sublimation-condensation cycle on the nucleus of 67P (De Sanctis et al. 2015, see also below).
On 12 November, when Philae impacted on the solar-illuminated Agilkia, it excavated of regolith from 67P’s top surface layer (Biele et al. 2015). De Sanctis et al. (2015) discussed in detail a temperature gradient that exists between the top layer of the surface, which is reported to have a temperature between about 180 K and 230 K during daytime whereas the temperature of the subsurface, at a depth of 4 cm is, even during daytime, only about 130 K. Therefore, we infer that Philae’s excavation would have suddenly exposed the colder subsurface to the higher temperatures of the solar insolated surface and that this process would have rapidly caused the sublimation of volatile species from dust grains present in the subsurface. Further, these volatilized species entered the COSAC and Ptolemy mass spectrometers. In the case of COSAC, the measurement was likely dominated by gases which vaporized from grains after they entered the exhaust tubes and were warmed up later by the lander interior rather than sunlight. COSAC was at a much higher temperature ( to 280 K) as measured by the thermal sensors on the COSAC electronic box and on the gas chromatograph (Goesmann et al. 2015; Cozzoni 2016).
COSAC measured six mass spectra at the final landing site, Abydos. However, unlike in the first mass spectrum, these spectra did not generate peaks that could be attributed to organic species. Abydos is a geologically and thermally distinct site when compared to Agilkia. Abydos was almost permanently in shadow with low diurnal surface temperatures ranging from 90 K to 130 K and has a hard sintered surface with limited regolith (Spohn et al. 2015). The lower temperature likely prohibited sublimation of volatile organic species which thus could not diffuse into the COSAC mass spectrometer during all later six sniffing mode measurements. Very low cometary activity close to Philae during the COSAC and Ptolemy measurements at Abydos was also indicated by measurements with the Dust Impact Monitor on board Philae which did not detect any dust impact during five hours of measurement time (Krüger et al. 2015).
We emphasize the distinct locations of COSAC’s and Ptolemy’s vent tubes that enabled their respective sniffing mode mass spectrometer operations. COSAC’s vent tubes are located at the bottom plate of the lander and opened toward the surface of the nucleus. However, Ptolemy’s vent tubes are located on top of the lander and opened toward the ”zenith“ (i.e. the cometary coma and open space; cf. Figure 1). The COSAC tubes do not have a cover at their orifice, while the Ptolemy tube is shielded by a table-like structure so as to prevent in-falling dust from entering directly. It is about 5 cm x 5 cm in size and located about 2 cm above the vent tube’s orifice.
Goesmann et al. (2015) during the course of their investigations had initially ascribed 44 in the first COSAC mass spectrum entirely to ; but doing so did not yield an appropriate mass fit to the other peaks especially those at 57, 58 and 59. They however did not rule out a minor contribution from to the 44 peak. The most relevant species that they ascribed to this 44 peak and which generated a sensible fit with other peaks were acetaldehyde (, accounting for approximately 56% of the total peak intensity), formamide (, 21%) and acetamide (, 23%). The interpretation of this fit to the first COSAC spectrum is presently under re-investigation (K. Altwegg et al., personal communication).
Contrary to COSAC’s mass spectral interpretation, Wright et al. (2015) concluded that was the major contributor to the 44 and 45 peaks measured by Ptolemy. Acetaldehyde, formamide and acetamide are comparatively less volatile than and could possibly be a constituent species of the subsurface cometary grains that probably entered the COSAC vent tubes immediately after impact excavation. Owing to the zenith directed position of Ptolemy’s vent tubes and a siphon-shaped inlet (Figure 1, right panel), also preventing grains from entering the system, its mass spectrometer could not have received organic-abundant grains from the impact-excavated subsurface directly. During the landing event, the coma composition would have been modified by gas vaporising from newly excavated dust exposed to solar illumination and contact with the lander (including the entrance to the Ptolemy vent tubes), thus explaining the high concentration of organics measured compared to orbiter measurements (Hässig et al. 2015). Wright et al. (2015) therefore confirm measuring gaseous present in the nebulous coma atmosphere over the illuminated nucleus surface. The different slopes of the 44 peak as measured by both COSAC and Ptolemy indicate they have indeed analyzed different species, sampled via their distinctly positioned vent tubes, and originating from different environments on the comet.
A requirement to support our interpretation would be precise information about the phase transitions or vapour pressures of volatile organic species at extremely low temperatures and low-pressure conditions (typical of cometary environments). Phase transition studies of most organic species are derived using mathematical equations such as the Clausius-Clapeyron relation, Lee-Kesler method and Antoine equation. These and other similar equations usually generate appropriate vapour pressure values of chemical species existing under terrestrial conditions. Few empirical attempts to extrapolate the sublimation-condensation curves of volatile species , CO and at extremely low pressures and temperatures were made in the past (Yamamoto et al. 1983; Prialnik et al. 2005; Hübner et al. 2006; Fray & Schmitt 2009). However empirical extrapolations of vapour pressures at astrophysically relevant temperatures are not always accurate (Fray & Schmitt 2009). Even if accurate, most of these extrapolations are made assuming the species to be each in a pure ice configuration.
A comet’s surface material is heterogeneous and consists of complex refractory organic material, inorganic minerals, and a mixture of ices of several chemical species. For example, VIRTIS has demonstrated the presence of non-volatile refractory organic material on the surface that could be formed by ultraviolet or energetic particle irradiation of high-volatility carbon-containing ices like , CO and . So the precise vapour pressures of chemical species in such complex mixtures cannot be derived from the values of their pure ice counterparts. Determination of vapour pressures of organic chemical species existing in diverse astrophysical environments is a robust task that should be carried out before related astrophysics and astrochemical studies can be mounted.
The situation is further complicated by the fact that species embedded as minor components in a matrix do not sublimate at their pure ice sublimation temperatures or a temperature related to their vapor pressure. Instead, they can be released at higher temperatures by so-called “volcano” desorption due to phase changes occurring in the ice between different amorphous structures or from an amorphous to a crystalline phase, or by codesorption with water. Only very volatile species can desorb to a small part already at lower temperatures (Collings et al. 2004). These desorption processes were studied in the laboratory with cometary analogue materials (Martín-Doménech et al. 2014). In the experiments the desorption occured at temperatures below 180 K, i.e. at temperatures below the likely daytime temperature at the cometary surface (see above), rendering them rather unlikely in our case. At present, however, we cannot exclude that such desorption occurred in the cometary sample analyzed by COSAC.
5 Summary
We have investigated the temporal behaviour of various ion species in mass spectra measured with the mass spectrometers COSAC and Ptolemy on board the Rosetta lander Philae. Each instrument measured seven spectra, one during Philae’s hopping about 20 to 30 minutes after touchdown at Agilkia and six consecutive spectra at Philae’s final landing site Abydos. Results from the first COSAC measurements obtained about 25 minutes after the first touchdown at Agilkia were published by Goesmann et al. (2015). It is the first in situ analysis of a nucleus regolith sample from a comet. The remaining six COSAC spectra obtained at Abydos were not previously presented in detail. The Ptolemy data were discussed by Wright et al. (2015) and Morse et al. (2015).
The ion intensities measured with both instruments are strongest in the spectra measured right after Philae’s touchdown at Agilkia and decreased later after Philae came to rest at Abydos. For most ion species, in particular water, the measured decay rates are in good agreement between both instruments. A striking difference is seen for 44: This peak drops significantly more slowly in the COSAC spectra than in the Ptolemy spectra and, in the COSAC spectra, it exhibits the shallowest drop of all ion species investigated.
The difference in the slopes of the 44 peak as measured by COSAC and Ptolemy indicates that both instruments measured different ion species at this . It supports earlier results by Goesmann et al. (2015) and Wright et al. (2015), indicating that COSAC measured for the first time cometary nucleus material from the Agilkia landing site while Ptolemy measured the composition of the ambient gas, i.e. coma plus gas vaporised from disturbed dust. Unfortunately, the limited operational lifetime of Philae did not allow for further measurements and improved data.
Acknowledgements
This research was supported by the German Bundesministerium für Wirtschaft und Energie through Deutsches Zentrum für Luft- und Raumfahrt e.V. (DLR, grant 50 QP 1302). Support by MPI für Sonnensystemforschung is gratefully acknowledged as is the Programme de Development d’Experiences Scientifiques administered by Enterprise Ireland (SMcKL). FR and CS wish to thank CNES for its financial support to COSAC activities. CG gratefully acknowledges ELSI Origins Network (EON) which is supported by a grant from the John Templeton Foundation. We thank the Rosetta project at ESA, the Philae project at DLR and CNES and the Philae Lead Scientists for effective and successful mission operations. We would like to acknowledge the work of Helmut Rosenbauer and Colin Pillinger who are both unfortunately no longer with us. They envisaged the instruments and made them become reality so that we can harvest what they seeded.
References
- Biele et al. (2015) Biele, J., Ulamec, S., Maibaum, M., et al. 2015, Science, 349, aaa9816
- Collings et al. (2004) Collings, M. P., Anderson, M. A., Chen, R., et al. 2004, Monthly Notice of the Royal Astro. Soc., 354, 1133
- Cozzoni (2016) Cozzoni, B. 2016, Temperature of COSAC Vent-pipe during FSS, Philae internal technical note
- De Sanctis et al. (2015) De Sanctis, M. C., Capaccioni, F., Ciarniello, M., et al. 2015, Nature, 525, 500
- Fray & Schmitt (2009) Fray, N. & Schmitt, B. 2009, Planetary and Space Science, 57, 2053
- Goesmann et al. (2015) Goesmann, F., Rosenbauer, H., Bredehöft, J.-H., et al. 2015, Science, 349, aab0689
- Goesmann et al. (2007) Goesmann, F., Rosenbauer, H., Roll, R., et al. 2007, Space Science Reviews, 128, 257
- Hässig et al. (2015) Hässig, M., Altwegg, K., Balsiger, H., et al. 2015, Science, 347, aaa0276
- Hübner et al. (2006) Hübner, W. F., Benkhoff, J., Capria, M.-T., et al. 2006, Heat and Gas Diffusion in Comet Nuclei (The International Space Science Institute, Bern, Switzerland, by ESA Publications Division, Noordwijk, The Netherlands, SR-004)
- Krüger et al. (2015) Krüger, H., Seidensticker, K. J., Fischer, H. H., et al. 2015, Astronomy and Astrophysics, 583, A15
- Martín-Doménech et al. (2014) Martín-Doménech, R., Muñoz Caro, G. M., Bueno, J., & Goesmann, F. 2014, Astronomy and Astrophysics, 564, A8
- Morse et al. (2015) Morse, A., Wright, I., & et al., A. 2015, Astronomy and Astrophysics, 583, A42
- Prialnik et al. (2005) Prialnik, D., Benkhoff, J., & Podolak, M. 2005, in Comets II, ed. M. C. Festou, H. U. Keller, & H. A. Weaver (University of Arizona Press), 359–387
- Roll & Witte (2016) Roll, R. & Witte, L. 2016, Planetary and Space Science, 125, 12
- Roll et al. (2016) Roll, R., Witte, L., & Arnold, W. 2016, Icarus, 280, 359
- Spohn et al. (2015) Spohn, T., Knollenberg, J., Ball, A. J., et al. 2015, Science, 349, aab0464
- Stein (2015) Stein, S. E. 2015, in NIST Chemistry WebBook, ed. P. J. Linstrom & W. G. Mallard, http://webbook.nist.gov
- Wright et al. (2007) Wright, I. P., Barber, S. J., Morgan, G. H., et al. 2007, Space Science Reviews, 128, 363
- Wright et al. (2015) Wright, I. P., Sheridan, S., Barber, S. J., et al. 2015, Science, 349, aab0673
- Yamamoto et al. (1983) Yamamoto, T., Nakagawa, N., & Fukui, Y. 1983, Astronomy and Astrophysics, 122, 171