New ALMA and Fermi/LAT Observations of the large-scale jet of PKS 0637-752 Strengthen the Case Against the IC/CMB Model
Abstract
The Chandra X-ray observatory has discovered several dozen anomalously X-ray-bright jets associated with powerful quasars. A popular explanation for the X-ray flux from the knots in these jets is that relativistic synchrotron-emitting electrons inverse-Compton scatter Cosmic Microwave Background (CMB) photons to X-ray energies (the IC/CMB model). This model predicts a high gamma-ray flux which should be detectable by the Fermi Large Area Telescope (LAT) for many sources. GeV-band upper limits from Fermi/LAT for the well-known anomalous X-ray jet in PKS 0637752 were previously shown in Meyer et al. (2015) to violate the predictions of the IC/CMB model. Previously, measurements of the jet synchrotron spectrum, important for accurately predicting the gamma-ray flux level, were lacking between radio and infrared wavelengths. Here we present new Atacama Large Millimeter/submillimeter Array (ALMA) observations of the large-scale jet at 100, 233 GHz, and 319 GHz which further constrain the synchrotron spectrum, supporting the previously published empirical model. We also present updated limits from the Fermi Large Area Telescope (LAT) using the new ‘Pass 8’ calibration and approximately 30% more time on source. With these deeper limits we rule out the IC/CMB model at the 8.7 level. Finally, we demonstrate that complete knowledge of the synchrotron SED is critical in evaluating the IC/CMB model.
1 Introduction
The radio-loud quasar PKS 0637752 (=0.651) was the first astrophysical source observed by the Chandra X-ray observatory, shortly after its launch in 1999. This source also gave us Chandra’s first scientific discovery, as it unexpectedly detected a kpc-scale X-ray jet associated with PKS 0637752, with a very high X-ray flux level and hard () spectrum which precluded it being the tail of the radio-optical synchrotron spectrum (Chartas et al., 2000; Schwartz et al., 2000). Nearly twenty years later, Chandra has now discovered several dozen more ‘anomalous’ X-ray jets, typically in powerful quasar sources, where the hard-spectrum X-ray flux is clearly from a second component, distinct from the radio-optical synchrotron spectrum which turns over before the infrared (see, e.g., Harris & Krawczynski, 2006; Hardcastle, 2006, for reviews).
In the initial discovery papers on PKS 0637752, Schwartz et al. (2000) and Chartas et al. (2000) ruled out thermal brehmstrahlung, synchrotron self-Compton, and inverse Compton off the Cosmic Microwave Background (IC/CMB) from a mildly relativistic flow as possible explanations for the anomalous X-ray flux in the jet, leaving open the possibility of a second synchrotron spectrum from an apparently co-spatial second electron energy distribution. Tavecchio et al. (2000) and Celotti et al. (2001) independently revisited the IC/CMB mechanism, finding that it could be consistent with the X-ray flux if the kpc-scale jet remains highly relativistic, with bulk Lorentz factors 10, and the jet is pointed within a few degrees of our line-of-sight. This version of the IC/CMB model has become by far the most popular explanation for the anomalous X-ray jets, always requiring small viewing angles and high bulk values (e.g., Sambruna et al., 2004; Jorstad & Marscher, 2006; Miller et al., 2006; Marshall et al., 2011; Perlman et al., 2011; Godfrey et al., 2012; Kharb et al., 2012; Stanley et al., 2015).
The IC/CMB model has come under criticism for several reasons, including unrealistically high jet power requirements, inability to explain jet-to-counterjet ratios in less highly beamed members of the parent source population, difficulty matching the ‘knotty’ jet structure, and unusually long jet lengths implied by the small viewing angle (Dermer & Atoyan, 2004; Jorstad & Marscher, 2004; Uchiyama et al., 2006; Hardcastle, 2006; Hardcastle et al., 2016). However, until recently there was no clear test of the IC/CMB model. The central difficulty is that both IC/CMB and a double-synchrotron models are able to reproduce the observed radio to X-ray SEDs of large-scale-jets equally well (e.g., see direct comparison in Cara et al., 2013).
Georganopoulos et al. (2006), hereafter G06 suggested that the Fermi/LAT would be able to break the degeneracy between these two models, by looking for the required high level of gamma-ray flux under the IC/CMB interpretation, which is obviously not expected under a second-synchrotron scenario. The Fermi test is extremely powerful because there are no free parameters at all involved in the predicted gamma-ray flux level: the IC/CMB spectrum is essentially an exact copy of the synchrotron spectrum, shifted in frequency and luminosity proportionally to and respectively (where is the magnetic field strength and the Doppler factor), and hence the requirement to set the normalization of the IC/CMB spectrum to match the X-ray flux completely fixes the gamma-ray flux level. An upper limit or a detection by Fermi significantly below the expected level at GeV energies would clearly rule out an IC/CMB origin for the anomalous X-rays.
In recent work, we have used upper limits from Fermi to rule out IC/CMB as the source of the kpc-scale X-rays at the 99.99% level in 3C 273, and at the 99.98% level in PKS 0637752 (Meyer & Georganopoulos, 2014; Meyer et al., 2015, hereafter M15). Although Fermi lacks the spatial resolution to detect the large-scale jet separately from the gamma-ray bright cores in these sources, we were able to derive deep upper limits using times when the cores were quiescent. In this letter, we present new ALMA observations and updated limits from Fermi/LAT which show that our original claims can be strengthened, and that IC/CMB is now ruled out in PKS 0637752 at the 8.7 level.
2 Data Analysis
We describe here new observations obtained from ALMA and the Fermi/LAT for PKS 0637752. All other data are taken from M15 and references therein.
2.1 ALMA
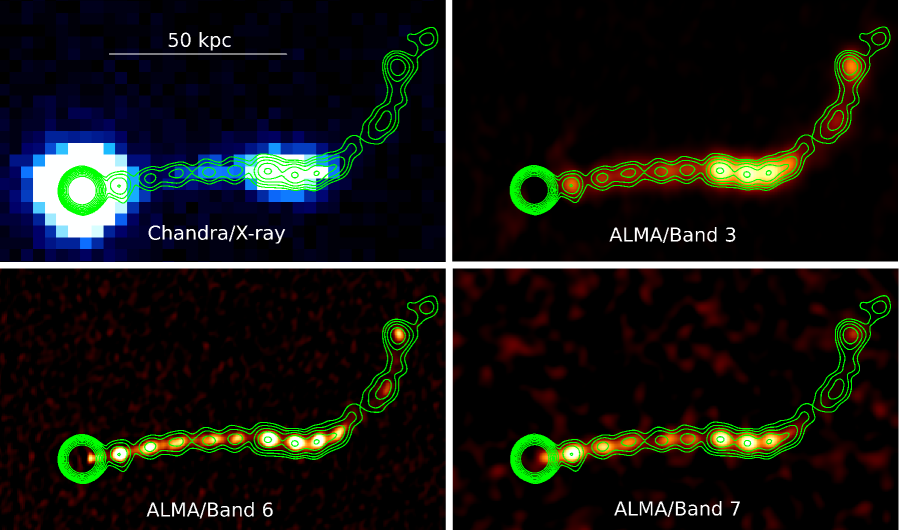
PKS 0637752 is a bright southern source which is routinely used as an ALMA calibrator. The ALMA data used in this paper have been taken from ALMACAL, a wide and deep submm survey which is being carried out using ALMA calibration observations (Oteo et al., 2016a, b). We refer the reader to Oteo et al. (2016a) for details on data extraction and calibration. Briefly, for each scheduling block of a given science project, we run the ALMA pipeline and extract the calibrated visibilities of all calibrators used. Then a run of self-calibration is carried out (always possible thanks to the brightness of the calibrators) and the dominant point-source component at the phase centre is subtracted from the calibrated visibilities. This subtraction is necessary to combine data taken in different configurations (and therefore different times) due to the variability of the core. Finally, for a given calibrator, we combine all available visibilities on each band to create a deep image (natural weighing is used during imaging). In the current phase of ALMACAL, there is available data for PKS 0637752 in ALMA bands 3 (), 6 () and 7 (). The sensitivity and beam size of each map (shown in Figure 1) are: and , and , and and .
We measured the fluxes for the X-ray brightest knot wk8.9 and the cluster of four X-ray bright knots in the ALMA band 3, 6 and 7 primary-beam-corrected maps using contours around each knot using casaviewer, as the knots are resolved (with total fluxes about twice that of the peak). For wk8.9, we measured fluxes in the three bands of 1.9, 3.2, and 2.6 mJy, respectively. For the combined knots the values are 6.0, 10.7, and 7.9 mJy. For all measurements, the error on the flux is dominated by the error on the absolute flux scale calibration; current estimates suggest 10% as the maximum value, which we use for all ALMA fluxes presented in this paper.
2.2 Fermi
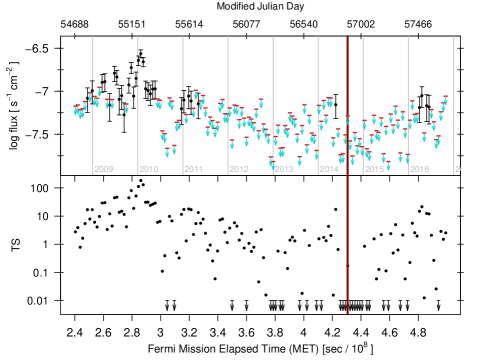
To get the deepest possible upper limits (or lowest detected flux level) for the gamma-ray output of the combined PKS 0637752 core and jet, we utilize the ‘progressive-binning’ approach first described in Meyer & Georganopoulos (2014), which can be consulted for further details as well as M15. The method involves first making a lightcurve for PKS 0637752, which is a moderately bright Fermi/LAT source with a of 22 (where TS is the Test Statistic value, roughly significance squared) in the 3FGL Fermi four-year point-source catalog (Acero et al., 2015). The bins were selected to have good time intervals (GTIs) totaling 1 week on source, corresponding to approximately 2.8 weeks in real time, for a total of 155 bins. Before making the light curve, we analyzed a 10 degree region around PKS 0637752 for potential new sources not accounted for in the latest 3FGL catalog, using data taken between 239557417 and 500455771 MET, corresponding to calendar dates 2008 August 4 to 2016 November 10. We iteratively fit for the sky position and spectral parameters for any new source (as shown by a TS residual over 10) using a maximum-likelihood approach as described in M15. We added 13 new sources to the base model populated with 3FGL catalog sources supplied by the make3FGLxml tool, with the nearest being a TS=19 source at 3.45 degrees from PKS 0637752.
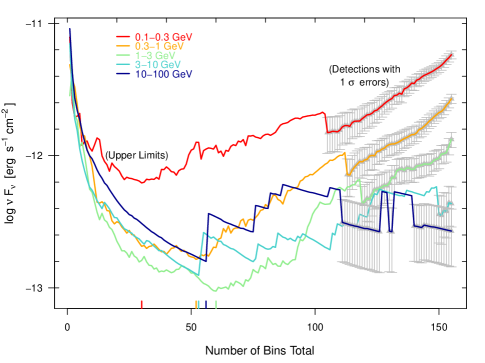
With our updated source model, we then made the light curve shown in Figure 2. Since the cut-off time corresponding to the M15 study (vertical red line), almost 26 months have passed in which the PKS 0637752 core has remained relatively quiescent. We ordered the 155 light curve bins according to TS and then progressively combined them in our analysis, combining first the lowest two, then lowest three, and so on. At each step in the combined binning, where one additional bin is included in to the analysis, we compute the maximum-likelihood flux for PKS 0637752 using a power-law model with a fixed spectral index of 2.7111Results are not significantly altered by using a free spectral index, and we found no sign of a significant spectral change from an index of approximately 2.7 over the entire course of the progressive binning analysis when the spectral index was free.. At each step we also compute the flux or 95% upper limit in five individual energy bands corresponding to 0.1-0.3 GeV, 0.3-1 GeV, 1-3 GeV, 3-10 GeV, and 10-100 GeV, matching those used in the published Fermi catalogs.
In Figure 3, we show the results of the progressive binning analysis as 95% upper limits versus time, up until a flux with TS=10 is detected, at which point we show detections with error bars. The lowest limits in each of the five energy bands were reached after 31, 52, 60, 53, and 56 total bins were combined, respectively. The corresponding 95% upper limit fluxes, plotted in red in Figure 4, are listed in Table 1.
3 Results and Discussion
3.1 Ruling out IC/CMB with the New Data
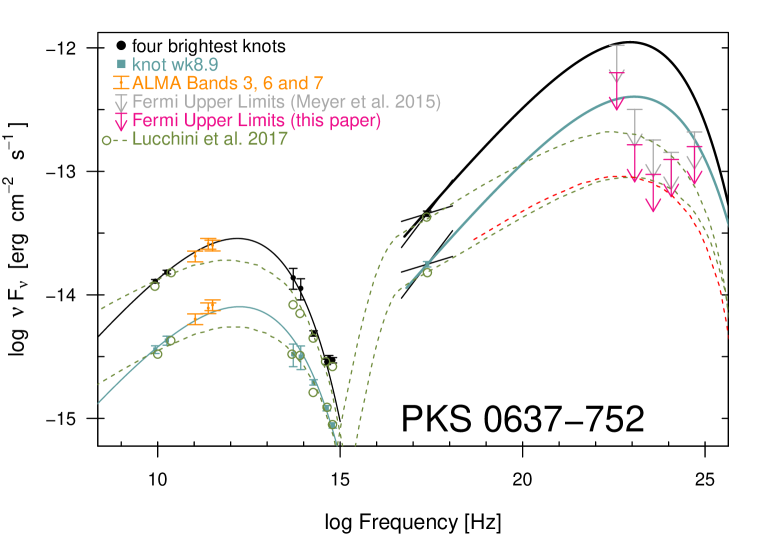
We present in Figure 4 the updated SED for the four brightest knots (black lines) and for the single X-ray brightest knot wk8.9 (cyan lines). The new ALMA data have been overplotted in dark yellow; note that they fall nearly exactly on the synchrotron model curves which are unchanged from M15. The radio and IR/optical data shown as solid points are also unchanged from the previous paper.
With the addition of the ALMA data points, we can now say that the synchrotron SEDs are quite well-constrained, as the data gap between ALMA and IR frequencies is comparable to the spectral width of synchrotron emission from a monoenergetic electron population and the actual flux there cannot deviate significantly from our empirical SED. The empirical (by eye) fit is simply a power-law with a scaled exponential cutoff,
| (1) |
For the four knots, the parameter values are erg s-1 cm-2, , Hz, and . For the single knot the values are erg s-1 cm-2, , Hz, and . The radio index of the empirical model between 8.6 and 17.8 GHz is 0.245, consistent with that based on the two ATCA radio points alone, which yields =0.240.05. Based on the empirical fits to the synchrotron spectra shown, we have produced corresponding (empirical) IC/CMB model curves, shown as thicker black and cyan lines from X-ray to TeV energies using the shift formulae given in G06.
Recalling that the requirement that the IC/CMB curves match the observed X-ray flux completely fixes the GeV-band prediction, we can now examine the upper limits from Fermi. The previous M15 limits are shown in gray, while the new, deeper limits from the most recent analysis are shown in magenta. Clearly, the IC/CMB model is ruled out at a very high level of significance. Taking the predicted model curves shown in Figure 4 for the IC/CMB spectrum, we can calculate the significance of our non-detection in each energy band using the profile likelihood method. With equal to the logarithm of the likelihood,the statistic is distributed as a with one degree of freedom when all other parameters are fixed. The value of the normalization of the source is increased until the flux equals the predicted value, and we record the resulting value, which is converted into a percent probability and sigma value for a one-sided limit using standard tables. For the four brightest knots in the jet combined, the deepest single-band limit is in band 3, where our upper limit implies that IC/CMB is ruled out at the 5.6 level. Overall, IC/CMB is ruled out at a 8.7 limit when we combine the individual band results using the inverse normal method. For the single brightest knot, the deepest single limit is also in band 3, equivalent to a 99.97% or 3.5 upper limit. The combined results of all bands using the inverse normal method implies an overall 5.3 upper limit for the single X-ray brightest knot.
Because of jet one-sidedness, we know that the large-scale jet must be at least mildly relativistic, and thus some level of IC/CMB emission will be produced, even if it is not responsible for the anomalous X-rays. We can use the updated Fermi limits to put an upper limit on the value of assuming the magnetic field is in equipartition, with G (where we have assumed a knot radius of 3.5 kpc, a spectral index of and = 100). For the 95% limits shown in Figure 4, the limit for the four brightest knots is .
| Band | log Freq. | 95% Limit | Bins | Combined Knots**Combined Knots are wk7.8, wk8.9, wk9.7, and wk10.6. | Knot wk8.9 | ||||
|---|---|---|---|---|---|---|---|---|---|
| (GeV) | (GeV) | (Hz) | (erg s-1 cm-2) | Added | predicted | % Ruled | predicted | % Ruled | |
| (erg s-1 cm-2) | Out | (erg s-1 cm-2) | Out | ||||||
| (1) | (2) | (3) | (4) | (5) | (6) | (7) | (8) | (9) | (10) |
| 1 | 0.1 | 0.3 | 22.6 | 6.29 | 31 | 1.1 | 98.99 | 3.8 | 88.9 |
| 2 | 0.3 | 1 | 23.1 | 1.64 | 52 | 1.1 | 99.99999 | 4.0 | 99.7 |
| 3 | 1 | 3 | 23.6 | 9.45 | 60 | 1.0 | 99.99999 | 3.8 | 99.97 |
| 4 | 3 | 10 | 24.1 | 1.25 | 53 | 7.7 | 99.998 | 3.1 | 99.5 |
| 5 | 10 | 100 | 24.7 | 1.58 | 56 | 3.9 | 98.8 | 1.8 | 96.1 |
3.2 The Importance of a Complete Synchrotron SED
In the IC/CMB scenario, because the X-ray to GeV SED is a copy of the synchrotron, it is critical to ensure accuracy and completeness in the synchrotron spectrum to the extent possible. As an example of this, in Figure 4 we show as green open circles and dashed lines the data and model fits recently presented in Lucchini et al. (2016, hereafter L17) where it is argued that the IC/CMB model is not ruled out for PKS 0637752, based on the M15 limits shown in gray.222We note that the L17 data set does not take into account the updated infrared fluxes presented previously in M15, resulting in a discrepancy at those wavelengths for the combined knots.. However, the radio – sub-mm model spectra of L17 are significantly steeper (or more flat in ) than the actual data require, substantially underproducing the ALMA fluxes. This is critical, as this part of the synchrotron spectrum determines the SED slope below the peak and therefore, the rise of the high energy energy component from the X-ray to GeV energies. In other words, adopting a steeper-than-observed radio spectrum reduces the anticipated GeV emission for a given level of X-rays and can lead to incorrect conclusions for the viability of the IC/CMB model. The radio spectral index at the low radio frequencies (1 GHz) corresponding to the same electrons that produce the X-rays is =0.65 in our empirical model, compared to a value of approximately 0.87 used in L17. The latter value is close to the X-ray spectral index value of =0.850.1 reported in Chartas et al. (2000), as required under the standard IC/CMB model. It should be noted that, in the context of the IC/CMB model, the inferred radio index is already in some tension with the X-ray spectral index, as seen in Figure 4.
3.3 Physical Versus Empirical Models for Testing IC/CMB
We now address the question of whether models that include some physical considerations such as electron energy losses can alter our conclusions. This was suggested by L17, in particular that radiative losses steepen the high-energy end of the electron energy distribution, resulting to suppressed GeV emission. The problem with this argument is that there is a single electron energy distribution that is required to produce both the synchrotron and the IC/CMB components, and the steepness of the high-energy tail of the EED is uniquely determined by the IR-optical observed spectrum, so that the synchrotron SED determines the IC/CMB SED. Thus, regardless of the way one fits the synchrotron spectrum, the IC/CMB SED will be a copy of the synchrotron one with the degree of shifting set by the requirement that the IC/CMB reproduces the X-rays (G06). To demonstrate this, we have shifted the L17 numerical synchrotron SED of knot wk8.9 according to the expressions of G06 so that it reproduces the X-ray emission of the knot. The result is plotted in Figure 4 as a dashed red line. As expected, this line is extremely close to the numerical IC/CMB result of L17.
4 Summary & Conclusions
We have presented new ALMA observations of the anomalously X-ray-bright quasar jet PKS 0637752 at 100 and 233 GHz. These observations confirm that the bright knots of this source have a synchrotron peak at approximately Hz and are consistent with the empirical model presented in M15. We have presented new Fermi upper limits on PKS 0637752 for the large-scale jet using the progressive binning method. These limits improve on those previously reported in M15 through both more time on source, and the use of ‘pass 8’ calibration for the Fermi data. The updated limits represent a combined 8.7-level ruling out of the standard IC/CMB model, which we find does not produce the required gamma-ray emission. A recent claim for the opposite (L17) stems from using a dataset that did not include critical ALMA observations and from using an incorrect radio spectral index (see §3.2). We also note that for the purpose of evaluating the standard IC/CMB model, an empirical description of the synchrotron SED is equivalent to physical models (see §3.3).
References
- Acero et al. (2015) Acero, F., Ackermann, M., Ajello, M., et al. 2015, ApJS, 218, 23
- Cara et al. (2013) Cara, M., Perlman, E. S., Uchiyama, Y., et al. 2013, ApJ, 773, 186
- Celotti et al. (2001) Celotti, A., Ghisellini, G., & Chiaberge, M. 2001, MNRAS, 321, L1
- Chartas et al. (2000) Chartas, G., Worrall, D. M., Birkinshaw, M., et al. 2000, ApJ, 542, 655
- Dermer & Atoyan (2004) Dermer, C. D., & Atoyan, A. 2004, ApJ, 611, L9
- Georganopoulos et al. (2006) Georganopoulos, M., Perlman, E. S., Kazanas, D., & McEnery, J. 2006, ApJ, 653, L5
- Godfrey et al. (2012) Godfrey, L. E. H., Lovell, J. E. J., Burke-Spolaor, S., et al. 2012, ApJ, 758, L27
- Hardcastle (2006) Hardcastle, M. J. 2006, MNRAS, 366, 1465
- Hardcastle et al. (2016) Hardcastle, M. J., Lenc, E., Birkinshaw, M., et al. 2016, MNRAS, 455, 3526
- Harris & Krawczynski (2006) Harris, D. E., & Krawczynski, H. 2006, ARA&A, 44, 463
- Jorstad & Marscher (2004) Jorstad, S. G., & Marscher, A. P. 2004, ApJ, 614, 615
- Jorstad & Marscher (2006) —. 2006, Astronomische Nachrichten, 327, 227
- Kharb et al. (2012) Kharb, P., Lister, M. L., Marshall, H. L., & Hogan, B. S. 2012, ApJ, 748, 81
- Lucchini et al. (2016) Lucchini, M., Tavecchio, F., & Ghisellini, G. 2016, ArXiv e-prints, arXiv:1610.01580
- Marshall et al. (2011) Marshall, H. L., Gelbord, J. M., Schwartz, D. A., et al. 2011, ApJS, 193, 15
- Meyer & Georganopoulos (2014) Meyer, E. T., & Georganopoulos, M. 2014, ApJ, 780, L27
- Meyer et al. (2015) Meyer, E. T., Georganopoulos, M., Sparks, W. B., et al. 2015, ApJ, 805, 154
- Miller et al. (2006) Miller, B. P., Brandt, W. N., Gallagher, S. C., et al. 2006, ApJ, 652, 163
- Oteo et al. (2016a) Oteo, I., Zwaan, M. A., Ivison, R. J., Smail, I., & Biggs, A. D. 2016a, ApJ, 822, 36
- Oteo et al. (2016b) —. 2016b, ArXiv e-prints, arXiv:1607.06464
- Perlman et al. (2011) Perlman, E. S., Georganopoulos, M., Marshall, H. L., et al. 2011, ApJ, 739, 65
- Petry & CASA Development Team (2012) Petry, D., & CASA Development Team. 2012, in Astronomical Society of the Pacific Conference Series, Vol. 461, Astronomical Data Analysis Software and Systems XXI, ed. P. Ballester, D. Egret, & N. P. F. Lorente, 849
- Sambruna et al. (2004) Sambruna, R. M., Gambill, J. K., Maraschi, L., et al. 2004, ApJ, 608, 698
- Schwartz et al. (2000) Schwartz, D. A., Marshall, H. L., Lovell, J. E. J., et al. 2000, ApJ, 540, 69
- Stanley et al. (2015) Stanley, E. C., Kharb, P., Lister, M. L., et al. 2015, ApJ, 807, 48
- Tavecchio et al. (2000) Tavecchio, F., Maraschi, L., Sambruna, R. M., & Urry, C. M. 2000, ApJ, 544, L23
- Uchiyama et al. (2006) Uchiyama, Y., Urry, C. M., Cheung, C. C., et al. 2006, ApJ, 648, 910