Gamma-ray Emission of the Kes 73/1E 1841-045 Region Observed with the Fermi Large Area Telescope
Abstract
The supernova remnant Kes 73 and/or the magnetar 1E 1841-045 at its center can deposit a large amount of energy to the surroundings and is potentially responsible for particle acceleration. Using the data taken with the Fermi Large Area Telescope (LAT), we confirmed the presence of an extended source whose centroid position is highly consistent with this magnetar/supernova-remnant pair. Its emission is intense from 100 MeV to 100 GeV. Its LAT spectrum can be decoupled into two components which are respectively governed by two different mechanisms. According to the young age of this system, the magnetar is seemingly a necessary and sufficient source for the downward-curved spectrum below 10 GeV, as the observed 10 GeV flux is too high for the supernova remnant to account for. On the other hand, the supernova remnant is reasonably responsible for the hard spectrum above 10 GeV. Further studies of this region in the TeV regime is required, so that we can perform physically meaningful comparisons of the 10 GeV spectrum and the TeV spectrum.
The Friends of Fermi Asian Network
1 Introduction
Magnetars are neutron stars with typically longer periods of spinning (212 s) and stronger surface magnetic fields ( G) 111McGill magnetar catalog: http://www.physics.mcgill.ca/p̃ulsar/magnetar/main.html (Olausen & Kaspi, 2014), compared to normal neutron stars. Their manifestations include soft gamma-ray repeaters (SGRs) and anomalous X-ray pulsars (AXPs), which are mostly located at low Galactic latitudes (Olausen & Kaspi, 2014). Magnetars emit mainly by releasing magnetic energy rather than rotational energy (Duncan & Thompson, 1992). Due to unusually high surface magnetic fields, frequent starquakes occur on magnetars (Duncan, 1998), leading to recurrent X-ray outbursts of magnetars (cf. Collazzi et al., 2015, and references therein 222GCN Circulars: http://gcn.gsfc.nasa.gov/gcn3_archive.html). Whenever a magnetar outburst takes place, a substantial amount of energy spills, following the ejecta, to the surroundings and can affect the emission in that region at energies above 1 keV. Whether the gigaelectronvolt (GeV)-emissions from regions of magnetars react correspondingly to magnetar outbursts or not deserves to be a focus of our attention.
Pulsed GeV radiation from the magnetospheres of magnetars have been predicted by theoretical models (e.g., Cheng & Zhang, 2001; Beloborodov & Thompson, 2007; Takata et al., 2013). Nonetheless, it is arguable that the GeV pulsations of magnetars are likely to be buried due to their low flux levels (cf. Li et al., 2017). The difficulties in pulsation search of magnetars in -ray are further increased by the complicated -ray backgrounds in magnetars’ neighbourhoods, because the Galactic diffuse emission is strong and the distributions of celestial objects are crowded at Galactic latitudes within 1∘. Celestial objects in magnetars’ neighbourhoods include, but are not limited to, magnetars’ derivative products. While analyses of Fermi Large Area Telescope (LAT) data did not give convincing evidence for -rays from any magnetar (cf. Abdo et al., 2010d; Auchettl et al., 2014; Yeung et al., 2016; Li et al., 2017), it is interesting to observe -rays from some derivative products of magnetars, as some of them are also magnetically powered and enable us to study physics of ultra-high magnetic field.
Supernova remnants (SNRs) are common derivative products of magnetars as well as other categories of neutron stars, and form through stellar collapse and subsequent supernova explosion. Thanks to LAT observations, plenty of GeV-bright SNRmolecular cloud (MC) association systems have been significantly detected (e.g., Abdo et al., 2009, 2010a, 2010b, 2010c; Castro et al., 2013; Xing et al., 2014; Liu et al., 2015; Araya, 2015) and discovered to have broken-power-law or log-parabola spectra (Acero et al., 2016), suggesting an escape of over-energetic particles from the acceleration sites. Pulsar wind nebulae (PWNe) are another type of pulsars’ derivative products, which form through pulsars’ wind materials interacting with and shocked by ambient medium. They have been studied from the radio band (synchrotron radiation; e.g., Ma et al., 2016) to the -ray band. At least 27 pulsars have their PWNe identified as teraelectronvolt (TeV) sources (cf. Halpern & Gotthelf, 2010) emitting through inverse-Compton (IC) scattering (reviewed by Gaensler & Slane, 2006). Until now, Swift J1834.9-0846 is the only magnetar confirmed to produce an X-ray PWN (Younes et al., 2016), and CXOU J171405.7-381031 is the only magnetar argued as producing a TeV PWN (Halpern & Gotthelf, 2010).
1E 1841-045 is an AXP discovered to be the central source of SNR Kes 73 (Vasisht & Gotthelf, 1997). The Kes 73/1E 1841-045 system has a distance of kpc from us and an age of 750-2100 yr (Tian & Leahy, 2008; Kumar et al., 2014). This system is potentially responsible for particle acceleration, as it shows intense TeV emission at the northern edge of HESS J1841-055 (Aharonian et al., 2008; Bochow, 2011). This arouses our motivation to search for the GeV counterpart of the magnetar/SNR pair. 1E 1841-045 has a spin-down power of erg s-1 and a surface magnetic field of G (Dib & Kaspi, 2014). 1E 1841-045 experienced a series of 10 X-ray outbursts in 2011 FebruaryJuly (Lin et al., 2011), and it is interesting to see how the GeV flux varies shortly after these outbursts. Tight interaction of Kes 73 with MCs is supported by detection of OH (1720 MHz) maser emission (Green et al., 1997), discovery of the methanol source IRAS 18379-0500 which is associated with an H II region (Helfand et al., 1992; Slysh et al., 1999), and revelation of broad-molecular-line (BML) regions by H I and CO observations (Tian & Leahy, 2008; Kilpatrick et al., 2016). Nevertheless, the total solid angle subtended at Kes 73 by its adjacent compact H II regions is only 5% of an entire sphere (cf. Figure 1(a) of Tian & Leahy, 2008) and, to some degree, limits the -ray contribution from Kes 73.
In this paper, we explore the hundred-megaelectronvolt-to-GeV emission in the field of the Kes 73/1E 1841-045 system by using 7.5 years of Fermi LAT data with the latest instrumental responses and background models. Then, we provide some insight into the possible origin(s) of the -rays, in terms of the spectral shapes, energy budgets and long-term temporal behaviors. Results of a nearby region consisting of 3XMM J185246.6+003317 will be published in a follow-up paper.
2 Observation & Data Reduction
We performed a series of binned maximum-likelihood analyses for a 20∘20∘ region-of-interest (ROI) centered at RA=, Dec= (J2000), which is approximately the midpoint between 1E 1841-045 and 3XMM J185246.6+003317. We used the data obtained by LAT between 2008 August 4 and 2016 February 1. The data were reduced and analyzed with the aid of Fermi Science Tools v10r0p5 package. In view of the complicated environment of the Galactic plane regions, we adopted the events classified as Pass8 “Clean” class for the analysis so as to better suppress the background. The corresponding instrument response function (IRF) “P8R2-CLEAN-V6” is used throughout the investigation. We further filtered the data by accepting only the good time intervals where the ROI was observed at a zenith angle less than 90∘ so as to reduce the contamination from the albedo of Earth.
For subtracting the background contribution, we included the Galactic diffuse background (gll-iem-v06.fits), the isotropic background (iso-P8R2-CLEAN-V6-PSF3-v06.txt for “PSF3” data, iso-P8R2-CLEAN-V6-FRONT-v06.txt for “FRONT” data or iso-P8R2-CLEAN-V6-v06.txt for a full set of data) as well as all other point sources cataloged in the most updated Fermi/LAT catalog (3FGL; Acero et al., 2015) within 25∘ from the ROI center in the source model. In §3.1, we report discoveries of a few sources within 5∘ from the ROI center, which were also included in the source model. We set free the spectral parameters of the sources within 8∘ from the ROI center in the analysis. For the sources beyond 8∘ from the ROI center, their spectral parameters were fixed at the catalog values.
In spectral and temporal analysis, we required each energy-bin and time-segment to attain a signal-to-noise ratio (equivalently, a TS value 9 and a chance probability 0.3%) for a robust result. For each energy-bin or time-segment dissatisfying this requirement, we placed a 3.0 upper limit on its flux.
3 Data Analysis
3.1 Spatial Analysis
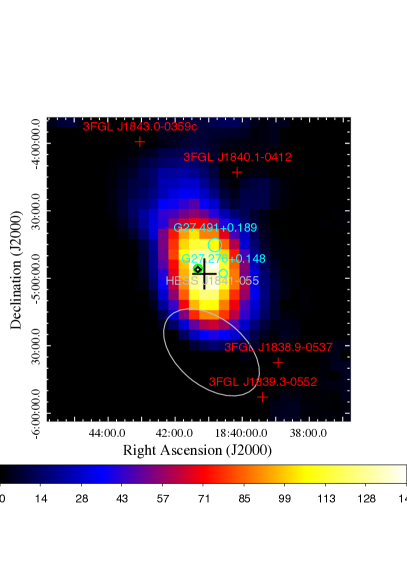
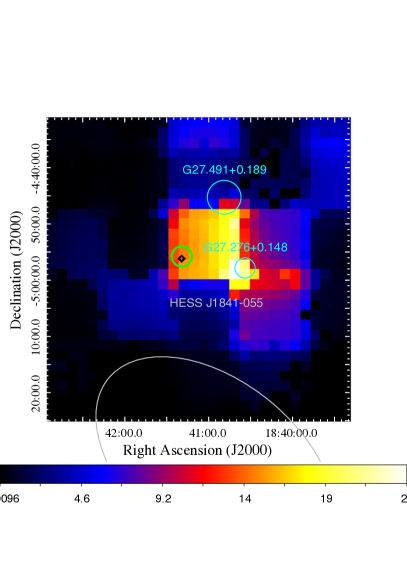
We investigate the morphology of the Kes 73/1E 1841-045 region in high-energy (HE; 1 GeV) and very-high-energy (VHE; 10 GeV) regimes respectively. We notice that the PSF at 10 GeV for a full set of data is smaller than that at 1 GeV for “PSF3” data (cf. SLAC 333Fermi LAT Performance: http://www.slac.stanford.edu/exp/glast/groups/canda/lat_Performance.htm). Therefore, in order to achieve a compromise between good spatial resolution and adequate photon statistics, we independently analyze two sets of data for morphological studies: (1) “PSF3” data in 150 GeV, (2) and a full set of data in 10200 GeV.
The test-statistic (TS) maps of the field around 1E 1841-045 are shown in Figure 1, where all 3FGL catalog sources including HESS J1841-055 are subtracted. The peak detection significance is in 150 GeV and in 10200 GeV. On the TS map in 150 GeV, we determined the contour where the TS value is lower than the maximum by 9.488. Since this contour is very ellipse-like, we fit an ellipse to it. The center of this ellipse is determined to be the best-fit centroid, while its dimension is determined to be the 95% error region for 4 d.o.f. 444Ones can refer to the Chi-Square Distribution Table, which shows that for 4 d.o.f.. There are 4 d.o.f., because of 4 variables: right ascension, declination, flux normalization and photon index.. We found that the 95% error region of the 150 GeV centroid covers the entire Kes 73/1E 1841-045 system, but is mutually exclusive with its two adjacent compact H II regions, G27.276+0.148 and G27.491+0.189. The best-fit 10200 GeV centroid is offset from the magnetar/SNR pair by , but its 95% error region contains the pair. The spatial coincidence of the 150 GeV feature LAT observed and HESS J1841-055 is very marginal, but the 150 GeV centroid determined from LAT data still has a detection significance of in HESS (cf. Aharonian et al., 2008; Bochow, 2011).
For examining whether the morphology of the emission from this region is extended, we followed a scheme adopted by Yeung et al. (2016). We performed a likelihood ratio test to quantify the significance of extension. We adopted the position of the 150 GeV centroid, (18:41:07.723, 04:58:07.44 (J2000)), for the 1E 1841-045 region (namely Fermi J1841.1-0458). We assigned it a simple power law, and we attempted uniform-disk morphologies of different radii as well as a point-source model on it. We took the “FRONT” data in 1400 GeV, which thoroughly covers both HE and VHE bands. The of different radii relative to the point-source model are tabulated in Table 1. The most likely radius is determined to be 555The uncertainties are determined at where the is lower than the maximum by 1 according to the Chi-Square Distribution. and this morphology is preferred over a point-source model by . We therefore adopted this morphology for Fermi J1841.1-0458 in subsequent analyses.
In the 3XMM J185246.6+003317 region, we identified another extended source (namely Fermi J1852.2+0037), which was modelled together with Fermi J1841.1-0458 and will be reported in our follow-up paper. Within 5∘ from the ROI center, we discovered two more sources at (281.79408∘, 2.3781283∘)J2000 (TS300) and (281.41503∘, 3.0315034∘)J2000 (TS50). In the same chain of analyses, we also modelled them as additional point sources, merely for the sake of better subtracting the -ray backgrounds.
3.2 Spectral Analysis
To construct the binned spectrum of Fermi J1841.1-0458, we performed an independent fitting of each spectral bin. For each spectral bin, we assigned a PL model to Fermi J1841.1-0458. Considering that we include photons with energies below 1 GeV, and that we are investigating crowded regions in the Galactic plane, we find it inappropriate to adopt a full set of data whose large PSF (e.g., a 68% containment radius of 3.0∘ at 0.2 GeV; cf. SLAC ) leads to severe source confusion. Meanwhile, adopting only “PSF3” data is also discouraged in spectral fittings because of large systematic uncertainties induced by severe energy dispersion. For “FRONT” data in 0.21 GeV, the FWHM of its PSF is 75% of that for a full set of data and its energy dispersion is greater than that for a full set of data by only 1% of the photon energy (cf. SLAC ). Therefore, we adopted only “FRONT” data in order to achieve a compromise between a small PSF and lessened energy dispersion.
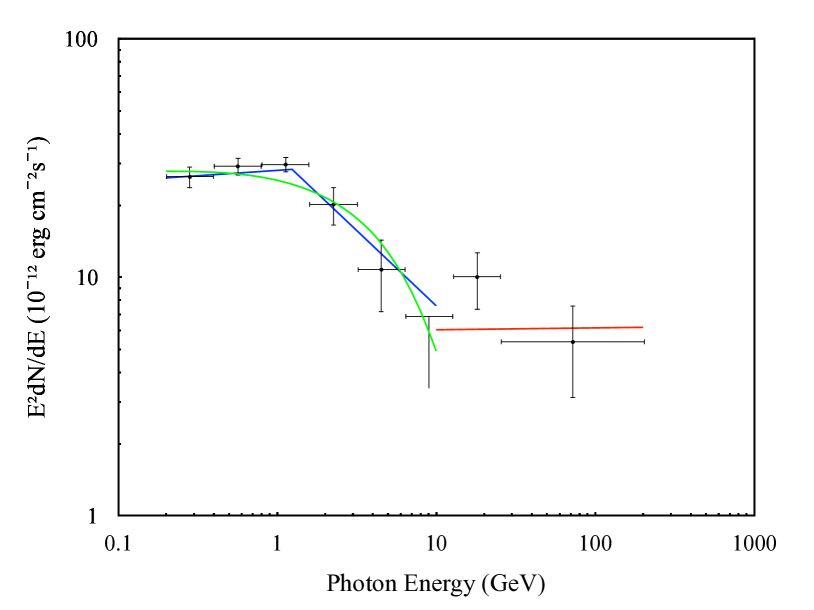
The spectral energy distribution (SED) is shown in Figure 2. Noticeably, there appears to be a spectral disconnection at energies around 10 GeV, where the flux is lower. This suggests that the entire LAT spectrum may consist of two components, which are decoupled at energies around 10 GeV. With regards to this, we looked into the spectral shapes of two mutually exclusive energy bands respectively: 0.210 GeV and 10200 GeV. We examined how well the spectrum in each band can be described by, respectively, a simple power-law (PL)
,
an exponential cutoff power law (PLE)
,
and a broken power law (BKPL)
.
The results of spectral fitting are tabulated in Table 2.
For the 0.210 GeV spectrum of Fermi J1841.1-0458, the likelihood ratio test indicates that both PLE and BKPL are preferred over PL by . A PLE model yields a photon index of and a cutoff energy of MeV. A BKPL model yields a photon index below the spectral break MeV and a photon index above the break. Since the TS values yielded by PLE and BKPL models differ by 6, these two models are similarly preferable.
In the 10200 GeV spectrum of Fermi J1841.1-0458, a PL model yields a photon index , which is consistent with a flat energy-spectrum within the tolerance of the uncertainty. The relatively low statistics do not allow distinguishing among the goodness of fit of PL, PLE and BKPL models. In order to demonstrate whether this spectrum could be well connected to the 110 GeV spectrum by one single PL, we also performed a likelihood ratio test for the 1200 GeV band. It turns out that a BKPL model with fixed at 10 GeV ( and ) is preferred over the best-fit PL () by (i.e., the probability that the 1200 GeV spectrum can be joined by a PL is 0.5%).
3.3 Temporal Analysis
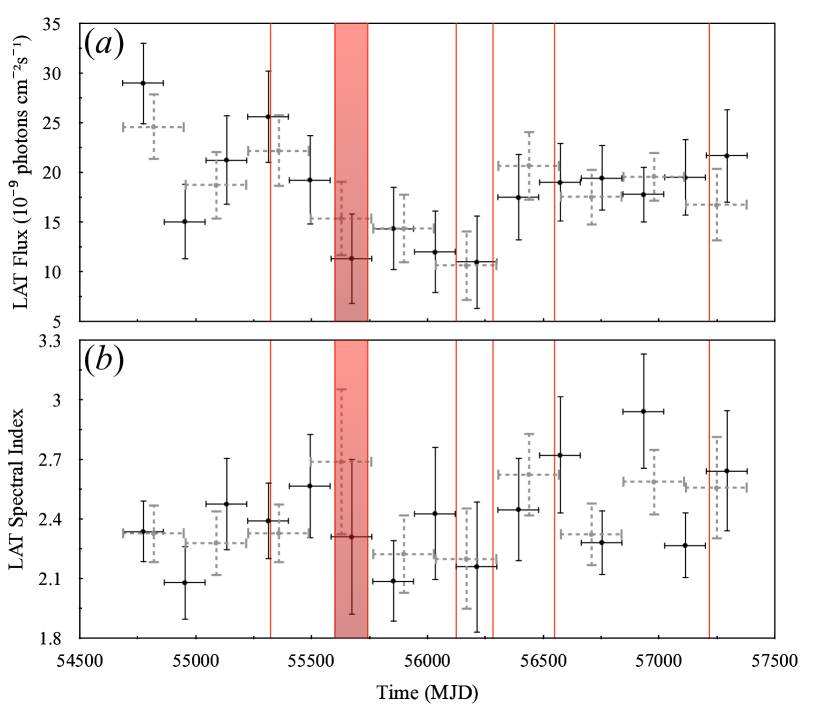
In order to examine the long-term variability of Fermi J1841.1-0458, we divided the first 7.4 years of Fermi LAT observation into a number of 180-day segments. A binned maximum-likelihood analysis of “FRONT” data 666Again, the reason for adopting only “FRONT” data is to achieve a compromise between a small PSF and lessened energy dispersion. in 0.7400 GeV was performed for each individual segment. The choice of a minimum energy cut of 0.7 GeV in this analysis is motivated by the FWHM of the PSF at 0.7 GeV which is 40% of that at 0.2 GeV (cf. SLAC ). In other words, the source confusion of photons in this analysis is conspicuously less serious. We assumed a PL model for Fermi J1841.1-0458. We then repeated this procedure with 270 days as a segment. The temporal behaviors of the photon flux and photon index of Fermi J1841.1-0458 are plotted with the X-ray outburst history of 1E 1841-045, taken from Lin et al. (2011), Collazzi et al. (2015) and references therein , altogether in Figure 3.
If we adopt 180 days as a bin, constant-value functions are sufficient to describe the temporal distributions of flux and spectral index, with for 14 d.o.f., and no bins deviate from the best-fit flat line by . If we change the bin size to be 270 days, the temporal distributions of flux and spectral index are also uniform, with for 9 d.o.f., and there are no bins different from the best-fit horizontal line by . More importantly, the errors considered in above fittings are purely statistical. If we take the systematic uncertainties of Galactic diffuse emission model and the effective area (cf. Abdo et al., 2013) into consideration, then the significance of variability will further be lowered. Thus, no -ray variability of Fermi J1841.1-0458 is significantly detected.
4 Discussion
Our analysis of Fermi J1841.1-0458 confirms what Acero et al. (2016) and Li et al. (2017) discovered with Fermi LAT data: the presence of a GeV-bright extended source which is positionally consistent with the Kes 73/1E 1841-045 system. Li et al. (2017) placed a 95% upper limit of erg cm-2 s-1 on the 0.110 GeV flux of the magnetar 1E 1841-045, after their attempt to subtract the -ray contribution from SNR Kes 73 which is enclosing the magnetar at its center. This upper limit is approximately one-fifth of our observed flux for Fermi J1841.1-0458. Nevertheless, we take a different approach to discuss possible -ray origins.
Fermi J1841.1-0458 radiates strongly in both low-energy (LE; 0.11 GeV), HE (110 GeV) and VHE (10 GeV) regimes. Comprehensively considering Figure 2 and Table 2, we found that the 0.110 GeV and 10200 GeV emissions may be respectively dominated by two components of different mechanisms. We will therefore discuss the emission mechanisms of the source using these two energy bands.
We compared the LAT spectral shape of Fermi J1841.1-0458 with those of other SNRs younger than or as young as Kes 73, which are tabulated in Table 3. The interpretations based on this comparison will be discussed in the following sub-sections.
4.1 Relations with SNR Kes 73
The best-fit 150 GeV centroid of Fermi J1841.1-0458 is almost at the center of Kes 73, while the 95% error region of this centroid is mutually exclusive with the two H II clouds G27.276+0.148 and G27.491+0.189. This contradicts the MC-interaction scenario where the actual -ray source is the proton collision sites (MCs) rather than the proton acceleration sites (SNR shocks). Whereas, this is within our expectation, as only 5% of cosmic rays accelerated in Kes 73 can reach these two H II clouds, according to the angular sizes of the clouds and their angular separations from Kes 73 (taken from Figure 1(a) of Tian & Leahy, 2008). Also, Kes 73 is a shell-type SNR which shows no signs of being thermal composite, further confirming that the dense medium interacting with Kes 73 is not that abundant. Furthermore, a SNR is generally GeV-brightest at an age within 310 kyr (cf. Dermer & Powale, 2013), while Kes 73 is only 2.1 kyr old (Kumar et al., 2014). Therefore, the -ray contribution from Kes 73 should be limited.
The Fermi LAT detection of the GeV counterparts of Cas A and Tycho (Abdo et al., 2010e; Zirakashvili et al., 2014; Giordano et al., 2012; Archambault et al., 2017), respectively 340 yr old and 440 yr old SNRs in lack of dense medium in their neighborhoods (Fesen et al., 2006; Tian & Leahy, 2011; Kilpatrick et al., 2014, 2016), makes it rather possible for Kes 73 to be a significant -ray source like Cas A and Tycho. However, if Kes 73 (at a distance of 8.5 kpc; Tian & Leahy, 2008; Kumar et al., 2014) is the only source of energy injection for Fermi J1841.1-0458, then its 0.11 GeV luminosity would be a factor of 20 greater than those of Cas A and Tycho (at distances of 3.3 kpc and 5 kpc respectively; Alarie et al., 2014; Hayato et al., 2010; Tian & Leahy, 2011). Besides, the 110 GeV spectrum of Fermi J1841.1-0458 is steeper than those of all other young-SNR associated sources in Table 3 by . Furthermore, 3000 yr old SNRs should have -ray luminosities erg s-1 (cf. Dermer & Powale, 2013), while the 0.110 GeV luminosity of Fermi J1841.1-0458 is erg s-1, based on the BKPL model fit to the 0.210 GeV spectrum. If we adopt the simple model where the target material for cosmic-ray interaction at early SNR ages is only the shocked interstellar medium but not the SNR shell (cf. Dermer & Powale, 2013), then it is unusual for Kes 73 to dominate the LEHE (0.110 GeV) emission of Fermi J1841.1-0458.
In 10200 GeV, the luminosity of Fermi J1841.1-0458 is erg s-1, with a hard photon index of . Interestingly, the 1300 GeV spectrum of the SNR RX J0852.0-4622 (24005100 yr old; Allen et al., 2015) is well described by a PL model with a similar photon index of (Tanaka et al., 2011), and the 0.5300 GeV spectrum of the SNR RX J1713.7-3946 (1600 yr old; cf. Fesen et al., 2012; Katsuda et al., 2015) is well described by a PL model with an even slightly harder photon index of (Federici et al., 2015). For these two SNRs, any simple one-zone model for particle acceleration does not favor a strong hadronic pion-decay component (Federici et al., 2015), as more-energetic particles are more inclined to lose their energy or to escape from the acceleration sites. Such hard GeV spectra of SNRs can possibly be explained by leptonic cosmic-rays up-scattering soft photons (cf. Tanaka et al., 2011; Dermer & Powale, 2013), and/or more complicated hadronic emission (beyond one-zone models) from a shell of dense gas that is transferred from progenitor stellar winds and is located a short distance upstream of the forward shock (cf. Federici et al., 2015).
Since Kes 73 is as young as RX J1713.7-3946 and is just slightly younger than RX J0852.0-4622, it is likely that Kes 73 dominates the VHE emission of Fermi J1841.1-0458, whose VHE spectrum is as hard as those of RX J0852.0-4622 and RX J1713.7-3946. Both the GeVTeV spectra of RX J0852.0-4622 and RX J1713.7-3946 are well described by BKPL models with spectral turnovers and peaks at 300 GeV (Tanaka et al., 2011; Federici et al., 2015). HESS observation in the TeV band shows that Kes 73 has a detection significance of at the northern edge of HESS J1841-055 (cf. Aharonian et al., 2008; Bochow, 2011). Unfortunately, it is inappropriate to examine the spectral connection for Fermi J1841.1-0458 and HESS J1841-055, since HESS J1841-055 has an extended feature composed of Kes 73 as well as several stronger high-energy sources (Aharonian et al., 2008; Bochow, 2011). It is unclear whether the VHE spectrum of Fermi J1841.1-0458 can be connected to the TeV spectrum of Kes 73 (after subtracting other components of HESS J1841-055) with a turnover and peak at 300 GeV, like what is observed in the spectra of RX J0852.0-4622 and RX J1713.7-3946. It is still dubious whether the scenarios explaining the GeV spectra of RX J0852.0-4622 and RX J1713.7-3946 can be applied to Kes 73 or not.
4.2 Relations with the magnetar 1E 1841-045
1E 1841-045 is highly consistent with the 150 GeV centroid of Fermi J1841.1-0458. One of the most preferable spectral models in 0.210 GeV, PLE, yields a spectral index within the range of typical values of about 1-2 in the 2nd catalog of pulsars detected by the Fermi LAT, and a cutoff energy consistent with the range of typical values of about 1-4 GeV (Abdo et al., 2013). While the spin-down power of 1E 1841-045 of erg s-1 (Dib & Kaspi, 2014) is only 0.11% of the 0.110 GeV luminosity of Fermi J1841.1-0458, its surface magnetic field of G at the pole (cf. Dib & Kaspi, 2014) makes it appropriate to estimate the power of magnetic field decay to be erg s-1 (cf. Zhang, 2003), which is marginally greater than the 0.110 GeV luminosity of Fermi J1841.1-0458. Therefore, one possible scenario is that the LEHE emission of Fermi J1841.1-0458 is dominated by energy released from the very-intense magnetic field of 1E 1841-045.
The 0.7 GeV emission of Fermi J1841.1-0458 is essentially steady. Both Figure 3 in this work and Figure 5 in Yeung et al. (2016) (a long-term light-curve of the SGR 1806-20 region) suggest that, regardless of cosmic-ray origins, -ray emissions from magnetars’ regions may not vary in response to magnetar outbursts, although the enormous energy ejected from these outbursts triggers abrupt yet dramatic enhancements in X-ray and soft -ray emissions.
The 10200 GeV luminosity of Fermi J1841.1-0458 is 2 orders of magnitude higher than the spin-down power of 1E 1841-045, but is about an order of magnitude lower than its power of magnetic field decay. Although synchrotron cooling generally makes leptonic cosmic-rays difficult to produce -ray photons of a few GeV or above via synchrotron radiation, PWNe can, with the reduced synchrotron losses for high-energy IC-emitting electrons, maintain their high GeVTeV -ray fluxes for timescales exceeding the lifetime of their progenitor pulsars (Tibolla et al., 2011). Remarkably, in 10200 GeV, the luminosity and spectral shape of Fermi J1841.1-0458 are both highly consistent with those of Crab Nebula’s IC component (see Table 3, and compare Figure 2 in this work with Figure 2 of Buehler et al., 2012). Crab Nebula is a PWN powered by a 1 kyr old pulsar (as young as the Kes 73/1E 1841-045 system; Rudie et al., 2008), prompting us to speculate that Kes 73 also contains an IC-radiating PWN. On the other hand, a stark contrast between the 0.210 GeV spectra of Fermi J1841.1-0458 and Crab Nebula (cf. Table 3) makes it unreasonable to apply the synchrotron component of Crab Nebula (for detail, see Buehler et al., 2012) to explain the LEHE emission of Fermi J1841.1-0458.
TeV-detected PWNe should be associated with pulsars releasing power of erg s-1 (Halpern & Gotthelf, 2010). Such required power is greater than the rotational power of 1E 1841-045 by three orders of magnitude, but can be afforded by magnetic field decay of 1E 1841-045. Swift J1834.9-0846, the first magnetar confirmed to produce a PWN (Younes et al., 2016), is under a similar circumstance (cf. Kargaltsev et al., 2012), and hence the wind nebula around it has been argued to be magnetically powered (Tong, 2016). Conceivably, magnetar’s relativistic outflows, which are accumulated over all outbursts in its history and confined by SNR shell, can supply even larger fluxes of wind particles than those supplied in quiescence (Granot et al., 2017). Therefore, 1E 1841-045 is sufficient to generate an IC-radiating PWN which may account for a significant portion of the LAT flux in the VHE band and/or the HESS flux in the TeV band. However, a major uncertainty of this scenario is that there is no firmly identified PWN inside the SNR shell of Kes 73.
5 Summary
Subject to assured authenticity of the model prediction for young (3 kyr old) SNRs done by Dermer & Powale (2013), the LEHE (0.110 GeV) emission of Fermi J1841.1-0458 cannot be dominated by SNR Kes 73, and is more likely to be dominated by the magnetar 1E 1841-045. Whereas, unless more and more young SNRs are found to have low 0.110 GeV luminosities (like those of Cas A, Tycho, RX J0852.0-4622 and RX J1713.7-3946), the credibility of their model for SNR evolution may still be challenged. Once it is challenged, we cannot robustly eliminate the possibility of the Kes 73 origin for this band. The VHE (10 GeV) emission of Fermi J1841.1-0458 is evidently dominated by Kes 73, while a PWN generated by 1E 1841-045, if it exists, is a sufficient yet unnecessary source in this energy band.
We suggest modelling the Kes 73/1E 1841-045 system as a single source independent from HESS J1841-055 in the TeV regime, so that we can perform physically meaningful comparisons between GeV and TeV spectra. In turn, we can compare its GeVTeV spectrum to those of RX J0852.0-4622, RX J1713.7-3946 and Crab Nebula. How will the GeV and TeV analyses of this magnetar/SNR pair be affected if we assign a different morphology to HESS J1841-055? What should be the refined position and dimension of HESS J1841-055 so that it excludes the magnetar/SNR pair more precisely while retaining all other high-energy components? To address such crucial issues, ones can start with analyzing TeV data collected by HESS, MAGIC and/or CTA, each of which has a higher sensitivity than the GeV-observing Fermi LAT.
Acknowledgement
This work is supported by the Ministry of Science and Technology of the Republic of China (Taiwan) through grants 103-2628-M-007-003-MY3 and 105-2112-M-007-033-MY2. P.H.T.T. is supported by the One Hundred Talent Program of the Sun Yat-Sen University and the Fundamental Research Funds for the Central Universities in P. R. China. C.Y.H. is supported by the National Research Foundation of Korea through grants 2014R1A1A2058590 and 2016R1A5A1013277. J.T. is supported by NSFC grants of Chinese Government under 11573010 and U1631103. K.S.C. is supported by a GRF grant under 17300814. P.K.H.Y. thanks X. Hou and L. C. C. Lin for some useful discussion.
References
- Abdo et al. (2009) Abdo, A. A., Ackermann, M., Ajello, M., et al. 2009, ApJL, 706, L1
- Abdo et al. (2010a) Abdo, A. A., Ackermann, M., Ajello, M., et al. 2010a, ApJ, 718, 348
- Abdo et al. (2010b) Abdo, A. A., Ackermann, M., Ajello, M., et al. 2010b, Sci, 327, 1103
- Abdo et al. (2010c) Abdo, A. A., Ackermann, M., Ajello, M., et al. 2010c, ApJ, 712, 459
- Abdo et al. (2010d) Abdo, A. A., Ackermann, M., Ajello, M., et al. 2010d, ApJL, 725, L73
- Abdo et al. (2010e) Abdo, A. A., Ackermann, M., Ajello, M., et al. 2010e, ApJL, 710, L92
- Abdo et al. (2013) Abdo, A. A., Ajello, M., Allafort, A., et al. 2013, ApJS, 208, 17
- Acero et al. (2015) Acero, F., Ackermann, M., Ajello, M. et al. 2015, ApJS, 218, 23
- Acero et al. (2016) Acero, F., Ackermann, M., Ajello, M. et al. 2016, ApJS, 224, 8
- Aharonian et al. (2008) Aharonian, F., Akhperjanian, A. G., Barres de Almeida, U., et al. 2008, A&A, 477, 353
- Alarie et al. (2014) Alarie, A., Bilodeau, A., & Drissen, L. 2014, MNRAS, 441, 2996
- Allen et al. (2015) Allen, G. E., Chow, K., DeLaney, T., et al. 2015, ApJ, 798, 82
- Araya (2015) Araya, M. 2015, ApJ, 813, 3
- Archambault et al. (2017) Archambault, S., Archer, A., Benbow, W., et al. 2017, ApJ, 836, 23
- Auchettl et al. (2014) Auchettl, K., Slane, P., & Castro, D. 2014, ApJ, 783, 32
- Beloborodov & Thompson (2007) Beloborodov, A. M., & Thompson, C. 2007, ApJ, 657, 967
- Bochow (2011) Bochow, A. 2011, PhD thesis, Ruperto-Carola Univ. Heidelberg
- Buehler et al. (2012) Buehler, R., Scargle, J. D., Blandford, R. D., et al. 2012, ApJ, 749, 26
- Carter et al. (1997) Carter, L. M., Dickel, J. R., & Bomans, D. J. 1997, PASP, 109, 990
- Castro et al. (2013) Castro, D., Slane, P., Carlton, A., & Figueroa-Feliciano, E. 2013, ApJ, 774, 36
- Cheng & Zhang (2001) Cheng, K. S., & Zhang, L. 2001, ApJ, 562, 918
- Collazzi et al. (2015) Collazzi, A. C., Kouveliotou, C., van der Horst, A. J., et al. 2015, ApJS, 218, 11
- Dermer & Powale (2013) Dermer, C. D., & Powale, G. 2013, A&A, 553, A34
- Dib & Kaspi (2014) Dib, R., & Kaspi, V. M. 2014, ApJ, 784, 37
- Duncan (1998) Duncan, R. C. 1998, ApJ, 498, L45
- Duncan & Thompson (1992) Duncan, R. C., & Thompson, C. 1992, ApJ, 392, L9
- Federici et al. (2015) Federici, S., Pohl, M., Telezhinsky, I., Wilhelm, A., & Dwarkadas, V. V. 2015, A&A, 577, A12
- Fesen et al. (2006) Fesen, R. A., Hammell, M. C., Morse, J., et al. 2006, ApJ, 636, 859
- Fesen et al. (2012) Fesen, R. A., Kremer, R., Patnaude, D., & Milisavljevic, D. 2012, AJ, 143, 27
- Gaensler & Slane (2006) Gaensler, B. M., & Slane, P. O. 2006, ARA&A, 44, 17
- Giordano et al. (2012) Giordano, F., Naumann-Godo, M., Ballet, J., et al. 2012, ApJ, 744, L2
- Granot et al. (2017) Granot, J., Gill, R., Younes, G., et al. 2017, MNRAS, 464, 4895
- Green et al. (1997) Green, A. J., Frail, D. A., Goss, W. M., & Otrupcek, R. 1997, AJ, 114, 2058
- Halpern & Gotthelf (2010) Halpern, J. P., & Gotthelf, E. V. 2010, ApJ, 725, 1384
- Hayato et al. (2010) Hayato, A., Yamaguchi, H., Tamagawa, T., et al. 2010, ApJ, 725, 894
- Helfand et al. (1992) Helfand, D. J., Zoonematkermani, S., Becker, R. H., & White, R. L. 1992, ApJS, 80, 211
- Kargaltsev et al. (2012) Kargaltsev, O., Kouveliotou, C., Pavlov, G. G., et al., 2012, ApJ, 748, 26
- Katsuda et al. (2015) Katsuda, S., Acero, F., Tominaga, N. et al. 2015, ApJ, 814, 29
- Kilpatrick et al. (2014) Kilpatrick, C. D., Bieging, J. H., & Rieke, G. H. 2014, ApJ, 796, 144
- Kilpatrick et al. (2016) Kilpatrick, C. D., Bieging, J. H., & Rieke, G. H. 2016, ApJ, 816,1
- Kumar et al. (2014) Kumar, H. S., Safi-Harb, S., Slane, P. O., & Gotthelf, E. V. 2014, ApJ, 781, 41
- Li et al. (2017) Li, J., Rea, N., Torres, D. F., & de Ona-Wilhelmi, E. 2017, ApJ, 835, 30
- Lin et al. (2011) Lin, L., Kouveliotou, C., Göğüş, E., et al. 2011, ApJL, 740, L16
- Liu et al. (2015) Liu, B., Chen, Y., Zhang, X. et al. 2015, ApJ, 809, 102
- Ma et al. (2016) Ma, Y. K., Ng, C.-Y., Bucciantini, N., et al. 2016, ApJ, 820, 100
- Olausen & Kaspi (2014) Olausen, S. A., & Kaspi, V. M. 2014, ApJS, 212, 6
- Rudie et al. (2008) Rudie, G. C., Fesen, R. A., & Yamada, T. 2008, MNRAS, 384, 1200
- Slysh et al. (1999) Slysh, V. I., Val’tts, I. E., Kalenskii, S. V., et al. 1999, A&AS, 134, 115
- Takata et al. (2013) Takata, J., Wang, Y., Wu, E. M. H., Cheng, K. S., 2013, MNRAS, 431, 2645
- Tanaka et al. (2011) Tanaka, T., Allafort, A., Ballet, J., et al. 2011, ApJL, 740, L51
- Tian & Leahy (2008) Tian, W. W., & Leahy, D. A. 2008, ApJ, 677, 292
- Tian & Leahy (2011) Tian, W. W., & Leahy, D. A. 2011, ApJL, 729, L15
- Tibolla et al. (2011) Tibolla, O., Mannheim, K., Elsässer, D., & Kaufmann, S. 2011, arXiv:1111.1634
- Tong (2016) Tong, H. 2016, RAA, 16, 143
- Vasisht & Gotthelf (1997) Vasisht, G., & Gotthelf, E. V. 1997, ApJL, 486, L129
- Wachter et al. (2004) Wachter, S., Patel, S. K., Kouveliotou, C., et al. 2004, ApJ, 615, 887
- Xing et al. (2014) Xing, Y., Wang, Z., Zhang, X., & Chen, Y. 2014, ApJ, 781, 64
- Yeung et al. (2016) Yeung, P. K. H., Kong, A. K. H., Tam, P. H. T., et al. 2016, ApJ, 827, 41
- Younes et al. (2016) Younes, G., Kouveliotou, C., Kargaltsev, O., et al. 2016, ApJ, 824, 138
- Zhang (2003) Zhang, B. 2003, in Proc. Int. Workshop on Strong Magnetic Fields and Neutron Stars: Spin-Down Power of Magnetars, ed. H. J. Mosquera Cuesta, H. Peréz Rojas, & C. A. Zen Vasconcellos, 83
- Zirakashvili et al. (2014) Zirakashvili, V. N., Aharonian, F., Yang, R., Wilhelmi, E. O., & Tuffs, R. J. 2014, ApJ, 785, 130
| Radius of extension (deg) | |
|---|---|
| 0.1 | 16.2026 |
| 0.2 | 42.6688 |
| 0.3 | 59.6818 |
| 0.31 | 59.8536 |
| 0.32 | 60.9114 |
| 0.325 | 60.8942 |
| 0.33 | 60.8948 |
| 0.34 | 60.8702 |
| 0.35 | 60.6538 |
| 0.36 | 60.7046 |
| 0.37 | 59.9428 |
| 0.4 | 56.9028 |
| 0.210 GeV | 10200 GeV | |
| PL | ||
| 2.247 0.039 | 1.992 0.223 | |
| Flux ( photons cm-2 s-1) | 84.68 4.28 | 0.362 0.091 |
| TS | 678.8 | 21.7 |
| PLE | ||
| 1.952 0.132 | 1.832 0.616 | |
| (MeV) | 5092.0 2121.2 | 244638.0 992998.0 |
| Flux ( photons cm-2 s-1) | 80.93 5.0 | 0.362 0.091 |
| TS | 691.4 | 21.7 |
| BKPL | ||
| 1.955 0.082 | 1.16 0.551 | |
| 2.631 0.109 | 58.896 410.359 | |
| (MeV) | 1241.3 248.8 | 40480.9 28812.3 |
| Flux ( photons cm-2 s-1) | 79.47 9.52 | 0.337 0.152 |
| TS | 696.9 | 24.3 |
| Source | SNR age | Energy band | Photon index | References |
|---|---|---|---|---|
| (kyr) | (GeV) | |||
| Fermi J1841.1-0458 | 0.752.1 | 0.21.24 | 1.95 0.08 | (1), (2) |
| 1.2410 | 2.63 0.11 | |||
| 10200 | 1.99 0.22 | |||
| Cas A | 0.34 | 0.550 | 2.0 0.1 | (3), (4) |
| RX J0852.0-4622 | 2.45.1 | 1300 | 1.85 0.06 | (5), (6) |
| RX J1713.7-3946 | 1.6 | 0.5300 | 1.53 0.07 | (7), (8), (9) |
| Crab Nebula | 1.0 | 0.11 | 3.59 0.07 | (10), (11) |
| 113.9 | 1.48 0.07 | |||
| 13.9300 | 2.19 0.17 | |||
| RCW 103 | 2.0 | 1300 | 2.0 0.1 | (12), (13) |
| Tycho | 0.44 | 0.3500 | 2.14 0.09 | (14) |
References. (1) this work, (2) Kumar et al. (2014), (3) Fesen et al. (2006), (4) Abdo et al. (2010e), (5) Allen et al. (2015), (6) Tanaka et al. (2011), (7) Fesen et al. (2012), (8) Katsuda et al. (2015), (9) Federici et al. (2015), (10) Rudie et al. (2008), (11) Buehler et al. (2012), (12) Carter et al. (1997), (13) Xing et al. (2014), (14) Archambault et al. (2017).