22email: ghurier@ias.u-psud.fr
High significance detection of the tSZ effect relativistic corrections
The thermal Sunyaev-Zel’dovich (tSZ) effect is produced by the interaction of cosmic microwave background (CMB) photons with the hot (a few keV) and diffuse gas of electrons inside galaxy clusters integrated along the line of sight. This effect produces a distortion of CMB blackbody emission law. This distortion law depends on the electronic temperature of the intra-cluster hot gas, , through the so-called tSZ relativistic corrections. In this work, we have performed a statistical analysis of the tSZ spectral distortion on large galaxy cluster samples. We performed a stacking analysis for several electronic temperature bins, using both spectroscopic measurements of X-ray temperatures and a scaling relation between X-ray luminosities and electronic temperatures. We report the first high significance detection of the relativistic tSZ at a significance of 5.3 . We also demonstrate that the observed tSZ relativistic corrections are consistent with X-ray deduced temperatures. This measurement of the tSZ spectral law demonstrates that tSZ effect spectral distorsion can be used as a probe to measure galaxy cluster temperatures.
Key Words.:
Cosmology: Observations – Cosmic background radiation – Sunyaev-Zel’dovich effect1 Introduction
Galaxy clusters contain a hot thermal plasma that Comptonize the cosmic microwave background (CMB) photons when they are traversing the galaxy cluster.
This interaction produces the well known thermal Sunyaev-Zel’dovich (tSZ) effect (Sunyaev & Zeldovich, 1972), which induces a spectral distortion of the CMB blackbody emission law.
This spectral distortion can be considered as independent of the electron energies as long as the electron velocities are significantly smaller than the speed of light, .
Typical plasma inside galaxy clusters have a temperature of several keV.
Thermal electrons in hot galaxy clusters ( keV) have velocities of the order of 0.1 .
Consequently, relativistic corrections have to be applied to the tSZ spectral distorsions (Wright, 1979).
Fitting formula have been proposed to ease the modeling of the tSZ relativistic corrections (Nozawa et al., 2000).
These relativistic corrections offer the possibility of using the tSZ effect spectral distorsion as a probe to measure the temperature of the hot plasma inside galaxy clusters (Pointecouteau et al., 1998; Ensslin & Hansen, 2004).
Recent works (Zemcov et al., 2010, 2012) have reported evidence of the tSZ relativistic corrections up to 3 using Z-Spec.
Galaxy clusters host galaxies, and consequently the tSZ effect is spatially correlated with radio and infrared emission from galaxies.
Radio galaxies and infrared emissions have been shown to be a significant bias for tSZ-based studies (Hurier et al., 2013; Planck Collaboration 2015 results XXIII, 2016).
Thus, if not considered carefully these emissions could significantly bias an attempt of detection for the tSZ relativistic corrections.
The measurement using tSZ effect by Hurier et al. (2014) has shown that Planck fullsky multi-wavelength observations of the sub-millimeter and microwave skies are tailored to study the properties of the tSZ spectral distorsions. In this work, we present the first high-significance detection of the tSZ relativistic correction using a statistical analysis of a large galaxy cluster sample. The paper is organized as follows, Section 2 presents the data used in this analysis, Section 3 describes the tSZ effect, Section 4 describes the methodology, and Section 5 presents the results.
2 The data
2.1 Planck intensity full-sky maps
This paper uses the first 15.5 month survey mission of Planck HFI (Planck Collaboration early I, 2011), corresponding to two full-sky surveys (Planck Collaboration results I, 2014). We refer to Planck Collaboration results VI (2014) and Planck Collaboration results VIII (2014) for the generic scheme of time-ordered information (TOI) processing and map-making, as well as for the technical characteristics of the Planck frequency maps. The Planck channel maps are provided in HEALPix (Górski et al., 2005) at full resolution. An error map is associated with each channel map and is obtained from the difference of the first half and second half of the survey rings, for a given pointing position of the satellite spin axis. Here we approximate the Planck HFI beams by effective circular Gaussians with FWHM up to 5 arc minutes that can be found in Planck Collaboration results VII (2014).
2.2 Catalogs
We used two different galaxy cluster samples. The first one considers all galaxy clusters in the MCXC catalog (Piffaretti et al., 2011). For this sample we computed the electron temperatures using the scaling relation from Pratt et al. (2009),
| (1) |
In the second sample we considered galaxy clusters for which we have a spectroscopic temperature (Cavagnolo et al., 2008; Zhang et al., 2008; Vikhlinin et al., 2009; Pratt et al., 2009; Eckmiller et al., 2011; Mittal et al., 2011; Reichert et al., 2011; Mahdavi et al., 2013; Laganá et al., 2013).
In Table. 1, we summarize the main characteristics of each galaxy cluster catalogs, is the number of objects in the catalog,
and are the covered range of temperature, is the median.
We stress that the different catalogs present overlaps of objects. This overlap has been considered in the following analysis.
| Catalog | |||||||
|---|---|---|---|---|---|---|---|
| MCXC | 1743 | 0.11 | 10.25 | 2.81 | 0.00 | 1.26 | 0.14 |
| CAV08 | 192 | 2.44 | 19.13 | 6.99 | 0.03 | 1.24 | 0.26 |
| ZHA08 | 37 | 3.2 | 11.6 | 6.7 | 0.14 | 0.30 | 0.23 |
| VIK09 | 85 | 2.13 | 14.72 | 4.4 | 0.03 | 0.89 | 0.09 |
| PRA09 | 31 | 2.07 | 8.91 | 3.85 | 0.06 | 0.18 | 0.12 |
| ECK11 | 26 | 0.62 | 2.99 | 1.61 | 0.01 | 0.05 | 0.02 |
| MIT11 | 64 | 0.90 | 15.91 | 4.37 | 0.00 | 0.22 | 0.05 |
| REI11 | 232 | 2.0 | 15.0 | 5.9 | 0.04 | 1.46 | 0.30 |
| MAH13 | 50 | 3.1 | 12.1 | 6.5 | 0.15 | 0.55 | 0.24 |
| LAG13 | 117 | 2.0 | 15.2 | 5.8 | 0.11 | 1.24 | 0.35 |
3 The tSZ effect
The thermal Sunyaev-Zel’dovich effect (Sunyaev & Zeldovich, 1972) is a distortion of the CMB blackbody radiation through inverse Compton scattering. CMB photons receive an average energy boost by collision with hot (a few keV) ionized electrons of the intra-cluster medium (see e.g., Birkinshaw, 1999; Carlstrom et al., 2002, for reviews). The thermal SZ Compton parameter in a given direction, , on the sky is given by
| (2) |
where d is the distance along the line-of-sight, , and and are the electron number density and temperature, respectively. In units of CMB temperature, the contribution of the tSZ effect for a given observation frequency is
| (3) |
Neglecting relativistic corrections we have
| (4) |
with . At , where = 2.7260.001 K, the tSZ effect is negative below 217 GHz and positive for higher frequencies.
Compton parameter to CMB temperature, KCMB, conversion factors for each frequency channel depend of the convolution of this tSZ contribution to the sky intensity with the Planck frequency responses.
This characteristic spectral signature of tSZ effect makes it a unique tool for the detection of galaxy clusters as presented in Planck Collaboration 2015 results XXVII (2016) and is related to through relativistic corrections.
The relativistic corrections on the tSZ emission law have been computed as presented in (Pointecouteau et al., 1998).
From this estimation, if we assume that the relativistic corrections on the tSZ emission law can be described as a first order approximation (see Nozawa et al., 2000, for a detailed fitting formula),
| (5) |
the averaged tSZ emission from different electron populations at various temperatures can be modeled with a single temperature. This approach enables the possibility to perform stacking analyses of the tSZ relativistic corrections.
This approximation is already implicitly considered when fitting a single temperature on the observed tSZ signal. Considering that electronic temperature varies along the line of sight. We stress that the quasi linear behavior of the tSZ spectral distorsion relativistic corrections with respect to is only used to motivate a stacking analysis. In the following, when fitting for on the stacked tSZ signal we use the exact tSZ spectral distorsion as a function of .
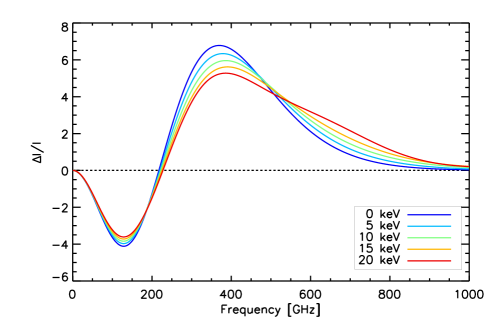
Figure 1 shows the tSZ spectral dependance as a function of the frequency for various temperatures of the hot plasma ranging from 0 to 20 keV. We observe that the main consequence of relativistic corrections is a modification of the zero frequency, , of the tSZ spectral distorsion, that follows the relation . We also observe a significant increase of the 353 to 545 GHz tSZ intensity ratio. In general, higher temperatures for the plasma will favor a higher tSZ amplitude at high-frequencies, and a lower tSZ intensity at low frequencies.
The Planck experiment has a large frequency coverage at low frequency ( GHz) where the tSZ effect produces an intensity decrement, at GHz where tSZ effect is almost null, and at higher frequencies ( GHz) where tSZ produce positive anisotropies on the CMB. This makes Planck HFI a really tailored instrument for the tSZ effect detection and scientific exploitation.
4 Methodology
4.1 Estimation of tSZ flux per frequency and stacking
We refer to Hurier et al. (2014) for a detailed description of the tSZ flux extraction in Planck intensity maps. We first extracted 2x2o patches around each galaxy clusters. We cleaned for infrared emission using the 857 GHz channel. We also computed a tSZ -map with the MILCA method (Hurier et al., 2013) and we estimated the tSZ flux in each Planck frequency using the MILCA map as a template to build the spectral energy distribution (SED) toward each galaxy clusters. Then, we subtract the 217 GHz signal to other channels in order to clean for CMB emission. Finally, we divided our galaxy clusters samples into bins. We separated the MCXC into five temperature bins ( keV) and the spectroscopic sample into three temperature bins ( keV). Then, we performed a stack of individual galaxy cluster maps for each temperature bin.
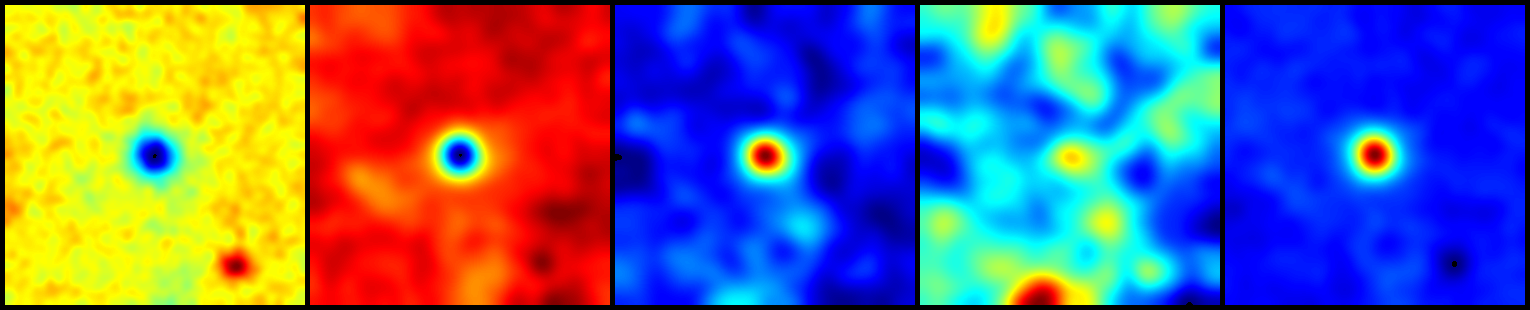
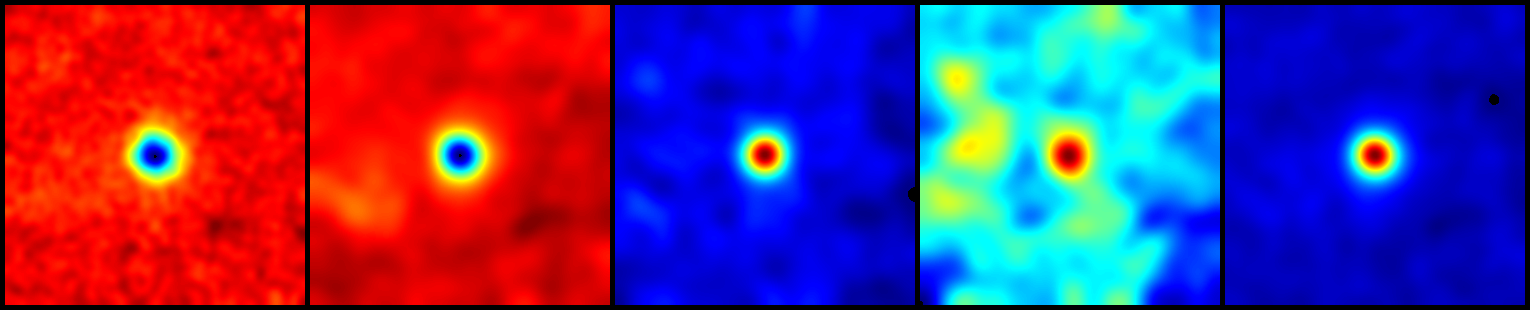
Figure 2 shows the results of the stacking procedure toward MCXC clusters for the lowest temperature bin (top panel) and for the highest temperature bin (bottom panel). We observe a significant amount of tSZ signal in the 545 GHz stacked map for the high-temperature bin, whereas the low-temperature bin does not present a significant tSZ emission at this frequency.
4.2 Background and foreground contamination
To estimate the contamination by other sources of anisotropies in Planck frequency maps, we performed the flux extraction, as described in Hurier et al. (2014), at 1000 random positions across the sky. These random positions follow the same spatial repartition in latitude as our sample of galaxy clusters to avoid any bias coming from the galactic plane area, which does not contain galaxy clusters in the used sample. In the following we consider that uncertainties are uncorrelated between two different galaxy clusters.
Consequently we can derived the full covariance matrix for the flux estimation in frequency channels from 100 to 545 GHz, an example of such a correlation matrix is presented in Table. 2.
This covariance matrix has a determinant of , which quantifies the volume occupied by the swarm of the data samples in our four dimension subspace (HFI frequencies from 100 to 545 GHz excluding 217 GHz).
Considering that most foreground and background emissions have been cleaned from the maps, the covariance matrix is dominated by the instrumental noise, that is correlated between frequencies due to the cleaning process. The high level of correlation between 353 and 545 GHz also receives contributions from thermal dust residuals in these maps.
We stress that this correlation matrix only accounts for uncertainties produced by uncorrelated components with respect to the tSZ effect.
| Frequency (GHz) | 100 | 143 | 353 | 545 |
|---|---|---|---|---|
| 100 | 1 | 0.62 | -0.49 | -0.48 |
| 143 | 0.62 | 1 | -0.49 | -0.56 |
| 353 | -0.49 | -0.49 | 1 | 0.83 |
| 545 | -0.48 | -0.56 | 0.83 | 1 |
4.3 Correlated foreground contamination
As we discuss in Sect 4.2, errors induced by uncorrelated foregrounds can be fairly estimated using random positions over the sky. However this estimation does not account for extra-noise and bias produced by physically correlated emissions, such as radio sources contamination at low frequency, cosmic infrared background (CIB) contamination at high frequency, and CMB secondary anisotropies themselves through the kSZ effect.
4.3.1 Cosmic infrared background
For the estimation of from tSZ measurement, the 545 GHz map is the key frequency channel, however it is also a frequency for which one the detection of the tSZ effect is the most challenging. At this frequency 10% of the CIB emission is produced by objects with redshift lower than 1.0 (Lagache et al., 2005; Addison et al., 2012). See Planck Collaboration 2015 results XXIII (2016), for a measurement of the tSZCIB cross correlation. An excess of emission at high frequency is produced by the CIB residuals, which thus mimic the effect of relativistic corrections on the tSZ spectral distorsion.
The tSZ emission scales as to the power of (Planck Collaboration results XXIX, 2014) and the CIB scales as to the power of (Planck Collaboration 2015 results XXIII, 2016). Consequently, the tSZ-CIB ratio decrease with and thus with as assuming that evolves as .
This implies that CIB residuals will be more important for low temperature galaxy clusters.
Consequently, CIB contamination can be separated from tSZ relativistic corrections by considering several bins of temperature.
We also stress that our dust-cleaning procedure using the 857 GHz channel will remove most of the CIB contamination, considering that the clusters in our sample are essentially low- objects (Planck Collaboration 2015 results XXIII, 2016). Indeed, dusty galaxy emission in these galaxy clusters presents a very similar spectral behavior to the Milky Way.
4.3.2. Radio point sources
In order to avoid contamination by radio loud active galactic nucleus (AGN), we removed from the analysis clusters that present an emission above 0.5 mKCMB at 100 GHz in a radius of 30’ from the galaxy cluster position.
4.3.3. kSZ
The kSZ effect follows the same spectral dependance as the CMB and thus is suppressed from our analysis by the CMB cleaning performed with the 217 GHz channel.
However, some kSZ residuals may remains in the measured SED due to calibration uncertainties (Planck Collaboration 2015 results VIII, 2016). The inter-calibration uncertainties at 100, 143, 217, 353, and 545 GHz are 0.09, 0.07, 0.16, 0.78, and 5% respectively.
We stress that absolute calibration uncertainty does not affects the tSZ spectral signature, it only affects the overall Compton parameter normalization, which did not impact the estimation of .
Propagating these uncertainties through our data processing, we deduced that the calibration uncertainties induce a leakage of the kSZ effect amplitude into tSZ effect flux measurement with a standard deviation of 0.2%. The kSZ is typically one order of magnitude fainter than the tSZ effect, similarly tSZ relativistic corrections modify the tSZ spectral distorsion by . Consequently, kSZ effect residuals may affect the tSZ relativistic corrections measurement at for a single galaxy cluster. Additionally, the kSZ effect is averaging to zero when stacking galaxy clusters, the bias for a given temperature bin is thus . Consequently, the kSZ component contamination can be safely neglected.
4.4 Systematics produced by bandpass and calibration uncertainties
The only Planck channel that presents a significant relative bandpass uncertainty for the tSZ effect is the 217 GHz channel (Planck Collaboration results IX, 2014). However, as we clean for CMB using this channel, we are not sensitive to this uncertainty in the measurement of through relativistic corrections to the tSZ effect spectral distorsion.
However, the relative calibration uncertainty is a major limitation, as this uncertainty is higher at high frequency (Planck Collaboration results VIII, 2014), where the tSZ relativistic corrections present a significant departure form non-relativistic tSZ.
Calibration uncertainties are % for 100, 143 and 217 GHz channels, at 353 GHz and 5% at 545 and 857 GHz.
In the following, we consider uncertainties from calibration and propagate them to our analysis.
5 Data analysis
5.1 Profile likelihood analysis
To describe our measurement, the most general model reads
| (6) |
with being the exact tSZ spectral distorsion for a plasma temperature, , the integrated Compton parameter for temperature bin ,
and a synchrotron spectrum with spectral index -1. Adjustable parameters are , , and the synchrotron amplitude.
To fit the value of in each temperature bins, we used a profile likelihood approach. We use a flat prior for the synchrotron contamination: . For each value of and , we compute through an unbiased linear fit the tSZ flux, , of our measurement.
In this analysis we have uncertainties on both the measurement (mainly the CMB contamination) and the model (bandpass uncertainties), this two sources of uncertainties have similar amplitudes. Consequently we use the following estimator:
| (7) |
With the tSZ transmission vector, the covariance matrix, is the measured tSZ emission law and is the inverse of the noise covariance matrix on . Then we compute the , for each couple of parameters (, ) as
| (8) |
Finally, we estimate the value of by marginalizing over and computing the first-order momentum of the likelihood function, , with respect to . We compute the uncertainties on using the second-order momentum of .
5.2 Averaged electronic temperatures
If we assume a first order approximation of the tSZ spectral distorsion, then the bin-averaged temperature is given by,
| (9) |
where is the averaged temperature for the bin , is the temperature of a given galaxy cluster, , in the bin , and the integrated Compton parameter of the galaxy cluster .
However, tSZ relativistic corrections are not linear with respect to , thus differs from the Compton parameter weighted average of .
We estimated the discrepancy between the Compton parameter weighted temperature and the real average by performing stacks of the real tSZ spectral distorsions in temperature bins, for electronic temperatures ranging from 0 to 15 keV and bin width ranging from 1 to 10 keV. Then, we fit for a single temperature in each temperature bin using Eq. 8. We stress that the bias is thus dependent on the experimental setting (frequency coverage and data covariance matrix).
We found that in small bins this discrepancy is negligible, below keV for bin width keV. This supports the first order linear assumption when performing a stacking analysis of the tSZ relativistic corrections.
5.3 Results
Figure 3 shows the relation between the temperature derived from tSZ relativistic corrections and the temperature derived from X-ray luminosity. Fitting for the slope of this relation we obtain , with a significance of 3.7 and consistent with a 1:1 relation at 1.4 . Considering the large number of galaxy clusters inside each bin, the uncertainties over the X-ray temperature average is small compared to temperature bin width and tSZ temperature uncertainties. Thus, we did not display these uncertainties.

Figure 4 shows the relation between the temperature derived from tSZ relativistic corrections and the temperature derived from spectroscopic X-ray analyses. Fitting for the slope of this relation we obtain, , with a significance of 5.3 and consistent with a 1:1 relation at 1.5 . Uncertainties over the X-ray spectroscopic temperature are small compared to the bin width and tSZ temperature uncertainties. Consequently, they are displayed on the figure.
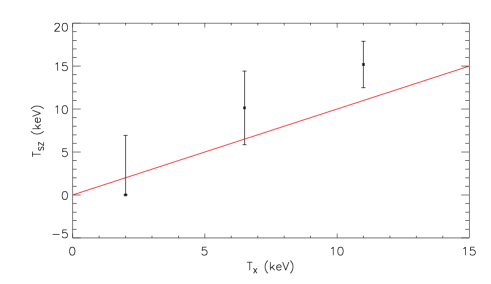
In both cases, Figs. 3 and 4, we recover the expected relation between tSZ estimated temperatures and X-ray temperatures. We do not observe significant contamination produced by CIB residuals, that would appears as an overestimation of the tSZ temperature in the lowest temperature bins. We observe in both cases that the tSZ temperature for the highest X-ray temperature bins overestimates the X-ray temperature. This bias might be produced by calibration uncertainties leading to an overall bias in all temperature bins. In Fig. 4, the highest temperature bin is dominated by calibration uncertainties, which supports the calibration origin of the observed high-temperature overall excess for the tSZ relativistic corrections.
6 Discussion and conclusion
We have performed the first high signal-to-noise ratio detection of the tSZ relativistic corrections at a significance level of 5.3 .
We have considered potential contamination by radio and infrared emission and shown that thes sources of contaminations are negligible.
In this work, the tSZ relativistic corrections detection has been achieved through a statistical analysis of large galaxy cluster samples. In particular, we used several temperature bins to distinguish real tSZ relativistic corrections signature from systematic effects such as CIB contamination or calibration uncertainties.
This analysis exhibits the complexity of the tSZ relativistic corrections recovery from a small number of frequencies due to the required cleaning of CMB and infrared astrophysical components.
However, future CMB-experiments, such as COrE+111http://hdl.handle.net/11299/169642, which will have better sensitivity or a more refined frequency coverage will offer the possibility of performing better measurements, and scientific exploitation of the tSZ relativistic corrections ( Hurier et al., in prep).
The tSZ effect spectral distorsion is commonly used as a prior for galaxy cluster detection, this analysis shows that we are now reaching the level of accuracy where tSZ relativistic corrections can be detected. This implies that galaxy cluster detection based on the tSZ spectral distorsion neglecting relativistic corrections might be biased toward low-temperature objects, and then bias the detection of high-z high-mass galaxy clusters.
Acknowledgements
The author thanks N.Aghanim & D.Poletti for useful discussions and comments. We acknowledge the support of the French Agence Nationale de la Recherche under grant ANR-11-BD56-015.
References
- Addison et al. (2012) Addison, G. E., Dunkley, J., & Spergel, D. N. 2012, MNRAS, 427, 1741
- Birkinshaw (1999) Birkinshaw, M. 1999, Phys. Rep, 310, 97
- Carlstrom et al. (2002) Carlstrom, J. E., Holder, G. P., & Reese, E. D. 2002, ARA&A, 40, 643
- Cavagnolo et al. (2008) Cavagnolo, K. W., Donahue, M., Voit, G. M., & Sun, M. 2008, ApJ, 682, 821
- Eckmiller et al. (2011) Eckmiller, H. J., Hudson, D. S., & Reiprich, T. H. 2011, A&A, 535, A105
- Ensslin & Hansen (2004) Ensslin, T. A. & Hansen, S. H. 2004, ArXiv Astrophysics e-prints
- Górski et al. (2005) Górski, K. M., Hivon, E., Banday, A. J., et al. 2005, ApJ, 622, 759
- Hurier et al. (2014) Hurier, G., Aghanim, N., Douspis, M., & Pointecouteau, E. 2014, A&A, 561, A143
- Hurier et al. (2013) Hurier, G., Macías-Pérez, J. F., & Hildebrandt, S. 2013, A&A, 558, A118
- Lagache et al. (2005) Lagache, G., Puget, J.-L., & Dole, H. 2005, ARA&A, 43, 727
- Laganá et al. (2013) Laganá, T. F., Martinet, N., Durret, F., et al. 2013, A&A, 555, A66
- Mahdavi et al. (2013) Mahdavi, A., Hoekstra, H., Babul, A., et al. 2013, ApJ, 767, 116
- Mittal et al. (2011) Mittal, R., Hicks, A., Reiprich, T. H., & Jaritz, V. 2011, A&A, 532, A133
- Nozawa et al. (2000) Nozawa, S., Itoh, N., Kawana, Y., & Kohyama, Y. 2000, ApJ, 536, 31
- Piffaretti et al. (2011) Piffaretti, R., Arnaud, M., Pratt, G. W., Pointecouteau, E., & Melin, J.-B. 2011, A&A, 534, A109
- Planck Collaboration 2015 results VIII (2016) Planck Collaboration 2015 results VIII. 2016, A&A, 594, A8
- Planck Collaboration 2015 results XXIII (2016) Planck Collaboration 2015 results XXIII. 2016, A&A, 594, A23
- Planck Collaboration 2015 results XXVII (2016) Planck Collaboration 2015 results XXVII. 2016, A&A, 594, A27
- Planck Collaboration early I (2011) Planck Collaboration early I. 2011, A&A, 536, A1
- Planck Collaboration results I (2014) Planck Collaboration results I. 2014, A&A, 571, A1
- Planck Collaboration results IX (2014) Planck Collaboration results IX. 2014, A&A, 571, A9
- Planck Collaboration results VI (2014) Planck Collaboration results VI. 2014, A&A, 571, A6
- Planck Collaboration results VII (2014) Planck Collaboration results VII. 2014, A&A, 571, A7
- Planck Collaboration results VIII (2014) Planck Collaboration results VIII. 2014, A&A, 571, A8
- Planck Collaboration results XXIX (2014) Planck Collaboration results XXIX. 2014, A&A, 571, A29
- Pointecouteau et al. (1998) Pointecouteau, E., Giard, M., & Barret, D. 1998, A&A, 336, 44
- Pratt et al. (2009) Pratt, G. W., Croston, J. H., Arnaud, M., & Böhringer, H. 2009, A&A, 498, 361
- Reichert et al. (2011) Reichert, A., Böhringer, H., Fassbender, R., & Mühlegger, M. 2011, A&A, 535, A4
- Sunyaev & Zeldovich (1972) Sunyaev, R. A. & Zeldovich, Y. B. 1972, Comments on Astrophysics and Space Physics, 4, 173
- Vikhlinin et al. (2009) Vikhlinin, A., Burenin, R. A., Ebeling, H., et al. 2009, ApJ, 692, 1033
- Wright (1979) Wright, E. L. 1979, ApJ, 232, 348
- Zemcov et al. (2012) Zemcov, M., Aguirre, J., Bock, J., et al. 2012, ApJ, 749, 114
- Zemcov et al. (2010) Zemcov, M., Rex, M., Rawle, T. D., et al. 2010, A&A, 518, L16
- Zhang et al. (2008) Zhang, Y.-Y., Finoguenov, A., Böhringer, H., et al. 2008, A&A, 482, 451