Catalog of Candidates for Quasars at 3<z<5.5 Selected among X-Ray Sources from the 3XMM-DR4 Survey of the XMM-Newton Observatory
Аннотация
We have compiled a catalog of 903 candidates for type 1 quasars at redshifts selected among the X-ray sources of the serendipitous XMM-Newton survey presented in the 3XMM-DR4 catalog (the median X-ray flux is 510-15 erg s-1 cm-2 in the 0.5–2 keV energy band) and located at high Galactic latitudes in Sloan Digital Sky Survey (SDSS) fields with a total area of about 300 deg2. Photometric SDSS data as well infrared 2MASS and WISE data were used to select the objects. We selected the point sources from the photometric SDSS catalog with a magnitude error and a color (to first eliminate the M-type stars). For the selected sources, we have calculated the dependences for various spectral templates from the library that we compiled for these purposes using the EAZY software. Based on these data, we have rejected the objects whose spectral energy distributions are better described by the templates of stars at and obtained a sample of quasars with photometric redshift estimates . The selection completeness of known quasars at in the investigated fields is shown to be about 80%. The normalized median absolute deviation () is , while the outlier fraction is , when . The number of objects per unit area in our sample exceeds the number of quasars in the spectroscopic SDSS sample at the same redshifts approximately by a factor of . The subsequent spectroscopic testing of the redshifts of our selected candidates for quasars at will allow the purity of this sample to be estimated more accurately.
\DOI10.1134/S1063773716050042
keywords:
quasars, X-ray surveys, photometric redshift2016425277[294]
9 марта 2024 г.
1 Introduction
Searching for quasars at is one of the most important elements of studying the growth history of supermassive black holes and the evolution of mas- sive galaxies in the Universe. To improve the available constraints on the models of the X-ray luminosity function for quasars at requires collecting a large X-ray sample of distant quasars at high redshifts (see, e.g., Aird et al., 2015).Bright and dis tant quasars are rare objects, with X-ray surveys of large area and sufficient depth being needed for their search. Photometric and spectroscopic support at optical wavelengths is required to work with X-ray sources. An increasing role of the methods for estimating the photometric redshift to determine z and to classify the sources is traceable in present-day works on this subject matter Assef et al. (2011); Civano et al. (2012); Kalfountzou et al. (2014).
In their recent paper, Kalfountzou et al. (2014) constructed the X-ray luminosity function for quasars at based on a catalog of 209 X-ray sources detected in various sky fields with a total area of 33 deg2. This catalog consists of two parts: С-COSMOS is a Chandra X-ray survey with an area of 0.9 deg2, 122 sources with fluxes111Here and below, all X-ray fluxes and luminosities are given in the – keV energy band. erg s-1 cm-2 (Elvis et al., 2009) and ChaMP is a "serendipitous"survey based on CHANDRA pointings with area 33 deg2, 87 sources with fluxes erg s-1 cm-2 (Kim et al., 2007). The C-COSMOS survey has deep photometric (using a set of medium-band filters) and spectroscopic coverage and, for this reason, 90% identification completeness of objects at . The spectroscopic ChaMP program (44 objects) and various photometric relations (43 objects) were used to measure and estimate the redshifts of ChaMP sources. Thus, objects with firmly established redshifts may be deemed to constitute about 70% of the sample of quasars at z>3 from Kalfountzou et al.(2014).
The observations of numerous astrophysical objects with the XMM-Newton X-ray telescope accumulated for the last 15 years collectively represent a unique "serendipitous" X-ray sky survey (Watson et al., 2009) with a total area of about 800 deg2 and a sensitivity of erg s-1 cm-2 (the 3XMM-DR4 version; Watson et al., 2009, 2013). It is hoped that a sample of quasars at selected by their X-ray emission that exceeds the sample of Kalfountzou et al. (2014) by several times will be obtained on the basis of this survey. This is the goal of our work.
Photometric and spectroscopic support is required to work with the X-ray sources from the 3XMM-DR4 catalog. The solution of the problem is facilitated by publicly accessible surveys: the optical photometric and spectroscopic Sloan Digital Sky Surveys (SDSS, Alam et al., 2015; Aihara et al., 2011; Eisenstein et al., 2011) with areas of 14000 and 10000 deg2, respectively; the infrared photometric 2MASS (Cutri et al., 2003) and WISE (Wright et al., 2010) all-sky surveys.
The spectra were taken and the redshifts were measured for a large number of distant quasars as part of the spectroscopic SDSS programs. Therefore, it is natural to use the spectroscopic sample of SDSS objects (Alam et al. 2015) as the first step: 60000 quasars with zspec > 3 on 10000 deg2. However, the spectroscopic SDSS is based on a fairly complex method for the selection of quasar candidates whose completeness and purity depend on many factors: the redshift, the morphological properties of objects, the quality of photometry, etc. (Ross et al., 2013). The purity of the samples of distant quasar candidates for the SDSS does not exceed 50% (Ross et al., 2012). At the same time, it is unclear how the completeness and purity of the selection of candidates for the spec- troscopic SDSS program behave as a function of the X-ray flux.
The technique of comparing the spectral energy distribution of a source in the optical and infrared bands with the template spectra of quasars, stars, and galaxies can be used for the selection of quasar candidates at among the X-ray sources of the 3XMM-DR4 survey. Such a technique not only gives the probability that the object is a quasar but also allows its photometric redshift estimate to be obtained. In the case of quasars at high redshifts, , the reliability of their redshift estimates based on optical data increases, because the jump produced by the bright Ly line and the Ly forest in the quasar spectrum fall into the optical band. The addition of infrared WISE photometry increases the purity of the sample of distant quasar candidates and gives an advantage over the selection methods based only on SDSSphotometry.
In this paper, we present the sample of candidates for quasars at obtained by searching for such objects among the X-ray sources of the serendipitous XMM-Newton survey, 3XMM-DR4, using SDSS, 2MASS and WISE data. The properties of this sample are discussed. Subsequently, we are going to use this sample to construct the X-ray luminosity function for quasars . Here, we use the following cosmological parameters: =0.3, =0.7, =70 km s-1 Mpc-2.
2 THE SAMPLE OF X-RAY SOURCES WITH OPTICAL AND INFRARED PHOTOMETRY
In our work, we used data from the 3XMM-DR4222http://heasarc.gsfc.nasa.gov/W3Browse/xmm-newton/xmmssc.html (Watson et al., 2013). Our sample consists of 129541 point (SC_Extent=0) X-ray sources at Galactic latitudes |b|>20∘ and has an area of 300 deg2, which is determined by the area of the overlap between the 3XMM-DR4 survey and the SDSS; the area is calculated below. We work with the 0.5–2 keV X-ray flux (the sum of columns SC_EP2_FLUX and SC_EP3_FLUX in the 3XMM-DR4 catalog).
We cross-correlated the catalog of X-ray sources with the data from the photometric (data release 10) and spectroscopic (data release 12) SDSS (Aihara et al., 2011; Ahn et al., 2012; Alam et al., 2015; Eisenstein et al., 2011). Within the 2 X-ray source position error (if it was less than 3\arcsec, then within 3\arcsec) we searched for all optical SDSS sources. As a result, we produced a catalog of 64714 X-ray sources that have an optical counterpart among the SDSS objects. At the same time, 2489 (4%) X-ray sources have more than one optical counterpart. In the case of an ambiguous correspondence, we estimated for all the possible optical counterparts of a given X-ray source. It turns out that there are spectroscopic data for 12823 ( of the sample) X-ray sources in the SDSS. We deemed the spectroscopic redshift measurement reliable at the flag zWarning=0. It turns out that 390 sources in the 3XMM-DR4 catalog have and zWarning=0; 280 of them have a magnitude measurement error (see below).
We additionally made a cross-correlation with the catalog of quasars from flesch15a. This catalog contains the spectroscopically confirmed X-ray quasars the data on which were published before January 25, 2015, and the sample of reliable (the probability that >99% will turn out to be a quasar) photometric candidates from Bovy \etalr (2012); Richards et al. (2009). We added 49 objects with from the catalog of flesch15a, five of them with photometric estimates(Richards et al., 2009). As a result, we obtained a spectroscopic sample of 329 quasars with redshifts greater than 3 (280 from the spectroscopic SDSS sample and 49 from Flesch (2015)). This sample is required to check the completeness of our sample of quasars (see below).
We searched for infrared counterparts in the 2MASS (Cutri et al., 2003) and WISE (Wright et al., 2010) catalogs. The search was made within 6 arcsec of the X-ray source position. If we found no infrared counterpart for an optical source, then we set and limits for the 2MASS photometric , , bands and WISE photometric , , , bands, respectively, using the photometric data for adjacent sources. For the 2MASS and WISE sources that were not detected in all bands, we used the upper limits from the corresponding catalogs. We assumed that the 2MASS sources always corresponded to the sources with WISE photometry. When a WISE source was offset from an SDSS source by more than 2 arcsec, then we additionally considered the case where the source had only SDSS photometry when calculating . In this case, the upper limits in the 2MASS and WISE filters were taken to be equal to the WISE/2MASS magnitudes of the controversial source.
Thus, we have a flux measurement or an upper limit on the flux in 12 broad bands (, , , , , , , , , , , ) for the X-ray sources. To calculate the fluxes in all photometric bands, we used the magnitudes designed to measure the fluxes from point sources, which the distant quasars are. In addition, the search was made only among the point SDSS sources.
There is no photometry for bright stars in the SDSS. To take into account their influence on our quasar selection method, we searched for the counterparts of XMM-Newton X-ray sources within 6 arcsec in the Guide Star Catalog (GSC, Lasker et al., 1990). This catalog was produced by processing survey plates from the Palomar (northern hemisphere), Siding Spring (southern hemisphere), and several more observatories. The GSC contains 19 million sources with magnitudes from 6 to 16 (note that the sources brighter than magnitude 15 are overexposed in the SDSS), some of which were astrometrically classified as stars.
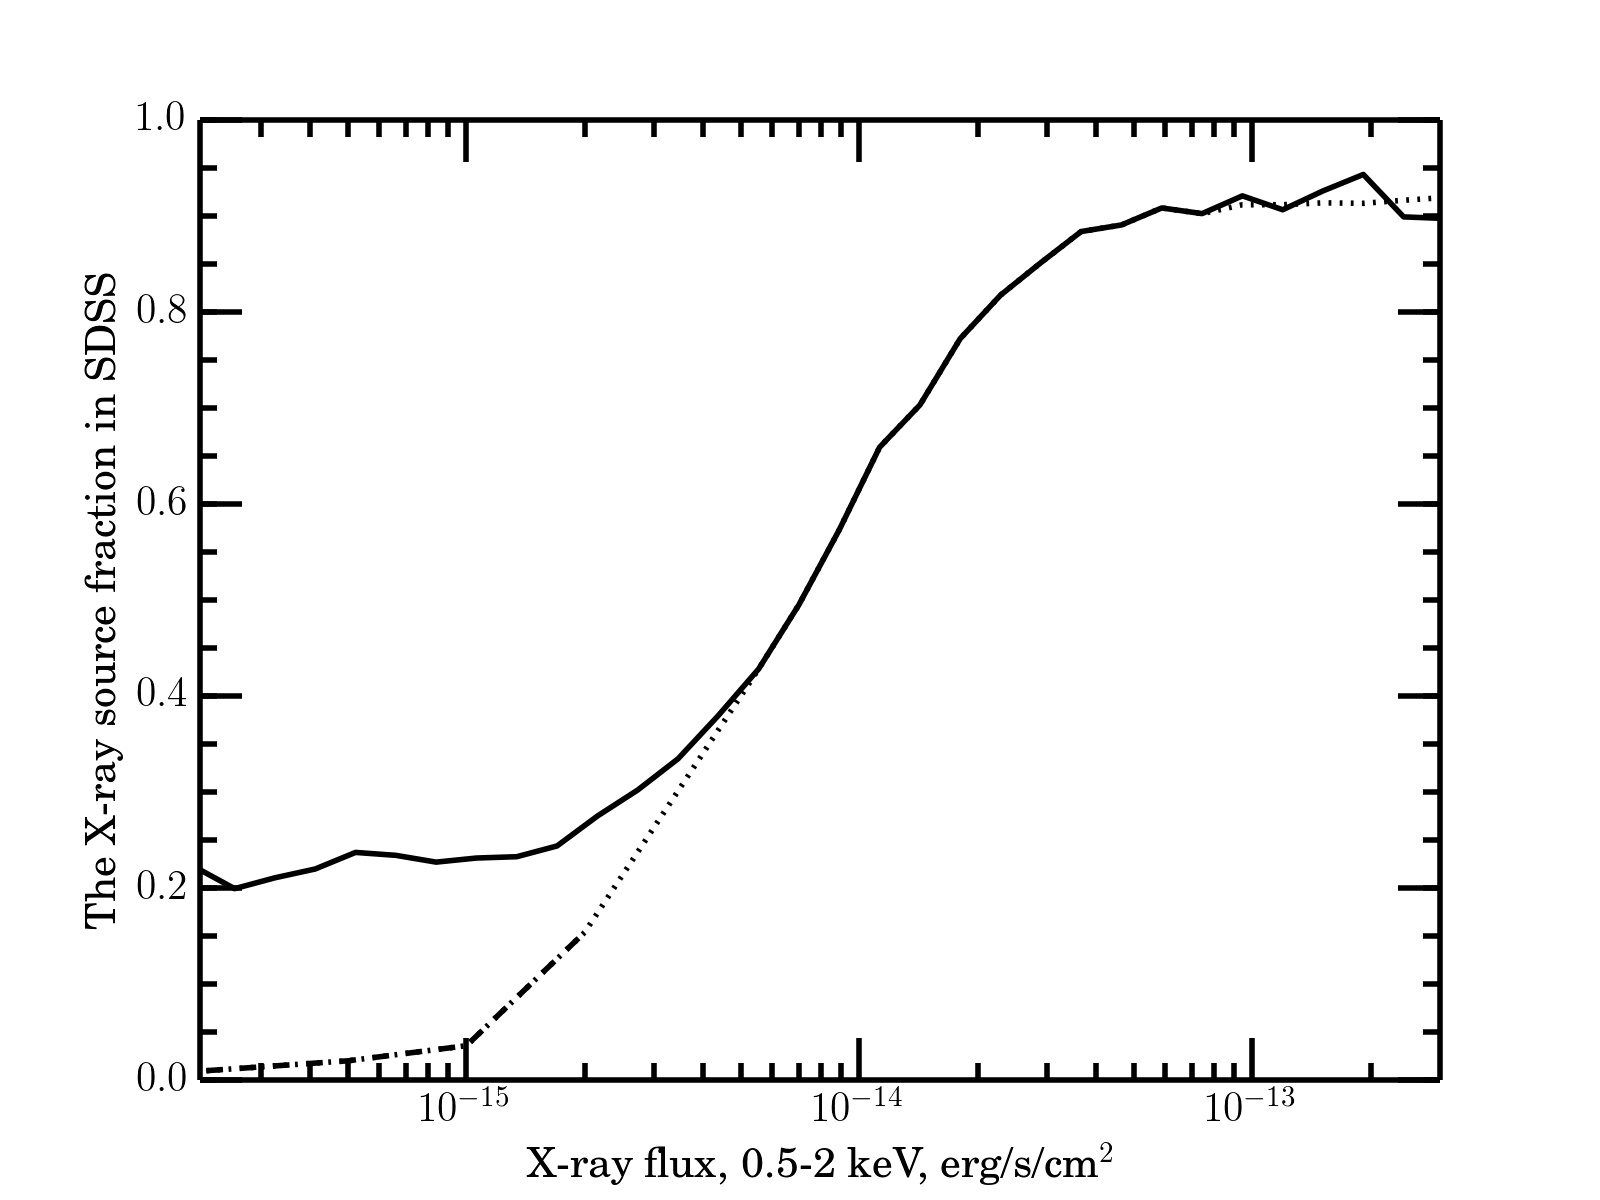
The fraction of X-ray sources in the 3XMM-DR4 catalog for which there are optical counterparts in the photometric SDSS and the
GSC drops with decreasing X-ray flux from
at erg s-1 cm-2 to
at erg s-1 cm-2.
At lower X-ray
fluxes, the fraction of nearby galaxies ( < 1) in
the sample of X-ray sources increases (Lehmer et al., 2012) ;
therefore, no further reduction in the
detection completeness of objects in the SDSS
occurs.
The quasars at constitute a small fraction of all X-ray sources, and the fraction of objects with optical counterparts for them can differ from that for all X-ray sources. This assumption can be tested using the representative sample of quasars with reliably measured from the deep С-COSMOS X-ray survey that was talked about above. Out of 122 objects in this sample, 32 have spectroscopic redshifts , 75 have reliable photometric redshifts (measured with a set of medium-band filters), and 15 have no optical counterpart to and, therefore, are also deemed probable candidates for quasars at (Kalfountzou et al., 2014; Civano et al., 2011). Figure 1 shows how the fraction of objects from this sample detected in the photometric SDSS changes with X-ray flux. The fraction of objects with optical counterparts detected in the SDSS among the quasars at turns out to be lower than that for all X-ray sources at fluxes below 210-15erg s-1 cm-2 by several times.
Below, when taking into account the influence of object detection incompleteness in the photometric SDSS on our final sample of candidates for quasars at , we use an approximate smooth photometric completeness function of the X-ray flux composed from the dependence for the detection completeness of quasars at at fluxes below 210-15 erg s-1 cm-2 and the corresponding dependence for all X-ray sources at fluxes above 510-15 erg s-1 cm-2 (see Fig. 1).
3 PHOTOMETRIC DATA FITTING BY SPECTRAL TEMPLATES
In our work, to calculate the при values when fitting the spectral energy distribution in the optical and infrared bands by various spectral templates and to obtain the photometric redshift estimates, we used the EAZY (Brammer et al., 2008). This software steps through a grid of redshifts and at each finds the best-fitting synthetic template by minimizing the value:
| (1) |
where is the number of photometric data points (filters), is the synthetic flux of template at redshift in filter , — is the observed flux in filter and — is the flux error that takes into account the photometric error in filter .
The EAZY software implements an algorithm that
allows one to seek a superposition of several spectral
templates, for example, the spectra of a galaxy and
a quasar. However, we use only a one-template fit
in our work, because we search for bright quasars
whose emission dominates over the emission from
the host galaxy. The quasars are characterized by
a large scatter of spectra and strong variability
(see e.g., Richards et al., 2006); therefore, it is necessary to
have a sufficiently complete template library.
For each object, we made separate iterations for the libraries of quasar and star templates. When fitting by the quasar templates, we corrected the SDSS photometry for extinction in our Galaxy using its values for each object from the photometric SDSS catalog. For the star templates, the SDSS photometry was not corrected for extinction in our Galaxy. The best value of was sought on the grid of redshifts with a 0.01 step by finding the best-fitting template from the library of quasars according to the test.
We also took into account the intergalactic ab- sorption by neutral hydrogen (Madau, 1995). he intergalactic absorption allows for the influence of the Ly forest on the spectral energy distribution of a quasar. At redshifts , Ly forest absorbs a substantial fraction of light on the blue side of the Ly line, and this fraction increases with redshift. At such redshifts, the Ly line falls into the photometric band, and the presence of a jump in аличие скачка поглощения Ly-forest absorption can already be determined from color. At redshifts above , the Ly line moves into the band, and the presence of an absorption jump is determined from the . This feature in the spectra of quasars at redshifts allows one to increase the identification reliability of such objects and to obtain more reliable photometric estimates of their redshifts (see below).
3.1 The Template Library

The targets of our search are type 1 quasars (without any significant intrinsic absorption) at . We used the spectral templates of quasars from the EAZY (Brammer et al., 2008) and LePHARE (Ilbert et al., 2006) libraries as well as from other libraries (Assef et al., 2010; Richards et al., 2006; Krawczyk et al., 2013). The templates that we modified (Krawczyk et al., 2013) were added to the library. In these templates, we took into account the contribution of the quasar’s emission lines obtained from the template (Vanden Berk et al., 2001). Besides, we extended the average spectrum of SDSS quasars (Vanden Berk et al., 2001) to the infrared ( ) using the template of a type 1 active galactic nucleus (AGN) (Assef et al., 2010) and added the resulting template to our library. We also added the templates of an elliptical galaxy (Assef et al., 2010) and a type 2 quasar (Polletta et al., 2007). As in (Dahlen et al., 2013), we applied the set of extinctions , , and according to the law of (Calzetti et al., 2000) using tabulated data from the LePHARE software package (Ilbert et al., 2006) to the templates.
We tested the template library on the spectroscopic SDSS-DR12 sample and eliminated those templates that more often erroneously classified a nearby object as an object at than correctly classified distant quasars from the template library. Thereafter, 14 templates remained, which were subsequently used to search for quasars at . These templates are presented in Fig. 2.
The galaxy and obscured quasar templates are needed only to eliminate the nearby objects whose accurate redshift is of no interest to us. In this case, no additional templates of galaxies (star-forming ones, with a different contribution of the active nucleus, etc.) are required to be applied, because this will increase the number of outliers and degrade the completeness and purity of the final sample of quasars at (Simm et al., 2015; Salvato et al., 2009).
For the templates of stars, we used the library of spectra from Pickles (1998). It includes the spectra of spectral types , , , , , , . For some of the templates, there is a breakdown into luminosity classes: i — supergiants, ii — luminous giants, iii — giants, iv — subgiants, v — main-sequence stars. The library spectra were constructed only to a wavelength of 2.5 m Pickles (1998). Since the WISE filters are longer-wavelength ones, each spectrum from this library was extrapolated by Planck’s law for black- body radiation to a wavelength of 30 m. Such assumption works well for single main-sequence stars hotter than M0.
3.2 Criteria for the Selection of Quasar Candidates
Since the quasars are star-like objects, we consider only the point SDSS sources when searching for distant quasars. In this case, the contamination of the sample by M-type stars presents a significant problem. Many of them are detected in the XMM-Newton X-ray survey owing to their coronal activity. During flares, the ratio of the X-ray and optical/near-IR fluxes for M dwarfs can be the same as that for quasars.
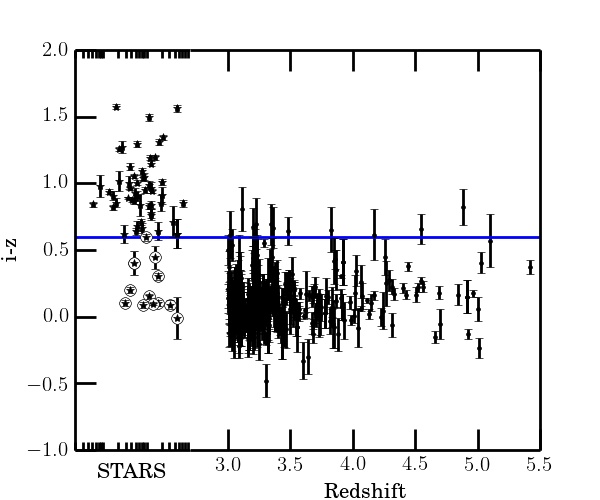
The SDSS sensitivity in the blue filters is in- sufficient to separate distant quasars with 20.5 from stars. M dwarfs can be separated from distant quasars only by the (Richards et al., 2002; Wu et al., 2012; Skrzypek et al., 2015): the stars have >0.8, while the quasars have <0.4. The color for the quasars remains approximately constant up to a redshift of 5.5, until the Ly line passes from to . The color of the quasars then becomes . The quasars at have reliable photometry only in one SDSS band, and, in that case, the method of determining by template fitting works poorly. Therefore, to increase the purity of our sample of quasar candidates, we used a constraint on the sensitivity in the SDSS band and the color:
| (2) |
where is the error in the apparent magnitude of a point source in the SDSS filter.
The constraint <0.2 help to reduce the selection effects in searching for quasars. The spectral energy distribution of quasars rises from 1 m to . The relations between the threshold sensitivities of the filters in the SDSS are such that by imposing the constraint (2), we guarantee the detection com- pleteness of type 1 quasars not only in the filter but also in bluer SDSS filters.
After applying the photometric constraints, the quasar candidates are selected according to the condition:
| (3) |
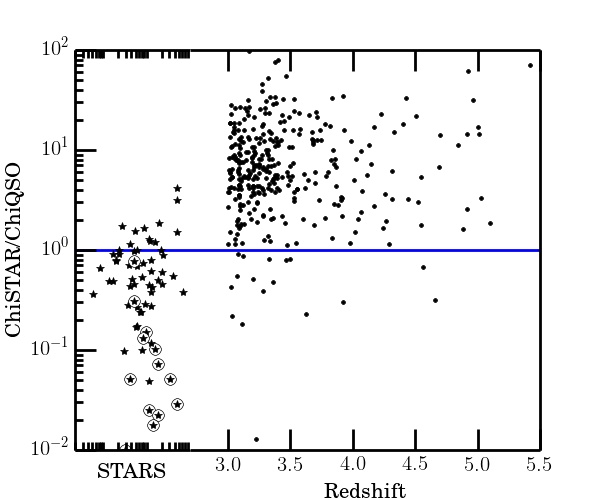
where is the smallest value for the template from the library of stars, and is the primary minimum of the distribution for the quasar templates.
The conditions and <0.6 eliminate 97% of the stars among the X-ray sources of the 3XMM-DR4 catalog. This was tested on stars for which the SDSS spectra are available (see Fig. 3).
There exists a scatter of relative to . Hence, some of the objects with will have ; therefore, we chose the lower limit when compiling the catalog of candidates for quasars at .
We additionally checked our sample of quasar candidates to eliminate, where possible, the source misidentification errors. We excluded 20 objects from the sample: two stars with the SDSS spectra, several faint sources against the background of a nearby bright galaxy, faint sources near a bright star, and objects with erroneously measured redshifts.

3.3 Examples of Objects from the Catalog
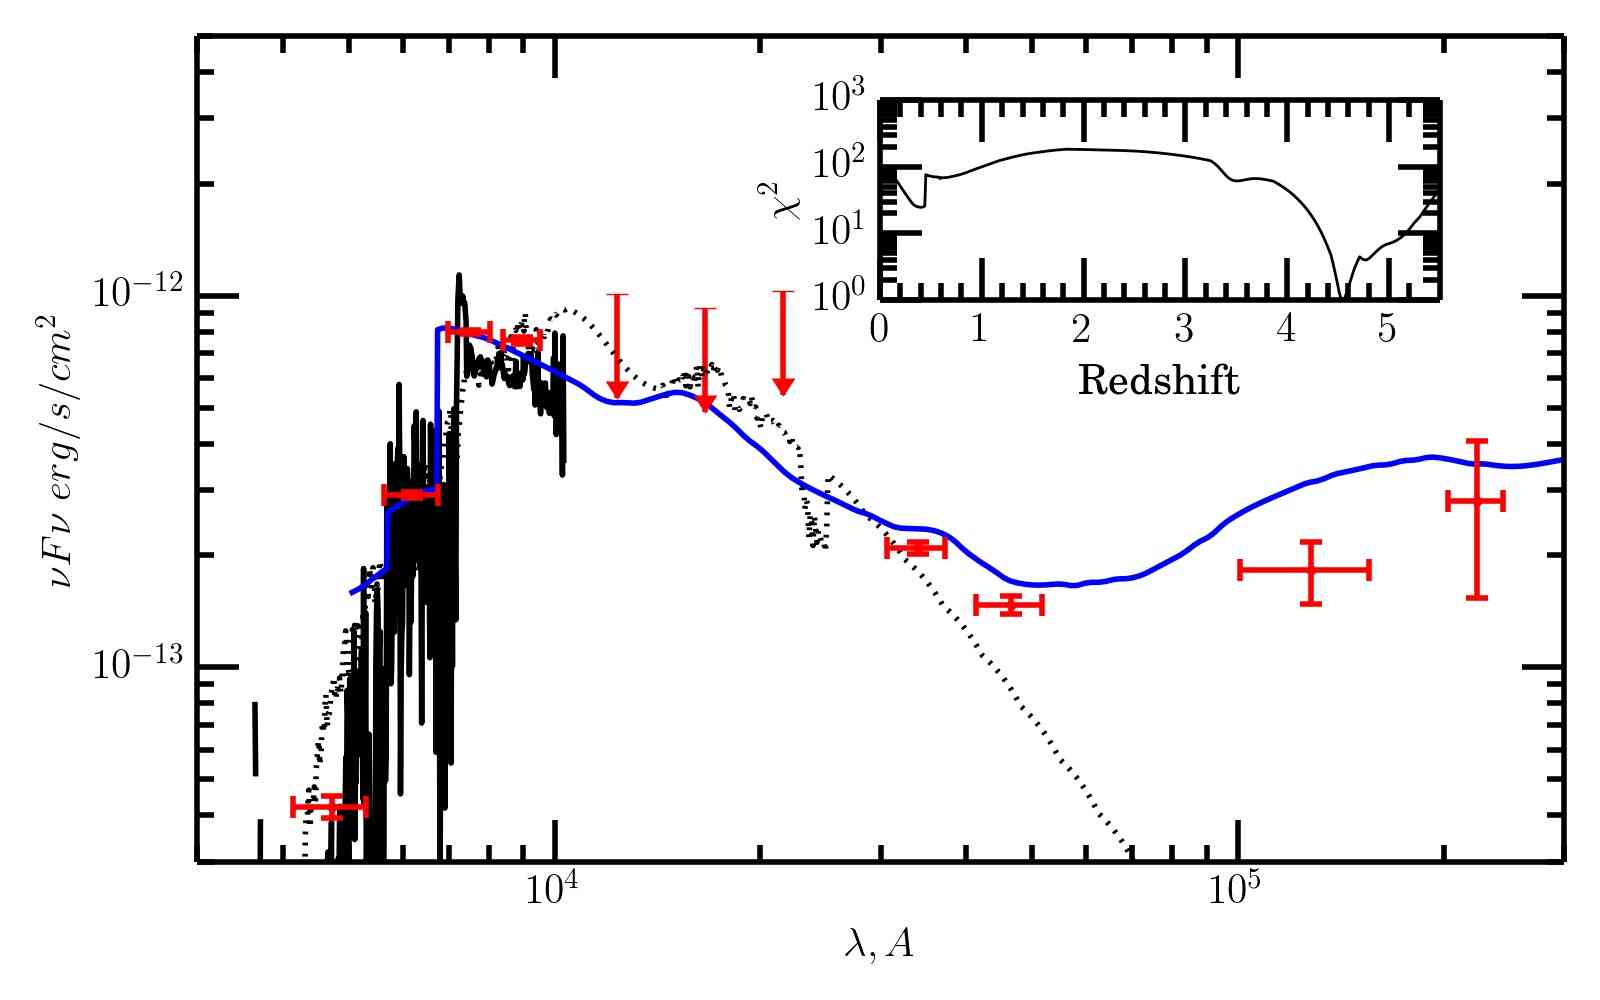
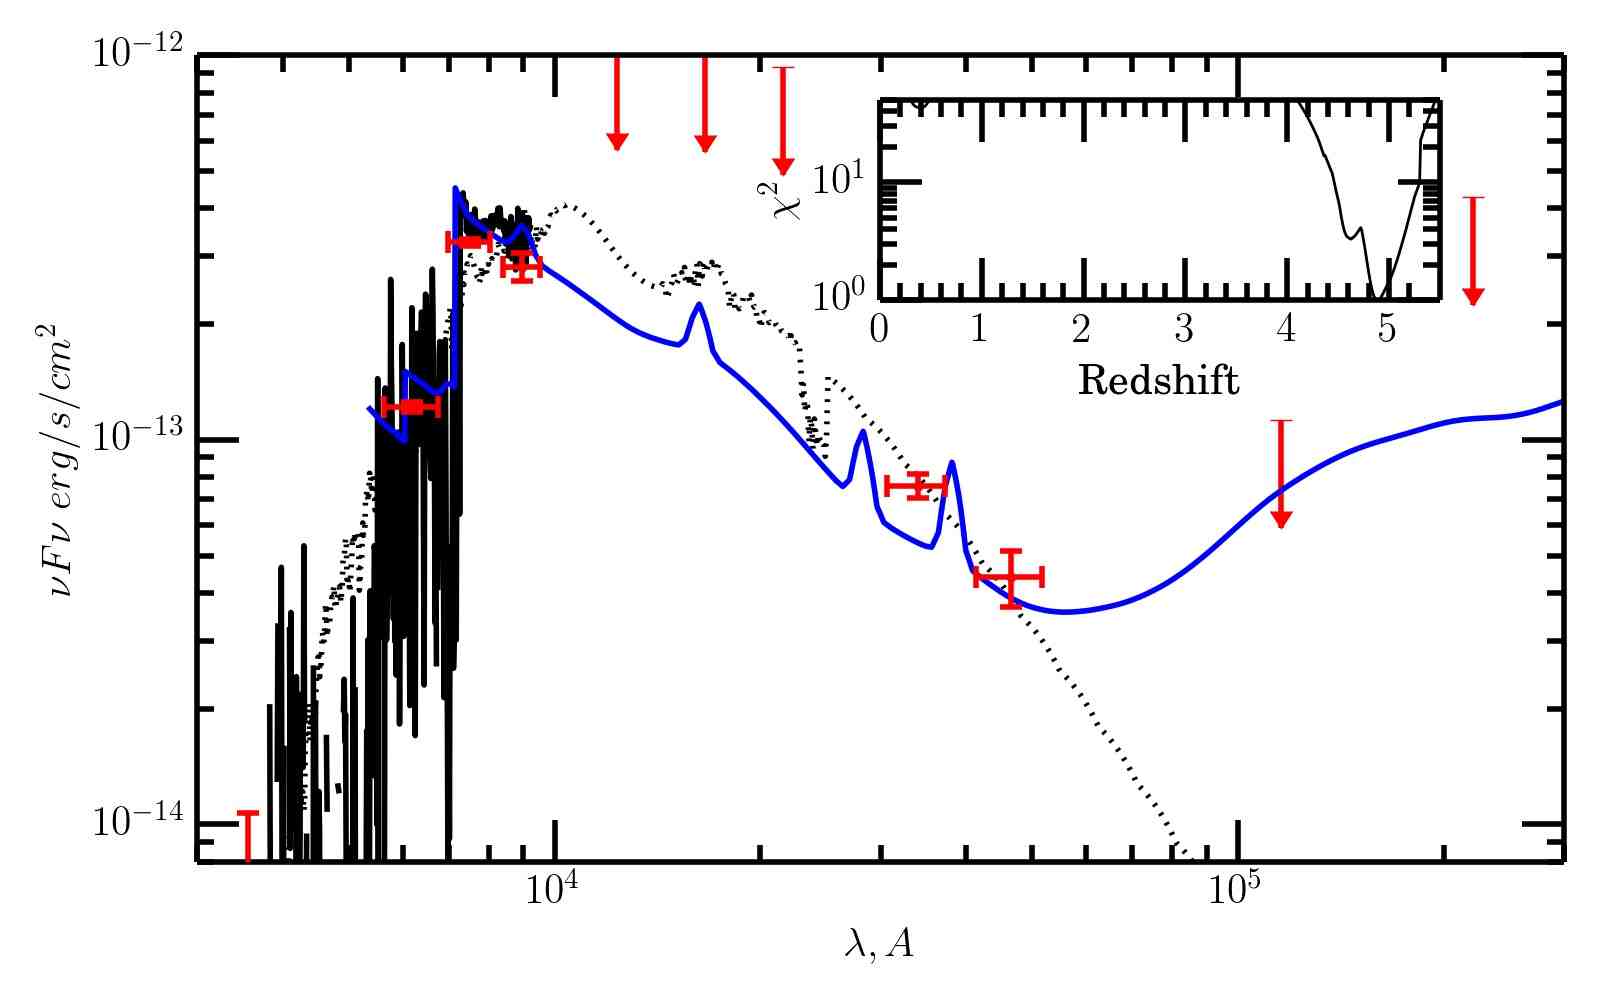
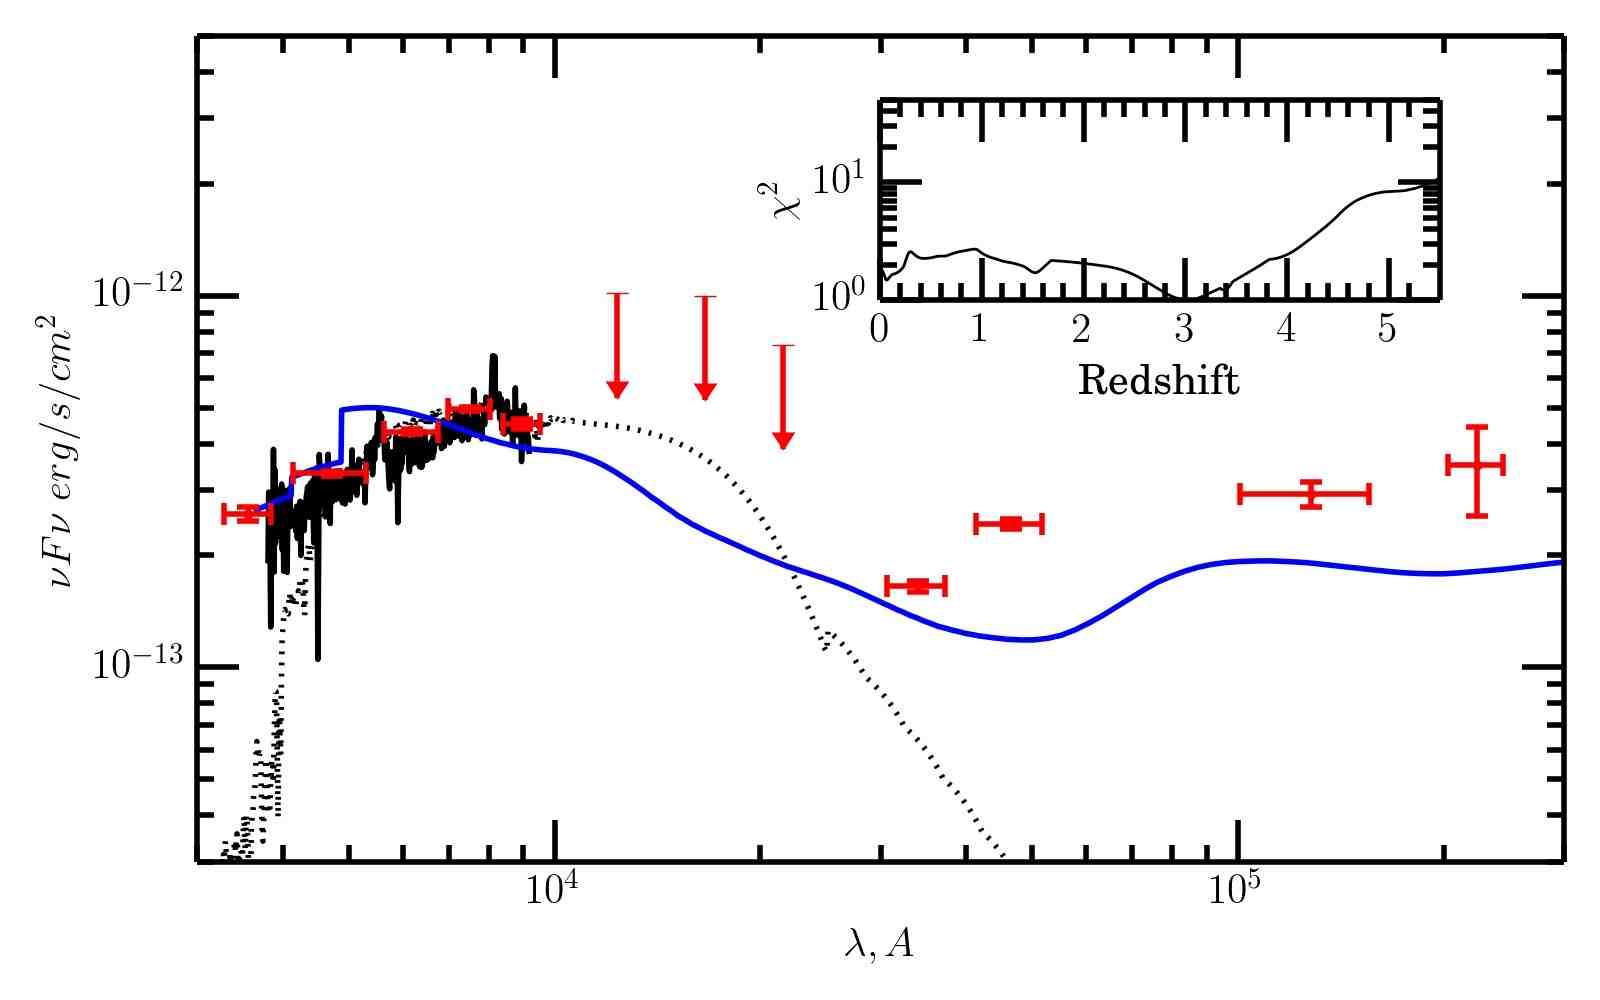
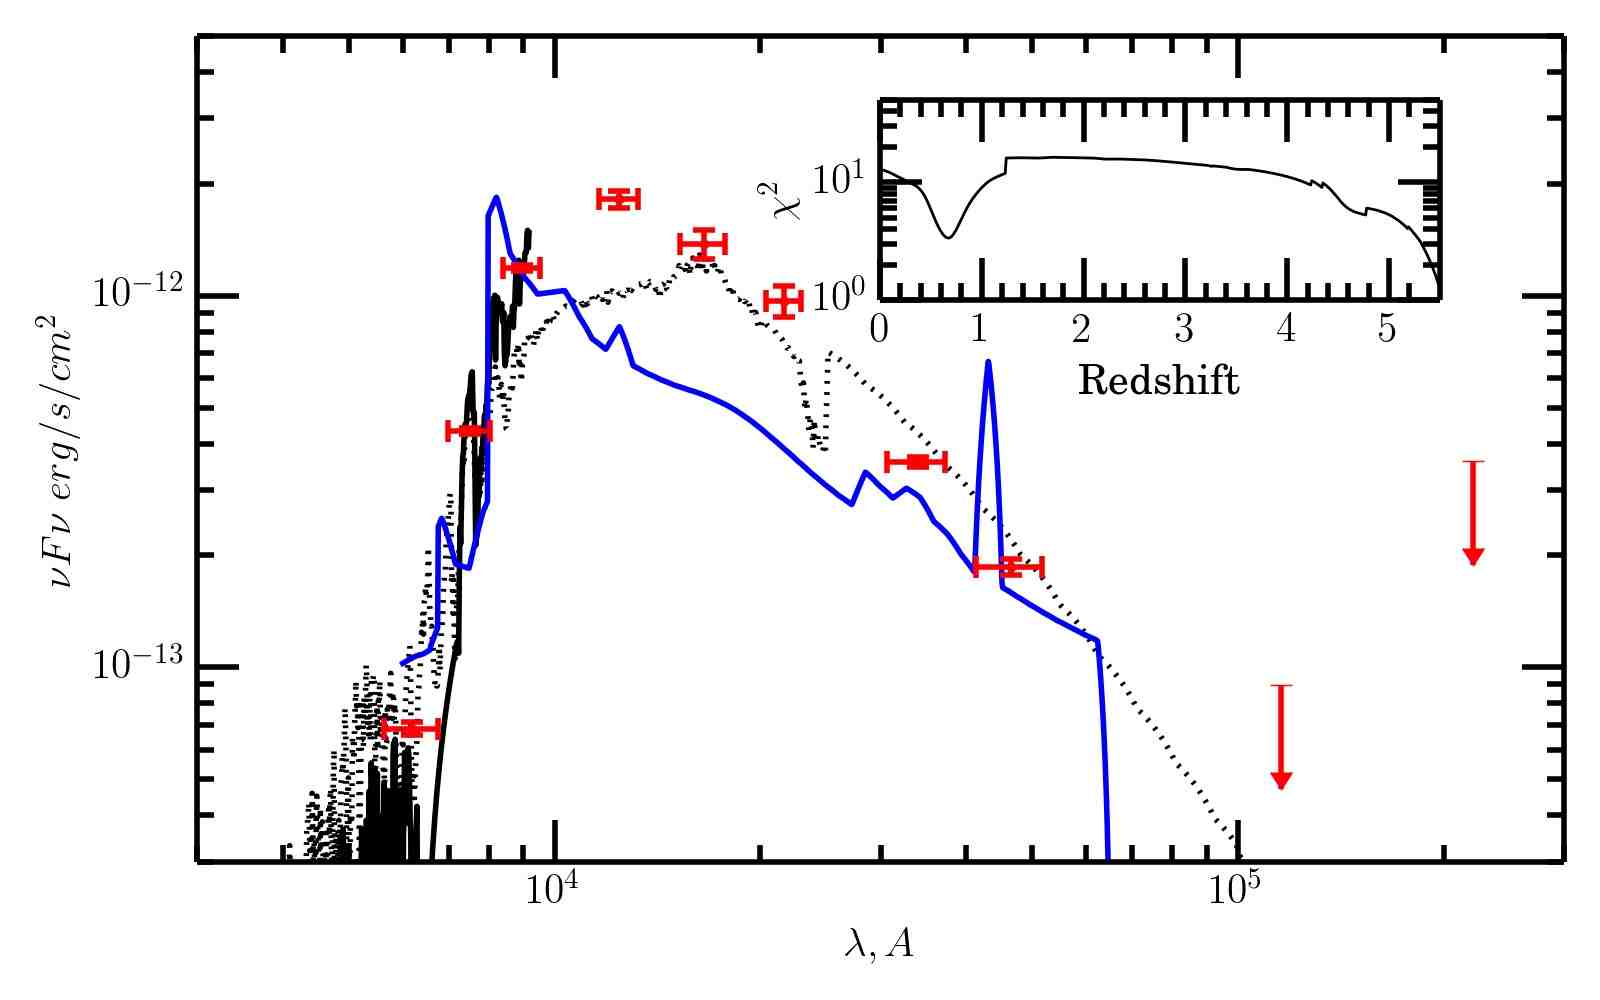
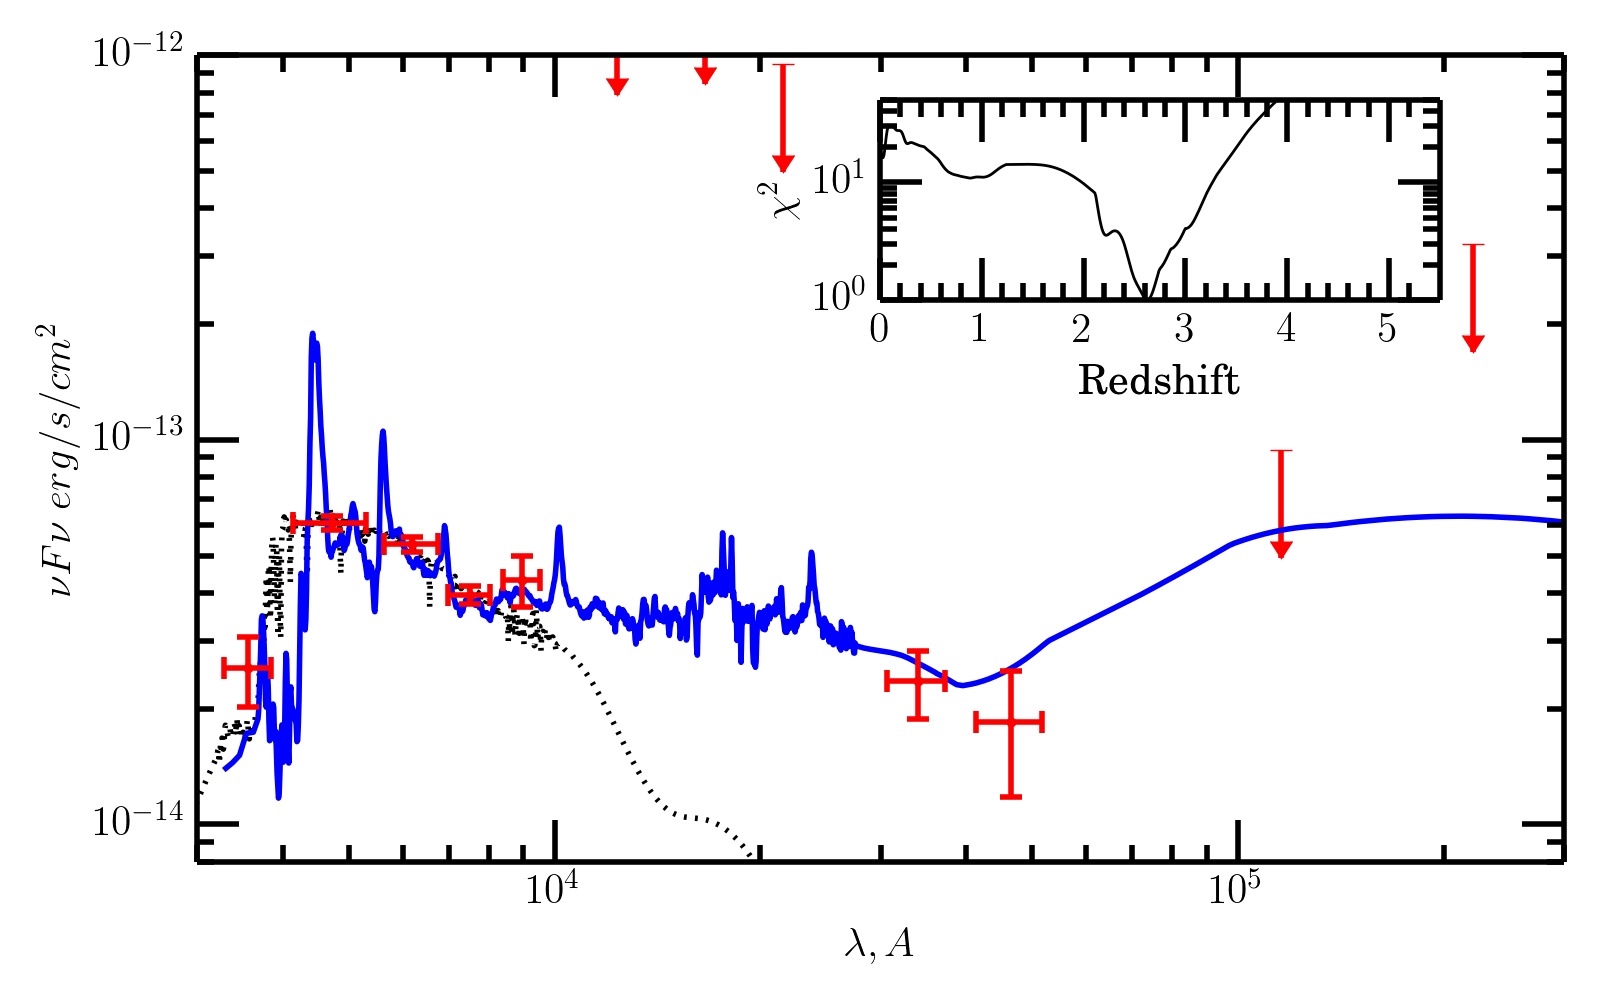
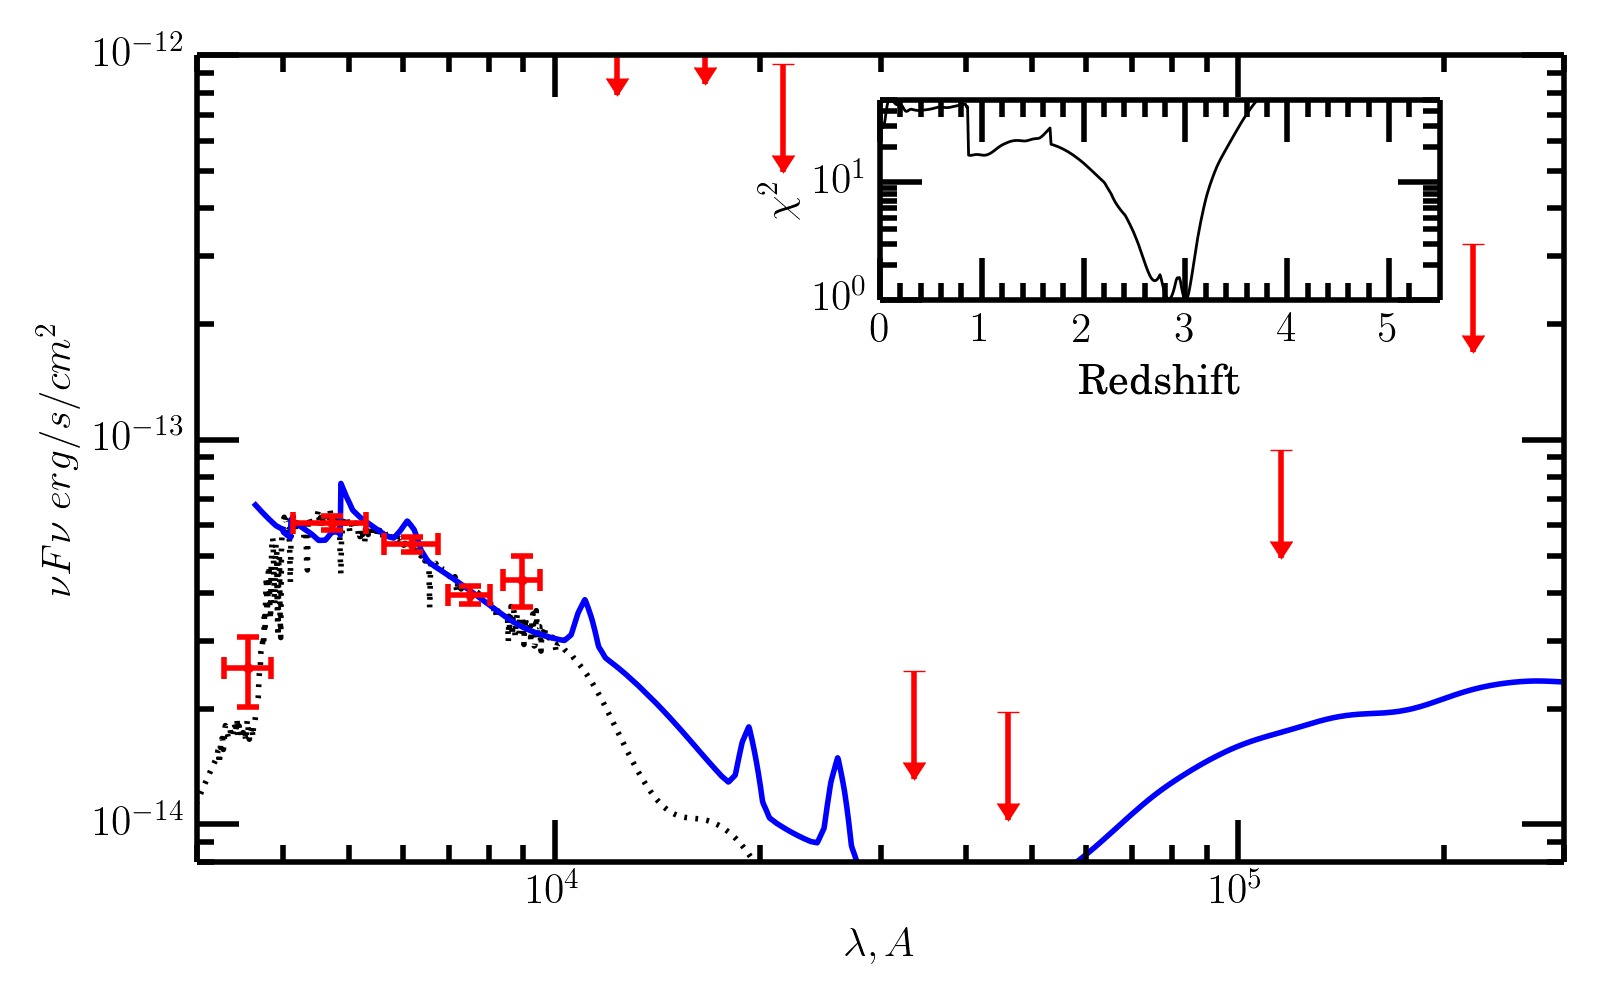
Figures 4 and 5 provide several examples of photometric data fitting by quasar and star templates for known quasars (for which is available) or stars. Figures 4 and 5 present, respectively, the cases where one of the quasar spectral templates describes well the photometric data points and gives a nearly correct estimate of and where quasar template fitting leads to a misidentification and gives an unreliable estimate of . The corresponding . distributions are shown in the insets.
The objects 3XMM J151147.1071406 (), 3XMM J001115.2144601 (), and 3XMM J004054.6091527 () are examples where the photometric redshift estimation method works well. In this case, the signal detection in infrared filters guarantees that the object is not a star.
The object 3XMM J153322.7324351 is an ex- ample of a poor redshift determination: . The true value measured in the SDSS is .
The object 3XMM J080630.4+153241 is an M- type star. It was not included in our catalog of quasar candidates, because >0.6 and for this object. If an object with a similar color relation is fainter by two apparent magnitudes, i.e., near the SDSS detection threshold, then the sensitivity of the WISE and 2MASS surveys will be insufficient for its detection. In that case, the star and quasar templates will describe the SDSS photometric data points with comparable values, and the star may be mistaken for a quasar at . Nevertheless, many of such objects can be eliminated using the photometric constraints (2).
The object 3XMM J094109.9+344902 lies at . There is a WISE source more than 2 arcsec away from the SDSS source. Two photometric redshift estimates were made for this object: by taking into account the fluxes measured in WISE and 2MASS filters and using these values only as upper limits on the infrared flux (see above). In the former case, (template 12 was used in fitting) and the object does not enter into the catalog of quasar candidates, because <2.75. In the latter case, (template 1 was used) and, as a result, the object enters into the catalog. Such cases degrade the catalog purity.

4 THE CATALOG AND ITS PROPERTIES
According to the selection rules described above, we compiled a catalog of 903 candidates for quasars at . These include 21 3XMM-DR4 pointing targets. The catalog is presented in the Appendix in the form of a table where the coordinates, X-ray fluxes, photometric and spectroscopic (if available) redshifts, the best quasar and star templates are given. The properties of the catalog and its spectroscopic subsample are reflected in Fig. 6.
The objects in the catalog mostly have photomet- ric redshifts . The objects have following distributions by : 381 at ; 60 at ; 2 at .
The catalog contains 515 known quasars with reliably measured ; 266 of them have >3. The photometry for these 515 objects is described by the template of a quasar at and “passes” according to the selection criteria (see above). However, 63 known quasars with >3 (Flesch, 2015; Alam et al., 2015) did not satisfy the selection criteria. Their list is given in a separate table in the Appendix. Their photometric data points are most often better described (with smaller ) by the star template or the template of a quasar at lower z. Some of the objects with >3 in the SDSS are classified as extended sources. No reliable spectroscopic redshift measurements are available for 388 distant quasar candidates.
The median X-ray flux for the objects from the catalog (903 sources) is erg s-1 cm-2 in the 0.5–2 keV energy band. All sources with fluxes above erg s-1 cm-2 have spectroscopic redshifts. Because of the constraint on the error in the z′ SDSS magnitude and the requirement <0.6, most of our objects turn out to be brighter than magnitude 21.5 in the SDSS filter.
Thus, our catalog of candidates for distant quasars can (as a result of the subsequent spectroscopic testing) lead to a noticeable (up to a factor of 1.5) increase in the number of known X-ray quasars at >3 relative to the already existing spectroscopic sample (in the same sky fields).
5 THE PHOTOMETRIC REDSHIFT ACCURACY, THE CATALOG COMPLETENESS AND PURITY
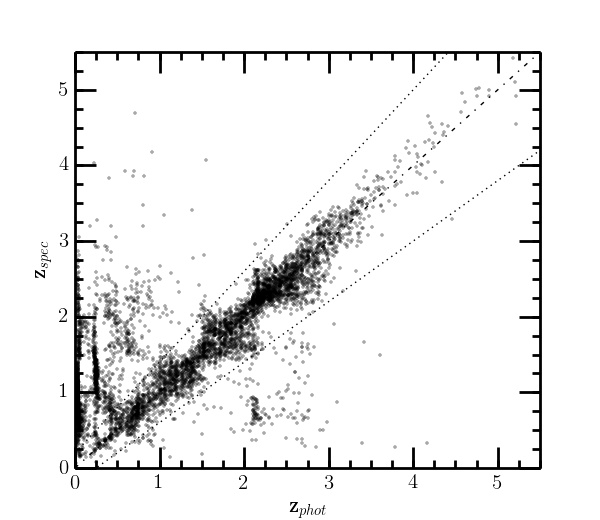
The accuracy of the photometric estimates for distant quasar candidates can be investigated based on a sample of 329 quasars with known spectro- scopic redshifts >3 (Fig. 7) It is convenient to estimate the scatter of relative to (see, e.g., Hoaglin \etalr 1983, Salvato et al. 2009) via the normalized median absolute deviation of :
| (4) |
In our case (for quasars with known >3), =0.07. In this case, the percentage of outliers, the fraction of objects with >0.2 3 turns out to be =9%.
Note that the standard confidence intervals for the EAZY photometric redshift were underestimated (Dahlen et al., 2013; Hildebrandt et al., 2008). Only for about of 30% the objects from our sample do the spectroscopic redshifts lie within the 2 error in (determined in a standard way from the change in near its minimum). Therefore, we will use only in discussing the photometric redshift accuracy.
As regards the completeness of our catalog of distant quasar candidates, to a first approximation, it can also be estimated based on the spectroscopic sample of 329 known quasar at >3. For this purpose, consider the ratio of the number of objects from this sample for which a good photometric redshift estimate was obtained, , to the total number of objects from the spectroscopic sample at a given .
The catalog completeness estimated in this way is about 80% (the blue solid line in Fig. 8).

However, it is clear that this estimate cannot be deemed quite reliable, because the spectroscopic sample used was compiled only from optical data and can differ significantly in its properties from the X-ray quasar sample. Indeed, in our catalog, which was compiled on the basis of an X-ray survey, there are much more objects per unit sky area, some of which can be quasars at > 3. Moreover, in estimating the completeness with respect to all X-ray quasars (at a given X-ray flux), we should also take into account the objects that are seen as X-ray sources in the 3XMM-DR4 survey but are too faint in the optical band and, therefore, enter neither into our catalog nor into the spectroscopic sample. To take into account all these possibilities requires performing the corresponding simulations of the quasar population, which we are going to do later on.
It will be possible to investigate the catalog purity, i.e., the ratio of the number of true quasars at to the number of all objects in the catalog, later on by performing spectroscopic observations of a representative subsample of objects from our catalog. By considering the ratio of the number of quasars from the spectroscopic sample that entered into our catalog to the number of all objects in the catalog, we can obtain a lower limit on the purity of our catalog, which is indicated in Fig. 8 by the red dashed line.
6 THE X-RAY SURVEY AREA AND THE – CURVE
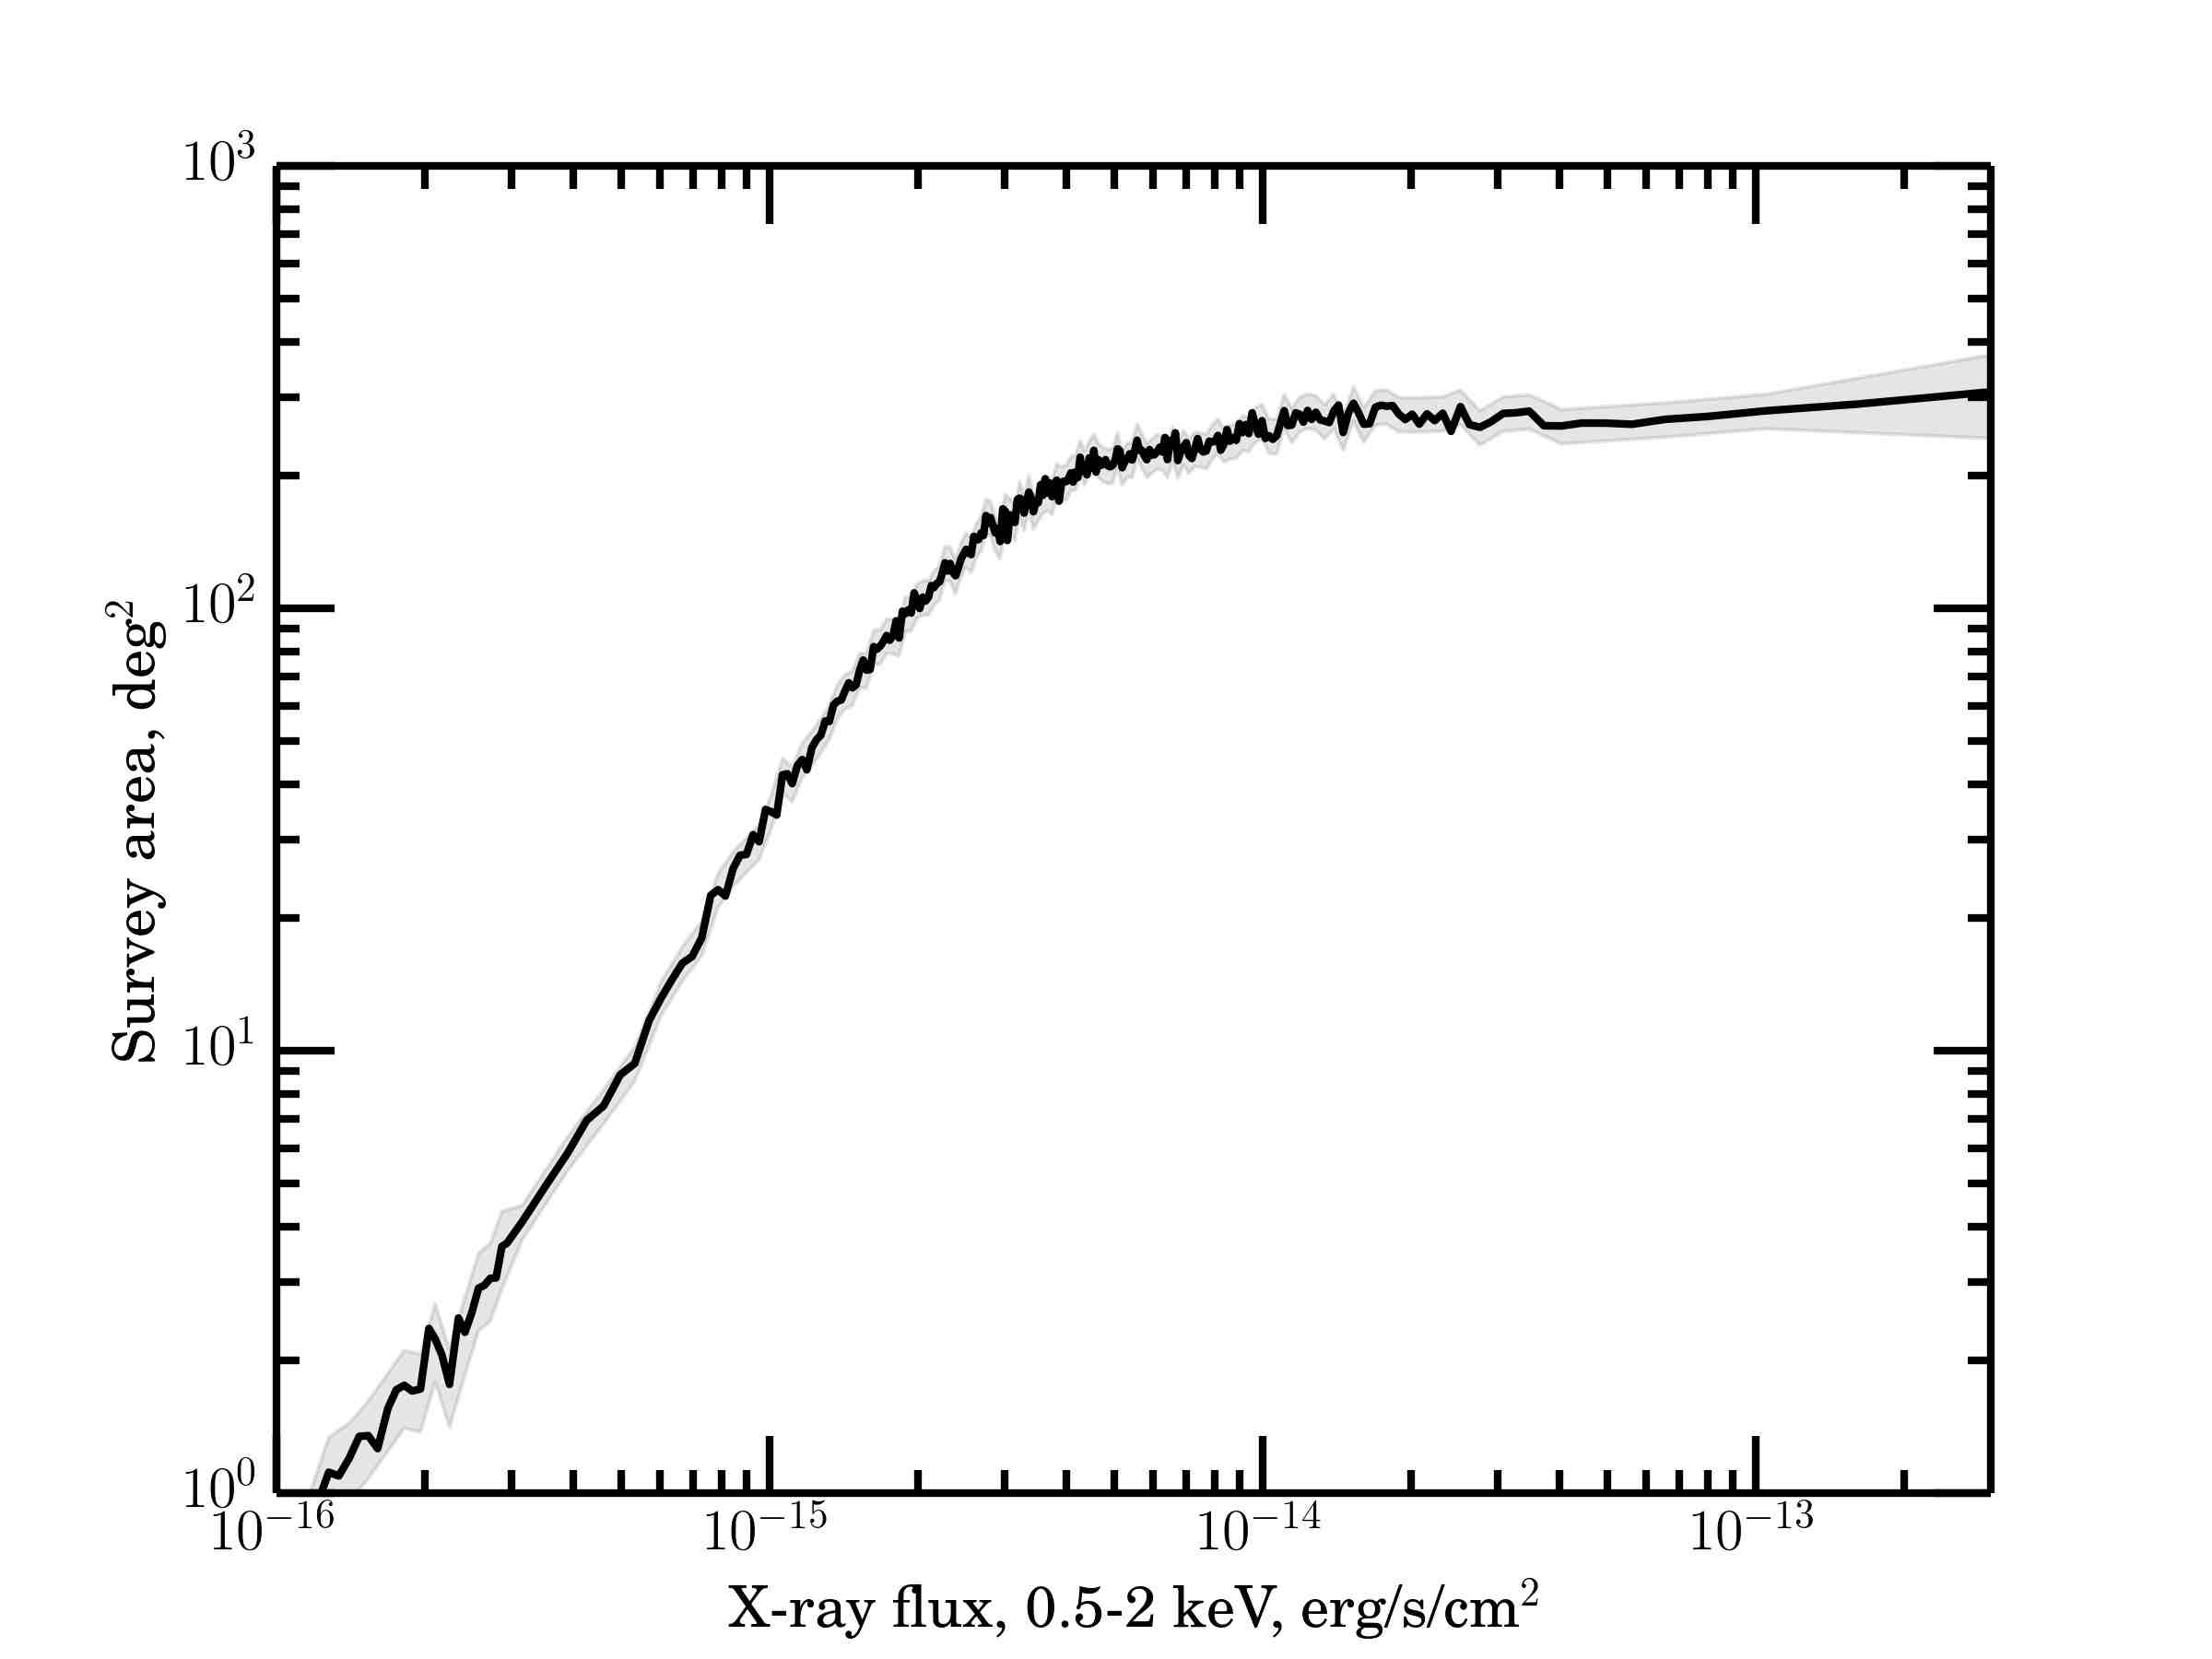
The total geometric area of the overlap between the 3XMM-DR4 X-ray survey and the photometric SDSS is about 300 deg2 at Galactic latitudes . The survey area as a function of the X-ray flux can be estimated as the ratio of the total number of 3XMM-DR4 X-ray sources in SDSS fields with an X-ray flux above a given one to the expected density of such sources in the sky. The expected density of sources at a given flux was calculated using the approximation from Mateos et al. (2008), where the statistics of XMM-Newton sources on a total area of 132 deg2 at high Galactic latitudes, , was analyzed in detail. The area estimate obtained in this way is presented in Fig. 9.
Using this estimate of the survey area as a function of the X-ray flux, we can construct the – curve for quasar candidates at . To take into account the fact that not all quasars at among the 3XMM-DR4 X-ray sources are also seen in the optical SDSS images, the – curve can be properly corrected. For this purpose, we can use the estimate of the fraction of X-ray quasars at having SDSS photometry at a given X-ray flux that was discussed above (see Fig. 1). The – curve for quasars at was constructed as follows:
| (5) |
with the corresponding error being
| (6) |
where is the survey area at flux , is the fraction of X-ray quasars at , that have SDSS photometry, and the summation is over -sources with fluxes .
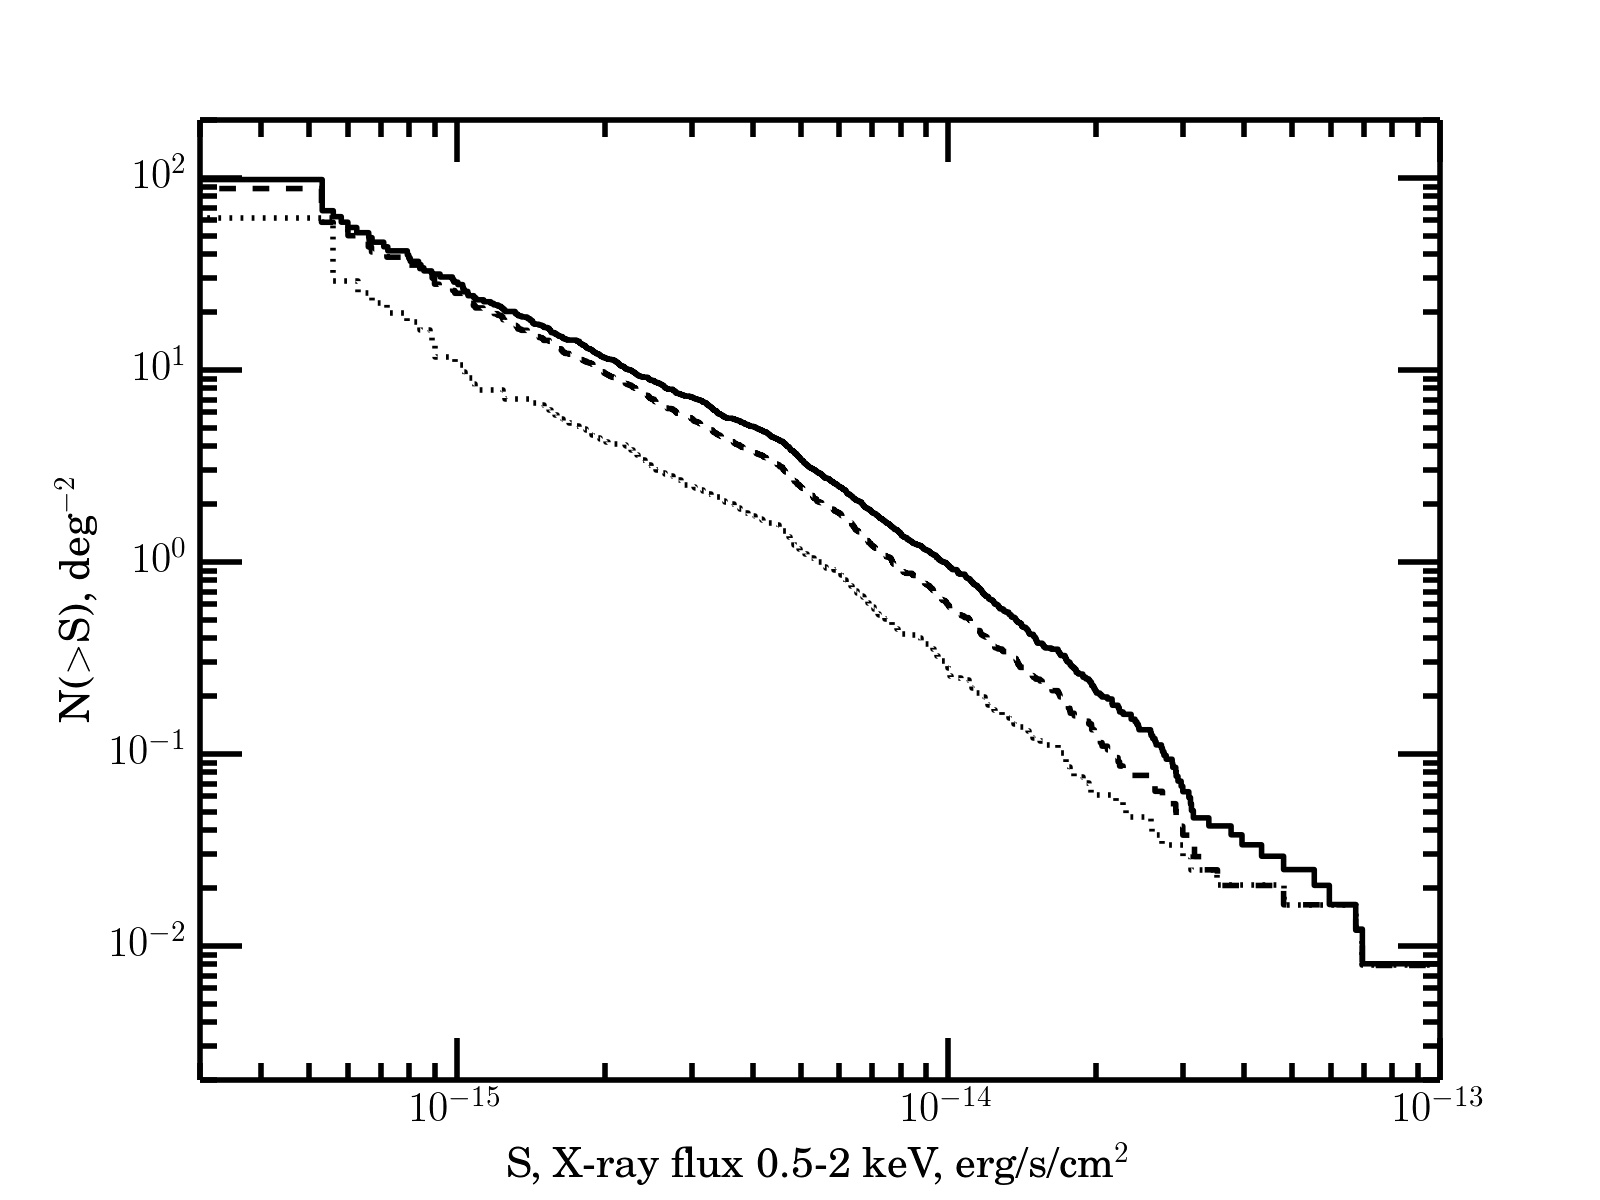
The – curve constructed from all objects in our catalog is indicated in Fig. 10 by the black solid line. However, this curve actually does not reflect the true distribution of quasars at in X-ray flux, because quite a few objects with redshifts entered into our catalog and 63 quasars with . were missed. Therefore, Fig. 10 shows two more – curves: only for the sources with (dotted lines) and for the sources that do not have either the spectrum or (dashed line). The true – curve must lie between these two curves.
7 CONCLUSIONS
We searched for quasar candidates at in the 3XMM-DR4 catalog of X-ray sources using a photometry of SDSS, 2MASS, WISE. A catalog of 903 candidates for quasars with photometric redshifts >2.75 was compiled.
Note that several catalogs of candidates for quasars with photometric redshift estimates have already been produced previously based on data from the photometric SDSS catalog (see, e.g., Bovy \etalr (2012); Richards et al. (2009)), and WISE data have also been used in their recent paper by DiPompeo (2015). Our quasar selection method differs fundamentally in that the selection results (the density of quasars in the sky) can be presented in the form of a dependence on the X-ray flux, which is important for the subsequent construction of the X-ray luminosity function. A preliminary comparison showed that our sample of candidates for quasars at is essentially identical (in the sky fields we investigated) to the sample from DiPompeo (2015). However, there are significant discrepancies between the samples at 4 whose degree and cause are to be investigated in a subsequent work.
Preliminary estimates of the selection quality using the SDSS DR12 catalog of spectroscopic redshifts (supplemented by quasars from the catalog published recently by Flesch (2015)) для рентгеновских источников XMM-Newton X-ray sources (3XMM-DR4) showed that the completeness of our sample is about 80% and its purity is at least 50%. However, these estimates are not quite reliable and must be checked in future through simulations of the quasar population and using optical observations of objects from this sample.
The accuracy of the photometric redshift estimates is =0.07 with 9% of outliers. This accuracy is comparable to other similar measurements based on photometric SDSS data (see, e.g., Kitsionas et al., 2005). Such an accuracy is sufficient to measure the luminosity function. We are going to perform these measurements in our next work.
About half of the bright objects in our sample have measured redshifts. The objects in our sample have apparent magnitudes . We began the spectroscopic observations of the remaining objects from this sample with the 6-m telescope at the Special Astrophysical Observatory of the Russian Academy of Sciences and with the 1.6-m telescope at the Sayan Observatory of the Institute of Solar– Terrestrial Physics, the Siberian Branch of the Russian Academy of Sciences, where a new medium- and low-resolution spectrograph well suited for such observations was installed (Burenin et al., 2016) These observations not only will allow the sample quality to be estimated but also will probably allow a large number of quasars at 3 to be confirmed, which, in turn, will make it possible to measure more accurately the X-ray luminosity function for quasars.
It will be possible to apply the high-redshift quasar selection algorithms tested in our paper to select such objects among the X-ray sources of the SRG all-sky survey. As can be seen, in particular, from the results of our paper, it will be possible to detect of the order of several tens of thousands of quasars at 3 < z < 6 in the SRG survey. This unique observational material will allow the growth history of supermassive black holes at the epoch of active galaxy formation to be studied in detail.
ACKNOWLEDGMENTS
This study was supported by the Russian Science Foundation (project no. 14-22-00271). We would like to thank V. Astakhov for translation of the paper in English. The electronic version of the article’s tables is available 333http://adsabs.harvard.edu/abs/2016yCat..90420313K at the VizieR catalogue access tool, CDS, Strasbourg, France (Ochsenbein et al., 2000).
Список литературы
- Ahn et al. (2012)
- [2] 203212012
- Aihara et al. (2011)
- [4] 193292011
- Aird et al. (2015)
- [6] [J. Aird, A. Coil, A. Georgakakis, K. Nandra, G. Barro, P. Perez-Gonzalez] 45118922015
- Alam et al. (2015)
- [8] 219122015
- Assef et al. (2010)
- [10] 7139702010
- Assef et al. (2011)
- [12] 728562011
- Van den Berk et al. (2011)
- [14] 1225492001
- Bovy \etalr (2012)
- [16] 749412012
- Brammer et al. (2008)
- [18] 68615032008
- Burenin et al. (2016)
- [20] 422952016
- Calzetti et al. (2000)
- [22] 5336822000
- Civano et al. (2012)
- [24] 201302012
- Civano et al. (2011)
- [26] 741912011
- Cutri et al. (2003)
- [28] 06http://adsabs.harvard.edu/abs/2003tmc..book…..C2003
- Dahlen et al. (2013)
- [30] 775932013
- DiPompeo (2015)
- [32] 4523122015
- Eisenstein et al. (2011)
- [34] 142722011
- Elvis et al. (2009)
- [36] 1841582009 \bibitemrusa[ flesch15a
- Flesch (2015)
- [38] 320102015; arXiv:1502.06303
- Gavignaud et al. (2006)
- [40] 457792006
- Hildebrandt et al. (2008)
- [42] 4807032008
- Hoaglin \etalr (1983)
- [44] Understanding Robust and Exploratory Data Analysis (Wiley Series in Probability and Mathematical Statistics), New York, 1983
- Ilbert et al. (2006)
- [46] 4578412006
- Kalfountzou et al. (2014)
- [48] 44514302014
- Kim et al. (2007)
- [50] 1694012007
- Kitsionas et al. (2005)
- [52] 4344752005
- Krawczyk et al. (2013)
- [54] 20642013
- Lasker et al. (1990)
- [56] 9920191990
- Lehmer et al. (2012)
- [58] 752462012
- Mateos et al. (2008)
- [60] 492512008
- Meshcheryakov et al. (2015)
- [62] 413072015
- Madau (1995)
- [64] 441181995
- Ochsenbein et al. (2000)
- [66] 143232000
- Pickles (1998)
- [68] 1108631998
- Polletta et al. (2007)
- [70] 663812007
- Wright et al. (2010)
- [72] 14018682010
- Richards et al. (2002)
- [74] 12329452002
- Richards et al. (2006)
- [76] 1664702006
- Richards et al. (2009)
- [78] 180672009
- Ross et al. (2012)
- [80] 19932012
- Ross et al. (2013)
- [82] 773142013
- Salvato et al. (2009)
- [84] 69012502009
- Simm et al. (2015)
- [86] 584A1062015
- Skrzypek et al. (2015)
- [88] 574782015
- Vanden Berk et al. (2001)
- [90] 1225492001
- Watson et al. (2009)
- [92] 4933392009
- Watson et al. (2013)
- [94] 2013
- Wu et al. (2012)
- [96] 144492012
Appendix
Catalog of candidates for quasars at 3<z<5.5. The table of redshifts.
| N | NAME 3XMM | SRCID | RA | DEC | F | F | FL | TQ | TS | NB | |||||
|---|---|---|---|---|---|---|---|---|---|---|---|---|---|---|---|
| (1) | (2) | (3) | (4) | (5) | (6) | (7) | (8) | (9) | (10) | (11) | (12) | (13) | (14) | (15) | (16) |
| ††NAME is the name in the 3XMM-DR4 (3XMMJ…), SRCID is the unique X-ray source number in the 3XMM-DR4, RA is the right ascension and DEC is the declination in degrees in the 3XMM-DR4, F and F are the 0.5–2 keV flux and its error ( erg/s/cm2), is the apparent magnitude in the SDSS (AB, PSF), is the apparent magnitude in the SDSS filter (AB, PSF), is the spectroscopic redshift, is the number of the reference to the paper with published (0 — SDSS DR12, the zWarning flag is given in parentheses; 1 — the catalog of X-ray sources by Flesch (2015)the number of the data source from Flesch (2015) is given in parentheses), is the photometric redshift, FL is the data flag (D — there is another optical source within the 2 position error of the XMM X-ray source; w — the estimates were obtained only from the SDSS photometry, although there is a WISE source nearby; t — the XMM pointing target XMM, r — the star template describes the photometry better than does the quasar template (), TQ is the template number from the quasar library, TS is the star template (Pickles 1998) with the smallest , NB — число фотометрических полос, используемых при аппроксимации. NB is the number of photometric bands used in fitting. | |||||||||||||||
| 1 | J000335.5061112 | 119255 | 0.8981 | 6.1869 | 2.851 | 0.205 | 19.25 | 19.00 | 2.8569 | 0(0) | 3.05 | 4 | f8i | 7 | |
| 2 | J000303.7+020416 | 119783 | 0.7655 | 2.0714 | 1.295 | 0.211 | 20.76 | 20.33 | 2.9469 | 0(0) | 3.02 | 12 | g0iii | 8 | |
| 3 | J000444.2+020801 | 117610 | 1.1846 | 2.1337 | 0.573 | 0.229 | 20.95 | 20.69 | 2.6655 | 0(0) | 2.80 | 1 | a7v | 5 | |
| 4 | J000531.3+000840 | 117756 | 1.3806 | 0.1445 | 0.963 | 0.281 | 20.99 | 20.58 | 2.8480 | 0(0) | 2.80 | 7 | f5iii | 7 | |
| 5 | J000443.6084036 | 117599 | 1.1820 | 8.6767 | 0.944 | 0.323 | 20.30 | 20.12 | 3.85 | 3 | k3i | 5 | |||
| 6 | J000511.6084201 | 117868 | 1.2986 | 8.7005 | 0.498 | 0.185 | 19.64 | 19.64 | 3.2059 | 0(0) | 3.30 | 1 | f8i | 7 | |
| 7 | J000533.7084825 | 117722 | 1.3908 | 8.8071 | 0.577 | 0.232 | 19.24 | 19.46 | 2.82 | 7 | f8iv | 8 | |||
| 8 | J000618.1084410 | 117240 | 1.5757 | 8.7362 | 0.872 | 0.433 | 20.45 | 20.57 | 3.3234 | 0(0) | 3.15 | 7 | g0i | 7 | |
| 9 | J000942.5+125251 | 118363 | 2.4272 | 12.8811 | 3.149 | 0.528 | 20.21 | 20.03 | 2.3926 | 0(0) | 2.82 | 3 | g8v | 7 | |
| 10 | J001033.5+105231 | 118456 | 2.6398 | 10.8755 | 1.171 | 0.416 | 20.91 | 20.48 | 2.9202 | 0(0) | 2.93 | 3 | rk0v | 7 | |
| 11 | J001037.5+105526 | 118489 | 2.6565 | 10.9239 | 1.463 | 0.406 | 20.25 | 20.04 | 2.6765 | 0(0) | 2.81 | 1 | f2v | 5 | |
| 12 | J001115.2+144601 | 117909 | 2.8135 | 14.7671 | 10.810 | 0.299 | 18.28 | 18.10 | 4.9643 | 0(0) | 4.54 | t | 5 | m2i | 9 |
| 13 | J001340.4+054554 | 121657 | 3.4183 | 5.7651 | 0.927 | 0.213 | 19.95 | 19.85 | 2.7123 | 0(0) | 2.97 | 1 | f2iii | 7 | |
| 14 | J001504.7+171517 | 121325 | 3.7700 | 17.2549 | 0.160 | 0.069 | 20.63 | 20.70 | 3.1627 | 0(0) | 2.84 | 7 | f6v | 5 | |
| 15 | J001756.7+163007 | 122306 | 4.4864 | 16.5021 | 0.183 | 0.070 | 20.29 | 20.29 | 3.5487 | 0(0) | 3.83 | 1 | k3iii | 6 | |
| 16 | J001920.9+163209 | 122068 | 4.8372 | 16.5359 | 0.859 | 0.167 | 19.04 | 19.00 | 2.96 | 1 | f6v | 8 | |||
| 17 | J001754.1+161406 | 122310 | 4.4755 | 16.2350 | 0.465 | 0.136 | 20.81 | 20.45 | 2.87 | 3 | wg5iii | 8 | |||
| 18 | J002015.9+214914 | 121995 | 5.0664 | 21.8208 | 0.346 | 0.120 | 19.72 | 19.51 | 3.03 | 12 | k3iii | 9 | |||
| 19 | J002159.9083503 | 120127 | 5.4996 | 8.5843 | 0.236 | 0.092 | 20.78 | 20.72 | 2.84 | 12 | rf6v | 9 | |||
| 20 | J002127.3020333 | 120370 | 5.3640 | 2.0593 | 1.829 | 0.154 | 17.00 | 16.90 | 2.596 | 1(824) | 2.77 | t | 1 | wf5v | 12 |
| 21 | J002150.6150427 | 119878 | 5.4611 | 15.0742 | 0.189 | 0.047 | 21.31 | 20.72 | 2.79 | 7 | f5iii | 5 | |||
| 22 | J002208.0150540 | 120066 | 5.5334 | 15.0945 | 1.635 | 0.103 | 18.80 | 18.58 | 4.52 | 1(401) | 4.40 | t | 4 | m2i | 7 |
| 23 | J002244.4+013250 | 121123 | 5.6854 | 1.5474 | 0.915 | 0.105 | 19.51 | 19.38 | 2.9823 | 0(0) | 2.76 | 2 | f8iv | 7 | |
| 24 | J002527.5+105118 | 120782 | 6.3648 | 10.8553 | 0.337 | 0.157 | 19.63 | 19.33 | 3.13 | 3 | rk0iii | 8 | |||
| 25 | J002630.2+165656 | 113930 | 6.6259 | 16.9490 | 1.510 | 0.196 | 20.23 | 19.97 | 2.8593 | 0(0) | 2.86 | 4 | f5i | 7 | |
| 26 | J002726.4+170730 | 113471 | 6.8602 | 17.1251 | 0.377 | 0.091 | 20.05 | 20.17 | 3.8857 | 0(0) | 4.02 | 1 | k2i | 5 | |
| 27 | J002706.9+261559 | 113871 | 6.7791 | 26.2666 | 0.943 | 0.376 | 20.32 | 19.82 | 3.29 | 12 | rk4iii | 8 | |||
| 28 | J003027.7+261355 | 19579 | 7.6157 | 26.2324 | 0.239 | 0.044 | 19.78 | 19.93 | 3.2136 | 0(0) | 3.11 | 7 | g0i | 8 | |
| 29 | J003057.9+261744 | 16416 | 7.7415 | 26.2956 | 0.900 | 0.076 | 20.45 | 20.02 | 3.01 | 3 | wg5iii | 7 | |||
| 887 | J233329.9+152539 | 237875 | 353.3750 | 15.4276 | 0.426 | 0.155 | 19.00 | 18.84 | 3.6508 | 0(0) | 3.56 | 5 | rk3iii | 8 | |
| 888 | J233633.9+210442 | 238644 | 354.1413 | 21.0784 | 0.220 | 0.063 | 21.05 | 20.50 | 2.98 | 3 | g8v | 8 | |||
| 889 | J233641.2+211955 | 238680 | 354.1717 | 21.3322 | 0.365 | 0.095 | 20.17 | 20.14 | 2.92 | 3 | g8v | 8 | |||
| 890 | J234214.1+303606 | 237645 | 355.5590 | 30.6017 | 0.799 | 0.203 | 19.92 | 19.79 | 3.20 | wD | 2 | wk2iii | 5 | ||
| 891 | J234309.6+001325 | 237594 | 355.7901 | 0.2239 | 0.470 | 0.110 | 20.59 | 20.83 | 2.8240 | 0(0) | 2.96 | 9 | f5i | 5 | |
| 892 | J234448.7042651 | 241540 | 356.2031 | 4.4475 | 0.197 | 0.132 | 18.59 | 18.44 | 2.88 | D | 3 | rg5iii | 9 | ||
| 893 | J234455.3+092444 | 241510 | 356.2304 | 9.4125 | 0.163 | 0.143 | 20.79 | 20.85 | 3.18 | D | 12 | rg5iii | 7 | ||
| 894 | J234752.5+010306 | 242170 | 356.9688 | 1.0518 | 0.446 | 0.164 | 20.62 | 20.46 | 2.4114 | 0(0) | 2.86 | 12 | g0v | 8 | |
| 895 | J234916.0+020722 | 241813 | 357.3167 | 2.1230 | 0.732 | 0.208 | 20.87 | 20.59 | 2.6551 | 0(0) | 2.77 | 4 | f0iii | 5 | |
| 896 | J234956.8+363237 | 239836 | 357.4871 | 36.5437 | 0.548 | 0.203 | 19.55 | 19.40 | 2.92 | 3 | wg8iii | 8 | |||
| 897 | J235054.6+200939 | 239972 | 357.7276 | 20.1609 | 1.000 | 0.121 | 18.49 | 18.47 | 3.1629 | 0(0) | 2.88 | 6 | f8i | 12 | |
| 898 | J235201.3+200901 | 239304 | 358.0055 | 20.1506 | 1.163 | 0.151 | 18.37 | 18.33 | 3.0794 | 0(0) | 3.09 | 1 | g0iii | 11 | |
| 899 | J235101.0+203504 | 240044 | 357.7544 | 20.5847 | 0.530 | 0.137 | 19.99 | 19.95 | 2.80 | 5 | g0iv | 8 | |||
| 900 | J235111.2+202016 | 239889 | 357.7970 | 20.3378 | 0.996 | 0.358 | 20.11 | 19.86 | 2.329 | 0(0) | 2.76 | 1 | f02iv | 7 | |
| 901 | J235435.5101513 | 239560 | 358.6481 | 10.2537 | 1.159 | 0.232 | 19.30 | 19.19 | 3.1203 | 0(0) | 2.97 | 1 | f5v | 7 | |
| 902 | J235502.9+060825 | 240542 | 358.7623 | 6.1405 | 1.497 | 0.408 | 19.04 | 18.80 | 2.7077 | 0(0) | 2.79 | 7 | f8i | 8 | |
| 903 | J235555.9+055933 | 240529 | 358.9831 | 5.9926 | 0.344 | 0.121 | 20.22 | 20.14 | 3.35 | 2 | wk2iii | 8 |
Known quasars with >3 from the 3XMM-DR4 catalog that did not enter into our catalog of candidates
| N | NAME 3XMM | SRCID | RA | DEC | F | F | FL | TQ | TS | NB | |||||
|---|---|---|---|---|---|---|---|---|---|---|---|---|---|---|---|
| (1) | (2) | (3) | (4) | (5) | (6) | (7) | (8) | (9) | (10) | (11) | (12) | (13) | (14) | (15) | (16) |
| 1 | J001049.0+290139 | 118405 | 2.7046 | 29.0277 | 0.275 | 0.192 | 20.23 | 20.18 | 3.370 | 0(0) | 3.18 | r | 5 | g2i | 5 |
| 2 | J002654.9+171944 | 113822 | 6.7289 | 17.3289 | 1.125 | 0.132 | 21.21 | 20.79 | 3.095 | 0(0) | 2.72 | 12 | f8i | 7 | |
| 3 | J005156.6+272847 | 128940 | 12.9862 | 27.4799 | 0.289 | 0.183 | 19.73 | 19.57 | 3.331 | 0(0) | 3.46 | r | 1 | g5iv | 7 |
| 4 | J011117.7+325832 | 44045 | 17.8243 | 32.9758 | 0.245 | 0.099 | 19.59 | 19.39 | 3.205 | 1(1411) | 0.69 | 13 | m5iii | 9 | |
| 5 | J011544.8+001513 | 125421 | 18.9371 | 0.2538 | 0.194 | 0.064 | 21.53 | 20.96 | 5.1 | 1(1245) | 0.61 | 14 | m4v | 7 | |
| 6 | J020231.1042246 | 43456 | 30.6301 | 4.3794 | 1.285 | 0.279 | 20.68 | 20.43 | 4.270 | 0(0) | 0.94 | G | 14 | m7iii | 9 |
| 7 | J020253.7065043 | 92295 | 30.7240 | 6.8453 | 0.155 | 0.083 | 20.69 | 20.34 | 3.866 | 0(0) | 0.79 | G | 13 | m5iii | 8 |
| 8 | J020702.2065233 | 96071 | 31.7593 | 6.8759 | 0.366 | 0.111 | 20.51 | 20.45 | 3.065 | 0(0) | 2.66 | 6 | f0iii | 7 | |
| 9 | J021338.6051615 | 20962 | 33.4110 | 5.2712 | 0.929 | 0.096 | 20.88 | 20.22 | 4.544 | 0(0) | 0.55 | 14 | m4iii | 7 | |
| 10 | J021343.2042042 | 107259 | 33.4301 | 4.3450 | 0.347 | 0.163 | 20.45 | 20.38 | 3.074 | 0(0) | 0.06 | 7 | m5iii | 7 | |
| 11 | J021504.1040704 | 107902 | 33.7671 | 4.1178 | 0.636 | 0.208 | 20.53 | 20.34 | 3.283 | 0(0) | 0.03 | 6 | f8i | 7 | |
| 12 | J022048.5033711 | 110418 | 35.2025 | 3.6197 | 0.564 | 0.180 | 21.42 | 20.61 | 3.116 | 0(0) | 2.71 | 12 | f8i | 7 | |
| 13 | J022251.7050713 | 103134 | 35.7157 | 5.1203 | 0.880 | 0.122 | 20.01 | 19.57 | 3.86 | 1(1758) | 0.67 | 13 | m3ii | 8 | |
| 14 | J022645.4043616 | 102470 | 36.6893 | 4.6046 | 0.726 | 0.152 | 18.45 | 17.89 | 3.295 | 1(559) | 0.49 | 14 | m3ii | 12 | |
| 15 | J022706.4041924 | 105904 | 36.7769 | 4.3235 | 0.392 | 0.100 | 20.65 | 20.60 | 3.285 | 1(650) | 2.90 | r | 3 | rg0v | 5 |
| 16 | J022849.6043946 | 106357 | 37.2069 | 4.6630 | 0.241 | 0.187 | 21.04 | 20.60 | 3.211 | 0(0) | 2.62 | 7 | f5i | 7 | |
| 17 | J023226.0053729 | 160738 | 38.1086 | 5.6248 | 0.532 | 0.258 | 18.83 | 18.60 | 4.564 | 0(0) | 0.28 | r | 14 | m2iii | 8 |
| 18 | J024923.6040206 | 163652 | 42.3484 | 4.0351 | 0.391 | 0.195 | 20.81 | 20.62 | 3.029 | 0(0) | 2.94 | r | 3 | g5v | 5 |
| 19 | J030222.0+000630 | 155293 | 45.5921 | 0.1085 | 0.708 | 0.072 | 20.65 | 20.50 | 3.306 | 0(0) | 0.03 | 13 | k0iii | 8 | |
| 20 | J030435.4000250 | 156232 | 46.1476 | 0.0474 | 0.605 | 0.241 | 20.41 | 20.16 | 3.055 | 0(0) | 0.03 | 13 | f8i | 8 | |
| 21 | J080334.9+391923 | 79784 | 120.8954 | 39.3232 | 0.348 | 0.151 | 20.37 | 20.29 | 3.011 | 0(0) | 2.67 | 7 | f5i | 7 | |
| 22 | J085026.7+630020 | 307591 | 132.6113 | 63.0057 | 0.647 | 0.195 | 18.36 | 18.23 | 3.363 | 0(0) | 3.08 | r | 1 | k3iii | 11 |
| 23 | J085809.3+274228 | 300636 | 134.5391 | 27.7080 | 0.246 | 0.052 | 20.39 | 20.48 | 3.464 | 0(0) | 3.10 | r | 3 | g8iv | 5 |
| 24 | J093521.2+612339 | 317819 | 143.8387 | 61.3943 | 0.693 | 0.101 | 20.04 | 20.12 | 4.042 | 0(0) | 0.30 | 14 | m2iii | 7 | |
| 25 | J094013.9+344628 | 321396 | 145.0579 | 34.7747 | 2.295 | 0.257 | 21.35 | 20.90 | 3.355 | 0(0) | 0.38 | 13 | rk4iii | 7 | |
| 26 | J094404.1+165056 | 322206 | 146.0174 | 16.8489 | 0.516 | 0.147 | 20.27 | 20.28 | 3.017 | 0(0) | 3.05 | r | 1 | f5iii | 5 |
| 27 | J095752.0+015119 | 313069 | 149.4669 | 1.8555 | 0.254 | 0.107 | 21.02 | 20.40 | 4.174 | 1(1886) | 0.90 | DG | 14 | m7iii | 7 |
| 28 | J100055.3+250907 | 310877 | 150.2306 | 25.1521 | 0.124 | 0.040 | 21.17 | 20.49 | 3.2 | 1(1538) | 0.41 | G | 13 | m3iii | 8 |
| 29 | J100226.1+024611 | 23727 | 150.6090 | 2.7687 | 0.428 | 0.057 | 20.06 | 20.19 | 3.038 | 1(271) | 3.13 | Gr | 6 | g2iv | 5 |
| 30 | J100655.8+050325 | 315437 | 151.7327 | 5.0571 | 1.454 | 0.644 | 19.46 | 19.39 | 3.086 | 0(0) | 3.60 | r | 1 | rk0v | 8 |
| 31 | J104445.6011756 | 283334 | 161.1901 | 1.2990 | 0.248 | 0.071 | 20.35 | 20.29 | 3.496 | 0(0) | 3.73 | r | 1 | g5i | 5 |
| 32 | J104920.9+510041 | 16951 | 162.3372 | 51.0114 | 0.171 | 0.034 | 20.87 | 20.77 | 3.057 | 0(0) | 0.04 | 7 | f5i | 7 | |
| 33 | J104808.3+583718 | 275930 | 162.0347 | 58.6217 | 1.136 | 0.348 | 20.31 | 20.13 | 3.285 | 0(0) | 0.05 | 13 | wk2iii | 8 | |
| 34 | J111151.3+061321 | 44028 | 167.9642 | 6.2227 | 0.146 | 0.031 | 20.18 | 20.33 | 3.200 | 0(0) | 3.13 | r | 6 | g0iv | 5 |
| 35 | J115659.3+551309 | 27772 | 179.2477 | 55.2190 | 0.933 | 0.234 | 18.39 | 18.09 | 3.110 | 0(0) | 0.23 | 13 | m1iii | 12 | |
| 36 | J120613.4+443527 | 355201 | 181.5561 | 44.5908 | 0.564 | 0.114 | 20.93 | 20.28 | 3.483 | 0(0) | 0.80 | 13 | m5v | 9 | |
| 37 | J120735.5+251140 | 356435 | 181.8982 | 25.1947 | 0.538 | 0.165 | 20.21 | 20.14 | 3.008 | 0(0) | 2.73 | 7 | f5i | 7 | |
| 38 | J122652.2+013632 | 349269 | 186.7178 | 1.6090 | 0.687 | 0.201 | 19.61 | 19.74 | 3.015 | 0(0) | 2.70 | 6 | f02iv | 8 | |
| 39 | J123142.1+110308 | 23419 | 187.9259 | 11.0522 | 0.382 | 0.045 | 20.06 | 20.00 | 3.024 | 0(0) | 2.60 | 5 | f02iv | 7 | |
| 40 | J123231.0+121846 | 348272 | 188.1293 | 12.3131 | 0.302 | 0.153 | 20.57 | 20.69 | 3.055 | 0(0) | 2.75 | 7 | f5iv | 7 | |
| 41 | J123613.4+275151 | 350816 | 189.0561 | 27.8643 | 0.424 | 0.106 | 20.10 | 20.07 | 3.780 | 0(0) | 0.70 | 13 | m3ii | 11 | |
| 42 | J123752.6+092934 | 350323 | 189.4692 | 9.4930 | 0.925 | 0.216 | 19.60 | 19.54 | 3.027 | 0(0) | 2.67 | 7 | f02iv | 7 | |
| 43 | J124405.1+125757 | 368647 | 191.0214 | 12.9659 | 1.101 | 0.200 | 21.15 | 20.86 | 3.1 | 1(611) | 0.43 | D | 13 | m2iii | 7 |
| 44 | J124825.2+673135 | 366095 | 192.1052 | 67.5266 | 0.519 | 0.101 | 19.15 | 19.10 | 3.224 | 0(0) | 2.73 | r | 9 | f8i | 5 |
| 45 | J130200.0+281213 | 362403 | 195.5002 | 28.2038 | 0.163 | 0.080 | 20.74 | 20.45 | 3.084 | 0(0) | 2.68 | 2 | f5iii | 8 | |
| 46 | J130206.5+281117 | 362291 | 195.5272 | 28.1882 | 0.249 | 0.098 | 21.16 | 20.34 | 4.884 | 0(0) | 5.55 | 12 | m5v | 8 | |
| 47 | J131047.8+322518 | 364785 | 197.6995 | 32.4219 | 0.090 | 0.048 | 20.34 | 19.96 | 3.009 | 0(0) | 0.70 | 8 | f0i | 9 | |
| 48 | J132451.8+032722 | 331382 | 201.2159 | 3.4563 | 0.641 | 0.172 | 20.81 | 20.19 | 3.019 | 0(0) | 3.22 | 12 | wk2iii | 7 | |
| 49 | J133002.2+241634 | 53129 | 202.5096 | 24.2766 | 0.192 | 0.055 | 20.75 | 20.21 | 3.038 | 0(0) | 2.73 | 12 | f2ii | 7 | |
| 50 | J135613.7+182358 | 328590 | 209.0575 | 18.3996 | 0.482 | 0.087 | 21.10 | 20.68 | 3.927 | 0(0) | 0.68 | G | 13 | m3ii | 8 |
| 51 | J140149.8+024835 | 11017 | 210.4580 | 2.8100 | 0.982 | 0.073 | 21.19 | 20.53 | 3.83 | 1(643) | 0.26 | G | 7 | m2iii | 7 |
| 52 | J142437.8+225601 | 346440 | 216.1579 | 22.9338 | 41.066 | 10.834 | 15.39 | 15.34 | 3.62 | 1(1417) | 3.57 | G | 7 | rk3iii | 12 |
| 53 | J143023.7+420436 | 15580 | 217.5989 | 42.0768 | 54.979 | 0.640 | 19.16 | 19.31 | 4.656 | 0(0) | 4.15 | tr | 1 | m4v | 5 |
| 54 | J150603.5+012757 | 41624 | 226.5147 | 1.4664 | 0.787 | 0.136 | 20.78 | 20.36 | 3.852 | 0(0) | 3.41 | G | 12 | m2iii | 7 |
| 55 | J161618.1+122351 | 199481 | 244.0757 | 12.3976 | 0.223 | 0.137 | 20.00 | 19.73 | 4.292 | 0(0) | 4.07 | r | 1 | k3i | 5 |
| 56 | J164829.7+350159 | 29462 | 252.1238 | 35.0330 | 3.526 | 0.203 | 20.32 | 20.16 | 4.075 | 1(1347) | 1.56 | D | 2 | rf8v | 7 |
| 57 | J171456.2+593700 | 215090 | 258.7343 | 59.6168 | 1.198 | 0.398 | 20.52 | 20.17 | 4.028 | 1(1406) | 0.24 | 6 | g2v | 8 | |
| 58 | J213621.4+003028 | 266573 | 324.0893 | 0.5079 | 0.602 | 0.082 | 20.54 | 20.09 | 3.2 | 1(1538) | 0.18 | G | 12 | wk2iii | 7 |
| 59 | J213729.8+003151 | 264414 | 324.3742 | 0.5310 | 0.263 | 0.043 | 20.97 | 20.80 | 3.630 | 0(0) | 3.48 | r | 2 | k01ii | 5 |
| 60 | J220814.9+015856 | 231039 | 332.0624 | 1.9824 | 0.713 | 0.375 | 19.71 | 19.52 | 3.084 | 0(0) | 2.75 | D | 7 | f5i | 8 |
| 61 | J220845.5+020252 | 235145 | 332.1896 | 2.0479 | 1.004 | 0.339 | 19.34 | 19.37 | 3.405 | 1(646) | 1.38 | 3 | wf5v | 8 | |
| 62 | J221722.2+001640 | 47709 | 334.3429 | 0.2780 | 0.088 | 0.019 | 21.28 | 20.61 | 3.366 | 0(0) | 3.18 | 2 | g2i | 5 | |
| 63 | J224041.7+032326 | 223971 | 340.1738 | 3.3906 | 0.262 | 0.091 | 21.15 | 20.45 | 3.348 | 1(1880) | 3.26 | 12 | k3iii | 6 |
The structure of the table and the notation are the same as those for the table above.