A computational study on synaptic and extrasynaptic effects of
astrocyte glutamate uptake on orientation tuning in V1
Konstantin Mergenthaler1, Franziska Oschmann1, Jeremy Petravicz2, Dipanjan Roy1, Mriganka Sur 2, Klaus Obermayer1,*
1 Neural Information Processing Group, Fakultät IV and Bernstein Center for Computational Neuroscience, Technische
Universität Berlin, Berlin, Germany
2 Picower Institute for Learning and Memory, Department of Brain and
Cognitive Sciences, Massachusetts Institute of Technology, Cambridge, MA
02139, USA
* klaus.obermayer@mailbox.tu-berlin.de
Abstract
Astrocytes affect neural transmission by a tight control of the glutamate transporters which affect glutamate concentrations in direct vicinity to the synaptic cleft and in the extracellular space. The relevance of glutamate transporters for information representation has been supported by in-vivo studies in ferret and mouse primary visual cortex. A pharmacological block of glutamate transporters in ferrets broadened tuning curves and enhanced the response at preferred orientations. In knock-out mice with reduced expression glutamate transporters a sharpened tuning was observed. It is, however, unclear how focal and ambient changes in the glutamate concentration affect stimulus representation. Here, we developed a computational framework, which allows the investigation of synaptic and extrasynaptic effects of glutamate uptake on orientation tuning in recurrently connected network models with pinwheel-domain (ferret) or salt-and-pepper (mouse) organization. This model proposed that glutamate uptake shapes information representation when it affects the contribution of excitatory and inhibitory neurons to the network activity. Namely, strengthening the contribution of excitatory neurons generally broadens tuning and elevates the response. In contrast, strengthening the contribution of inhibitory neurons can have a sharpening effect on tuning. In addition, local representational topology also plays a role: In the pinwheel-domain model effects were strongest within domains - regions where neighboring neurons share preferred orientations. Around pinwheels but also within salt-and-pepper networks the effects were less strong. Our model proposes that the pharmacological intervention in ferret increases the contribution of excitatory cells, while the reduced expression in mouse increases the contribution of inhibitory cells to network activity.
Author Summary
One of the key function of astrocytes is the clearance of neurotransmitters released during synaptic activity. Its importance for stimulus representation in the cortex was hypothesized following experiments that showed changes in selectivity when glutamate transport was blocked. Pharmacological and genetic interventions on glutamate transport considerably changed tuning width and strength of response in primary visual cortices of ferret and mouse. Here, we construct a modeling framework for visual cortices with pinwheel-domain and salt-and-pepper-organizations, which allows the detailed investigation of effects of altered glutamate uptake on orientation tuning. Our model proposes that changes in the representation of stimuli gets less selective if changes in glutamate uptake elicit stronger contribution of excitatory neurons to the network activity and selectivity is sharpened for a higher contribution of inhibitory neurons.
Introduction
Over the last years the view on astrocytes changed from mere supporting tissue providing metabolic support to active partners in information transmission and processing
De Pittà et al. [2012], Alvarellos-González et al. [2012], Nadkarni et al. [2008], Reato et al. [2012], Perea et al. [2009].
Strongest drive to this shift of the perspective was the development of calcium sensitive dyes Grynkiewicz et al. [1985] and the improvement of two-photon imaging Helmchen and Denk [2005]. These technique allowed the simultaneously observation of calcium transients in both astrocytes and neurons in-vivo Schummers et al. [2008]. Several pathways have been identified how neuronal and synaptic activity drive astrocyte activity Perea et al. [2014], Haydon and Nedergaard [2014], Benediktsson et al. [2012] or vice versa Perea et al. [2009], Araque et al. [2014], Chen et al. [2012], Nedergaard and Verkhratsky [2012]. Some of these pathways contain signaling cascades consisting of metabotropic receptors at the astrocyte membrane, internal second messenger
signaling and vesicular release from astrocytes
Panatier et al. [2011], Araque et al. [2014], De Pittà et al. [2011]. Other pathways contain transporters and pumps in the astrocyte plasma membrane, which directly link neuron and astrocyte activity via control of ion- and
transmitter concentrations in a shared extracellular space Larsen et al. [2014], Rose and Karus [2013].
An in-vivo study in the ferret visual cortex (V1) revealed the relevance of astrocytes for stimulus representation in the cortex Schummers et al. [2008]. This study investigated the effects of a pharmacological block of the glutamate transport on the well-defined response to differently oriented gratings. While blocking the glutamate uptake in astrocytes leads to a stronger but less orientation selective response in neurons, the activity in astrocytes and the intrinsic optical signal were strongly attenuated. Another study revealed that a strongly reduced concentration of the primary astrocyte transporter (GLT-1) caused a sharpened orientation tuning Petravicz et al. [2014].
In a review Scimemi and Beato [2009] investigating how glutamate uptake might shape the synaptic glutamate concentration time course two key constraints were pointed out: geometry Rusakov and Kullmann [1998] and transporter efficiency Diamond [2001, 2005], Thomas et al. [2011], Zheng et al. [2008]. First,
diffusion constraints, like a confined space Freche et al. [2011] and a clutter Min et al. [1998], shape the glutamate concentration after the release. Particularly, the size and the geometry of synapses play a role in glutamate clearance Tarczy-Hornoch et al. [1998], Megías et al. [2001], Gulyás et al. [1999]. Moreover, it has been observed that glutamatergic synapses to
excitatory or to inhibitory cells differ in their geometry Koester and Johnston [2005]. Therefore, glutamatergic synapses are considered as a determining factor for these two types of synapses Barbour et al. [1994]. In addition, Monte-Carlo modeling studies confirmed spatial constraints as a key determinant to glutamate clearance Freche et al. [2011], Rusakov [2001], Barbour [2001]. The second key constraint for the glutamate concentration time course are glutamate transporters, which shape the glutamate clearance from the synaptic cleft by buffering and complete uptake Danbolt [2001], Scimemi et al. [2009]. While some transporter subtypes are also found on pre- and postsynaptic neurons Danbolt [2001], Divito and Underhill [2014], the most abundant transporter (GLT-1) is highly concentrated on astrocyte processes ensheathing synapses Chaudhry et al. [1995], Benediktsson et al. [2012], Rusakov et al. [2014]. Dynamic changes in diffusion constraints occur primarily during maturation Thomas et al. [2011], Diamond [2005], but changes in neurotransmitter uptake can also be achieved by pharmacological blocking Schummers et al. [2008], or genetic ablation Petravicz et al. [2014]. Different effects of blocking glutamate transport on glutamate clearance have been found. One study proposes a shortening of glutamate clearance from the synaptic cleft when TBOA is applied, since less transporters are available to buffer glutamate within the cleft Scimemi et al. [2009]. Other studies propose a prolongation of the glutamate time course within the synapse during a block of the glutamate transport Murphy-royal et al. [2015], Barbour et al. [1994], Tong and Jahr [1994]. The modified glutamate concentration time course affects neurons via AMPA and NMDA receptors Tsukada et al. [2005], Bentzen et al. [2009]. During a blocked glutamate transport with TBOA a prolongation of AMPA-receptor mediated currents and a prevention of receptor desensitization were observed Mennerick et al. [1999]. Moreover, high concentrations of TBOA lead to a self-sustained pathologic rapid firing or to cell-death Tsukada et al. [2005], Rothstein et al. [1996].
Based on the studies named above we hypothesize that glutamate
transporters shape physiological responses. The representation of stimulus specific features within the neo-cortex is largely considered to occur in networks which contain strong lateral connections with tightly calibrated excitatory and inhibitory contributions Stimberg et al. [2009], Shushruth et al. [2012], Mariño et al. [2005]. This lead us to the question whether there are physiological
properties of the glutamate uptake which could elicit changes in the proportion of the excitatory and inhibitory contribution.
Moreover, the proportion of excitatory and inhibitory contribution crucially depends on the difference in strength between excitatory and inhibitory neurons. Therefore, differences in extrasynaptic NMDA receptor-expression on excitatory and inhibitory neurons would determine the susceptibility of the network to ambient glutamate rise. To our knowledge studies which found differences in NMDA receptor properties on excitatory and inhibitory cells Martina et al. [2003, 2013] did not explicitly investigate extrasynaptic NMDA receptors. As such differences affect the proportion of excitatory and inhibitory contribution and no detailed experimental observations are available we incorporates differences in sensitivity into the model and explore its contribution to stimulus representation.
In the following, we first investigate changes in the glutamate decay
time within isolated synapses which comprise kinetic models for AMPA- and
NMDA-receptors. Similar to Allam et al. [2012], David et al. [2009] we investigate changes in the glutamate decay time depending on the fraction of open AMPA and NMDA receptors. We particularly focus on fractions of open receptors when stimulations follow Poisson processes with different rates. In a next step these detailed synapses are integrated in a 2D- network for ferret visual cortex. When
the glutamate transport is unchanged the network operates in a regime with strong lateral inhibitory and excitatory drive. For the integrated model we ask whether we can find combinations of glutamate decay times for synapses with excitatory and inhibitory connections which generate a similar loss in selectivity as in Schummers et al. Schummers et al. [2008]. As a second investigation we examine whether differences in the sensitivity to ambient glutamate between excitatory and inhibitory neurons shape orientation tuning in the network model. Motivated by the experiments which compare orientation tuning in GLT- wild type and knock-out mice we investigate the effects of different glutamate decay times and of different sensitivities to ambient glutamate. These experiments were also performed in a network with salt-and-pepper organization Runyan and Sur [2013].
Results
Glutamate uptake and its effect on the transmission properties of single excitatory synapses
We studied the influence of astrocyte-mediated glutamate uptake on the transmission
properties of glutaminergic synapses in a simplified setting.
Here, the dynamics of synaptic AMPA receptors and NMDA receptors were described using kinetic models with 3 and 5 states (see Methods: Neurotransmitter concentration
& receptor dynamics). The glutamate concentration in the synaptic cleft was quantified by
bi-exponential pulses following every presynaptic spike. Different
glutamate decay time constants accounted for changes in the efficacy of astrocytic glutamate
uptake, where short (long) decay times corresponded to fast (slow)
glutamate uptake.
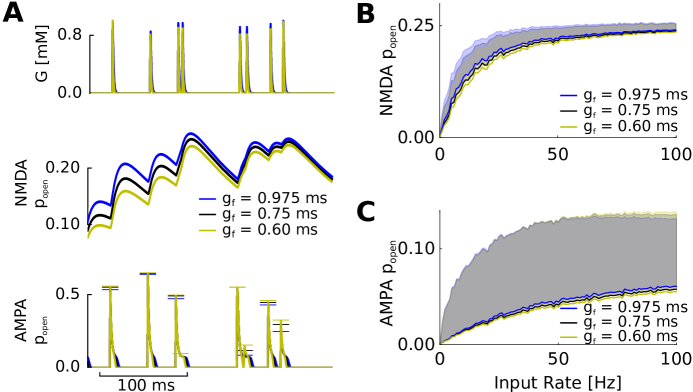
Fig. 1 shows the fraction of open NMDA and AMPA receptors in response to Poisson-distributed spike trains for three different decay
time-constants of the glutamate pulses. The fraction of open NMDA receptors was mostly affected by different glutamate decay times when both the fraction of open NMDA receptors and the number of glutamate pulses were low (see Fig. 1A). As a consequence, different glutamate decay times had the biggest impact on the fraction of open NMDA receptors when the frequency of the presynaptic spike rates ranged between 10 and 15 Hz (see Fig. 1B).
The fraction of open AMPA receptors was only marginally influenced by different glutamate decay times for large intervals between presynaptic spikes. However, an increase of the glutamate decay time prolonged the time to complete receptor closure (see Fig. 1A). Moreover, the effect of different glutamate decay time constants on the fraction of open AMPA receptors increased with the presynaptic spike rate (see Fig. 1B).
Effects in a V1 with pinwheel-domain organization
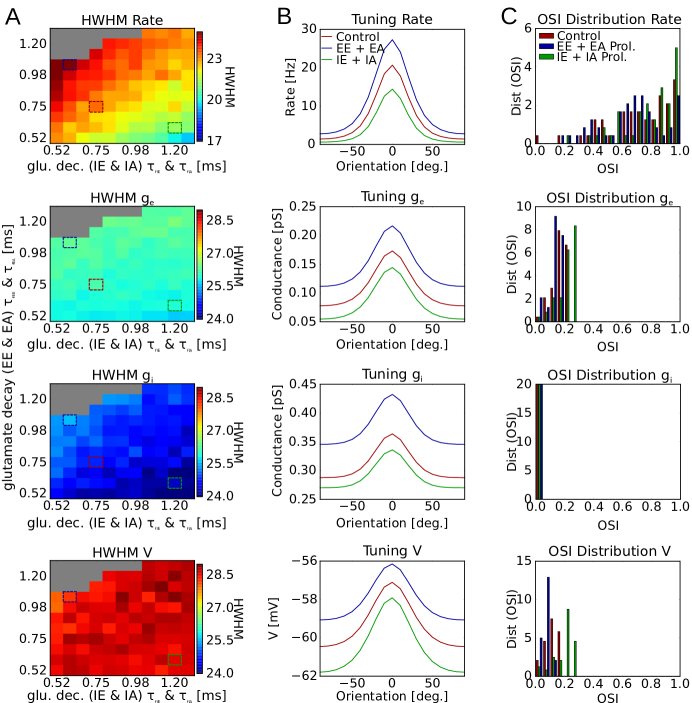
By asking whether affecting glutamate transport might have effects on representation of information in a recurrently connected networks, particular importance can be attributed to mechanisms weighting the contribution of excitatory and inhibitory populations. As the glutamate decay does not only depend on glutamate transporters but also on synapse geometries we independently varied the glutamate decay time for lateral synapses to either excitatory (EE-synapses) or inhibitory (IE-synapses) neurons and investigated changes in tuning. In our single layer model lateral synapses were synapses formed between neurons within the layer in contrast to afferent synapses, which originate from lower layers.
Synaptic mechanism
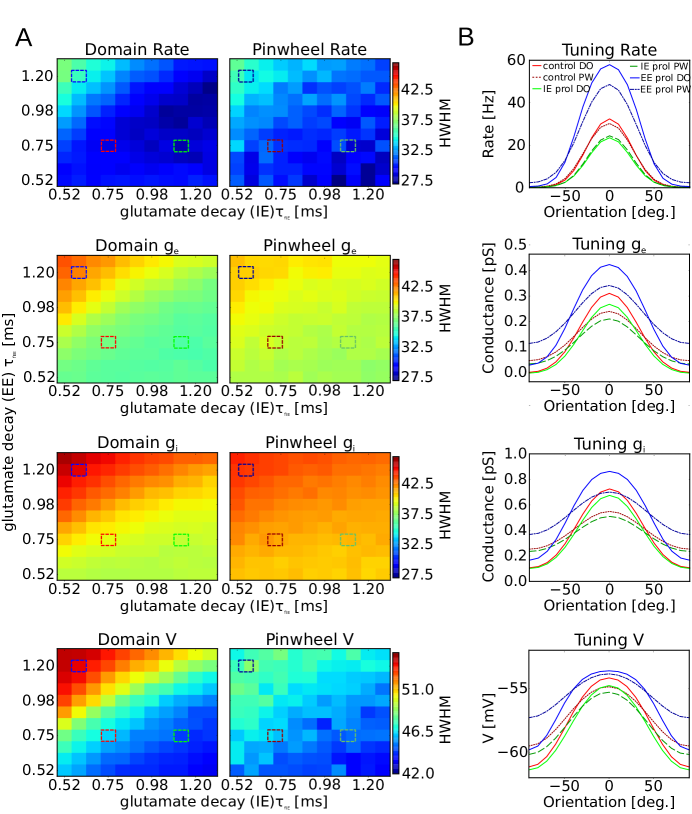
Starting from our reference point with the
same decay constant ( ms, red box in Fig. 2A)
for EE-synapses and IE-synapses we observed that a prolongation
of the glutamate decay time within EE-synapses broadens the firing rate tuning (Half-width-at-half-max: HWHM increases). The reference point ( ms) was chosen in accordance with values derived in Diamond [2005]. The broadening of tuning curves was even
stronger with a simultaneous reduction of the decay constant in IE-synapses (exemplary point: blue box in
Fig. 2A). Slight sharpening was observed
when prolongation occurs mostly within IE-synapses (reference point: green box in
Fig. 2A). This picture held within domain
centers as well as close to pinwheels. However, close to pinwheels we observed markedly smaller effects for different decay constants.
In addition to
changes in firing rate tuning a very similar picture was found for excitatory
and inhibitory conductances as well as the sub-threshold membrane
potential. Interestingly, the membrane potential showed a prominent
sharpening when the glutamate decay time within IE-synapses was prolonged
(Fig. 2A lower-left panel). The
broadening of the response for a prolonged decay in EE-synapses and a shortened decay in
IE-synapses went hand in hand with an increase in firing rates (Fig. 2B). Therefore, a
detailed prolongation of the glutamate decay time within EE-synapse and a simultaneous
reduction of the glutamate decay time within IE-synapses provided a plausible condition for
the experimentally observed change in tuning response during pharmacological block of the glutamate
transport in ferret V1 Schummers et al. [2008].
In addition to changes in lateral connections, a simultaneous change in afferent excitatory connections (EA-synapses: to excitatory neurons, and IA-synapses: to inhibitory neurons) might occur. The exploration of the simultaneous prolongation in EE- and EA-synapses as well as in IE- and IA-synapses revealed, that prolongation and shortening became more effective and enhance the strengthening effect of one population above the other. However, no qualitative change were observed (data not shown).
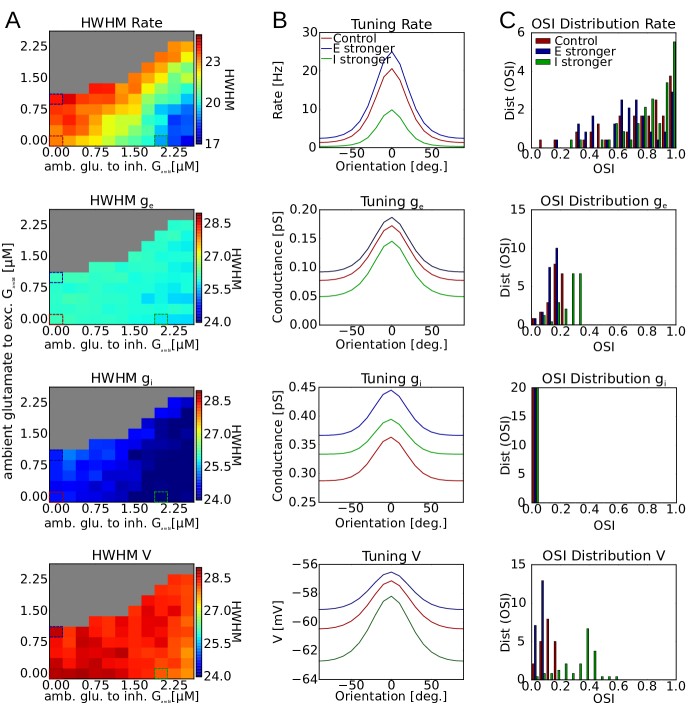
Extrasynaptic mechanism
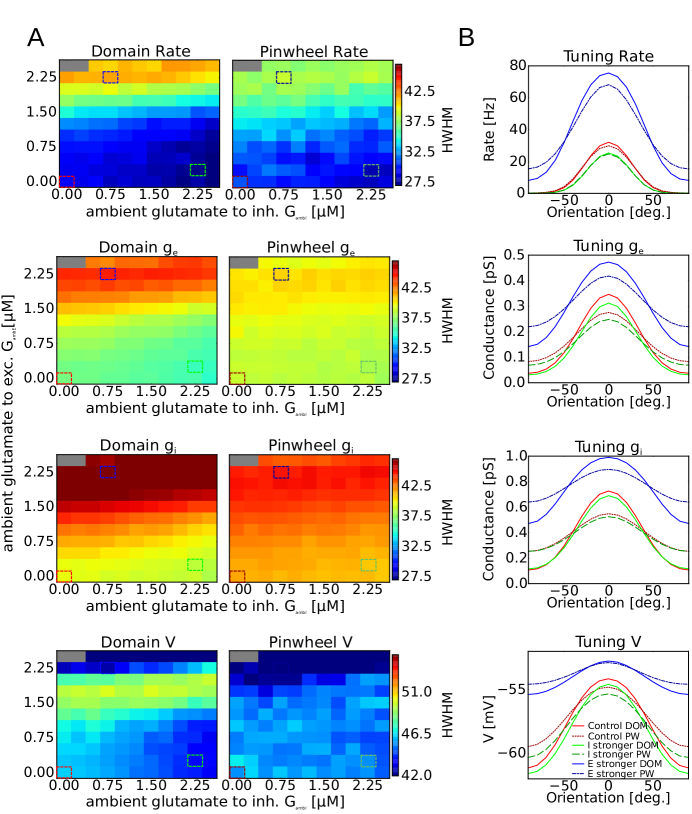
Another mechanism that weights the contribution of the excitatory and the inhibitory population differently and could originate from changes in the glutamate transport is a difference in sensitivity to the ambient glutamate level of excitatory and inhibitory neurons via extrasynaptic NMDARs. As a proxy for different NMDAR-densities we independently varied the ambient glutamate concentration affecting NMDARs on excitatory and inhibitory cells. With an increase of the ambient glutamate concentration effective on the excitatory neurons the orientation tuning broadened (higher HWHM values, cf. Fig. 3A). In addition, responses at preferred and non preferred orientations increased (Fig. 2B). Again this effect was much more pronounced within domains and much weaker around pinwheels. For an even stronger effect on excitatory neurons the network entered a state of pathological self sustained activity. The effect of NMDAR-currents on inhibitory neurons was again small and only small changes in the tuning width were observed.
Effects in a V1 with salt-and-pepper organization
The smaller effects around pinwheels called for the investigation of effect of glutamate decay times in a network with a salt-and-pepper organization. We investigated the effect of differential changes of the glutamate decay time in a model, which was calibrated to reproduce the observed firing rate tuning in mouse V1 Runyan and Sur [2013].
Synaptic mechanism
It turned out that changes in the glutamate decay constants only weakly changed the firing rate orientation tuning and had only negligible effects on the other quantities when considering half-width-at-half-max values (HWHM) Fig. 4A. While the shape of the tuning curves hardly changed and the tuning curves were mostly shifted upward for prolonged glutamate decay in EE-synapses and shifted downward for prolonged glutamate decay in IE-synapses Fig. 4B, responses at preferred and non-preferred orientations changed. The orientation-selectivity-index (OSI), however, merged shift- and shape-changes and OSI-distributions were either shifted to lower values when glutamate decay was prolonged in EE-synapses or were shifted to higher values when glutamate decay was prolonged in IE-synapses. For strongly prolonged glutamate decay times in EE-synapses with simultaneous shortening in IE-synapses the network reached self-sustained firing.
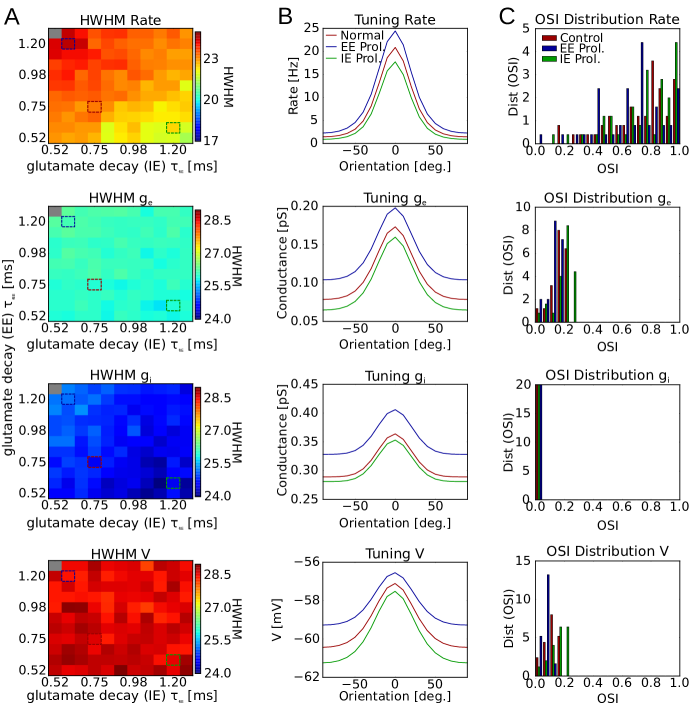
Again during a simultaneous prolongation in EE- and EA-synapses as well as in IE- and IA-synapses the effect on HWHMs were more pronounced (Fig. 5A). Now, the selectivity loss for a prolonged decay in EE- and EA-synapses and a shortened decay in IE- and IA-synapses, and the selectivity increase for a prolonged decay in IE- and IA-synapses and a shortened decay in EE- and EA-synapses, were also visible in the HWHMs of the sub threshold properties. Nevertheless, the biggest change occurred as upward or downward shifts of the tuning curves independent of the preferred orientation (Fig. 5B). Both changes were reflected in changes in OSI-values and prolongation to excitatory neurons shifted OSI-distributions to lower values, and prolongation to inhibitory neurons shifted OSI-distributions to higher values (Fig. 5C).
Extrasynaptic mechanism
We used different ambient glutamate concentrations as a proxy for different sensitivities of inhibitory and excitatory neurons to elevated ambient glutamate. In a salt-and-pepper network we observed that stronger sensitivity of excitatory neurons broadened the tuning (Fig. 6A blue box). For inhibitory cells more sensitive to ambient glutamate the HWHMs of the tuning curves of the firing rates and the conductances were markedly reduced (Fig. 6A green box). The membrane potential showed almost unchanged HWHM-values. For the synaptic mechanism the strongest effect were orientation independent shifts (Fig. 6B), which elevated the baseline activity for ambient glutamate mostly affected excitatory cells, and pulled down the baseline values for ambient glutamate mostly affected inhibitory cells. The prominent baseline shifts and the changes in tuning width combined to clear shifts in the OSI-distributions (Fig. 6C). For more sensitive inhibitory neurons OSI-distributions were shifted to higher values and for more sensitive excitatory neurons OSI-distributions were shifted to smaller values.
Discussion
Schummers et al. Schummers et al. [2008] observed a loss in selectivity to oriented
gratings when glutamate transport is blocked pharmacologically. Our presented model
reproduces the loss in selectivity, but only if changes in the glutamate transport
enhance the contribution of the excitatory population. Such a strengthening was achieved
via two different pathways for glutamate uptake. One was the prolongation of glutamate
decay within synapses to excitatory neurons. The second one was a postulated higher
sensitivity of excitatory neurons to ambient glutamate. The importance of
shifts in excitatory vs inhibitory contribution mediated by changes in
glutamate transport can even be seen in a model with a salt-and-pepper
organization of preferred orientations. Such a model
shows sharpened tuning (higher OSI-values) as for GLT-1+/--mice in Petravicz et al. [2014],
but only if the contribution of inhibitory neurons is strengthened. Interestingly,
the pinwheel-domain network showed an interaction between mapOSI as well as synaptic and extrasynaptic glutamate uptake effects. Changes in tuning were always stronger in domains
and much less pronounced close to pinwheels. Following, the analogy of neurons within a salt-and-pepper
network as neurons at pinwheels in a pinwheel-domain network it is not unexpected that effects on
tuning width (HWHM) are small in such a network. Particularly the observation
of lower effects of changes in lateral connections onto HWHM values but
orientation unspecific shifts of tuning curves is in line with a suggested
stronger contribution of weakly tuned inhibitory neurons as in
Bopp et al. [2014]. Interestingly, the
salt-and-pepper network with fewer lateral connections is more susceptible to pathologic self-sustained firing.
For the pinwheel-domain as well as for the salt-and-pepper map we achieved to directly link
effects of glutamate uptake to changes in information representation. To link these we, however,
were forced to construct rather complex models with a lot of fixed parameters and a lot of detail.
We took deliberate care in selecting fixed parameters to be in a physiological range, e.g.,
parameters describing the Hodgkin-Huxley dynamics of single neurons stem from
models largely used for neurons in visual cortex Stimberg et al. [2009], Mariño et al. [2005], Destexhe et al. [2001]. The necessity of 2D-network structures with
local lateral connections follows arguments in
Stimberg et al. [2009], Mariño et al. [2005] and Roy et al. [2013]. It allowed us to calibrate the model in
reference condition to match experimentally observed orientation tuning in pinwheel-domain networks
Mariño et al. [2005] and salt-and-pepper networks Runyan and Sur [2013]
and to investigate interactions of local heterogeneity in representing stimulus features with effects of
glutamate uptake. With the low number of connections and neurons and the very high
peak synaptic conductances we assume that each neuron and connection is representative for a
subpopulation sharing exactly the same features as the representative single neuron.
In contrast to our separate investigations of synaptic and extrasynaptic effect,
we expect that glutamate uptake experiments show a combined effect of both mechanisms.
To confine their exact contributions within the cortex, or answer whether changes in synaptic
clearance or raising ambient glutamate can be ruled out – due to no effective shift towards excitation or
inhibition, required new careful experiments. For the synaptic effect, first synapses onto excitatory
and inhibitory cells need to be separately investigated and separate assessments of synapses geometry, size,
and transporter densities is required. Second, in single synapse studies – either experimental or detailed
modeling studies similar to Scimemi and Beato [2009], Rusakov and Kullmann [1998], Freche et al. [2011] – effects on glutamate clearance and the susceptibility
to altered glutamate uptake
for the two types of synapses need to be investigated. For the extrasynaptic mechanism a separate
estimation of only extrasynaptic NMDA receptor densities on excitatory and inhibitory cells
would allow to estimate the effective impact of ambient glutamate.
For the single synapse models we observed interactions between glutamate clearance decay time and firing
rate in the contribution to average and fluctuations in open fractions of receptors. This leads to a
range of medium frequencies (10-15 Hz) where NMDA-receptors show the highest sensitivity to changes
in glutamate clearance. Similarly, AMPA-receptor fluctuations are most sensitive in a similar range.
Considering that
complex synapses will be present in networks which transit between fluctuation and mean driven phases Litwin-Kumar and Doiron [2012], Renart et al. [2007], we
propose that changes in glutamate clearance interact with the cortical dynamical state.
Finally, in the context of astrocytes as active partners, a short coming of our model is that both
pathways of glutamate uptake were investigated without intrinsic dynamics. Further investigations on
the effects of glutamate uptake in networks would largely benefit from coupled dynamic models of
neurons and astrocytes. In such models the dynamic intrinsic state of an astrocytes, e.g. Ca2+-concentration
would interact with glutamate uptake and finally the neighboring neurons.
Methods
0.1 Neuron model and postsynaptic currents
Concentration of neurotransmitter in the synaptic cleft and channel kinetics.
describes the time course of the neurotransmitter concentration in the synaptic cleft for the the excitatory neurotransmitter glutamate () and the inhibitory neurotransmitter GABA (). The time course of the neurotransmitter concentration in response to a presynaptic action potential follows a bi-exponential function:
Here, the rise and decay constants and (r: rise, f: decay) vary for different pairings of the post- (left letter) and presynaptic (right letter) cell type (, E: excitatory, I: inhibitory). denotes the arrival time of the action potential. Parameter values are summarized in Table 1. We chose , , and . The rise constant remained fixed, because of its small value. Variations in the decay constants and accounted for changes in the astrocytic glutamate uptake. was normalized, such that the peak concentrations of glutamate and GABA were set to mM Clements et al. [1992], Vizi et al. [2010].
| Parameter | Value | Description | Source |
| Synaptic – Neurotransmitter | |||
| ms | Glutamate concentration rise time | Diamond [2005] | |
| – ms | Exc. to inh. concentration decay time | Diamond [2005]* | |
| – ms | Exc. to exc. concentration decay time | Diamond [2005]* | |
| ms | GABA concentration rise time | ||
| ms | GABA concentration decay time | ||
| Synaptic – AMPA Channel dynamics | |||
| s-1 | AMPAR resensitization rate | Saftenku [2005] | |
| s-1 | AMPAR desensitization rate | Saftenku [2005] | |
| s-1 | AMPAR opening rate | Saftenku [2005] | |
| s-1 | AMPAR closing rate | Saftenku [2005] | |
| mM | AMPAR binding rate | Saftenku [2005] | |
| Synaptic – NMDA Channel dynamics | |||
| M-1s-1 | NMDAR binding rate | ||
| s-1 | NMDAR unbinding rate | Destexhe et al. [1998] | |
| s-1 | NMDAR desensitization rate | Destexhe et al. [1998] | |
| s-1 | NMDAR resensitization rate | Destexhe et al. [1998] | |
| s-1 | NMDAR opening rate | Destexhe et al. [1998] | |
| s-1 | NMDAR closing rate | Destexhe et al. [1998] | |
| Synaptic – GABAA Channel dynamics | |||
| M-1s-1 | GABAAR binding rate 1 | Destexhe et al. [1998] | |
| M-1s-1 | GABAAR binding rate 2 | Destexhe et al. [1998] | |
| s-1 | GABAAR unbinding rate 1 | Destexhe et al. [1998] | |
| s-1 | GABAAR unbinding rate 2 | Destexhe et al. [1998] | |
| s-1 | GABAAR opening rate 1 | Destexhe et al. [1998] | |
| s-1 | GABAAR opening rate 2 | Destexhe et al. [1998] | |
| s-1 | GABAAR closing rate 1 | Destexhe et al. [1998] | |
| s-1 | GABAAR closing rate 2 | Destexhe et al. [1998] | |
*A range of values around 0.75ms (derived in Diamond2005a) was explored. Rise and decay constants were chosen such that the mean squared distance between the bi-exponential function and the concentration of GABA as a function of time calculated as in Destexhe et al. [1998] was minimal (particle swarm optimization). Destexhe et al. [1998]
Fig. LABEL:fig:kinetic_schemes shows the kinetic schemes used for the AMPA-, NMDA-, and GABAA-channels. The AMPA-channel is described by one closed, one desensitized and one open state Saftenku [2005]. The NMDA-channel passes through three closed, one desensitized and one open state Lester and Jahr [1992]. The GABA-A channel has three closed and two open states Destexhe et al. [1998].
Neuron model
Neurons are described by conductance-based point neuron models, where changes of the membrane voltage for excitatory () and inhibitory () neurons are driven by a sum of transmembrane currents:
| (1) |
denotes the membrane capacitance and the time. We consider: (i) a leak current with leak conductance and reversal potential , (ii) a sum of three Hodgkin-Huxley type voltage-gated intrinsic currents (see below), (iii) the total synaptic ligand-gated current , (iv) a ligand-gated current driven by extrasynaptic glutamate, and (v) a background current for inducing a realistic level of spontaneous activity. Parameters are summarized in Table 2.
| Parameter | Value | Description | Source |
| Membrane capacitance and leak current | |||
| nF | Membrane capacitance | Schummers et al. [2007] | |
| nS | Leak conductance, excitatory neurons | Schummers et al. [2007] | |
| nS | Leak conductance, inhibitory neurons | Schummers et al. [2007] | |
| mV | Reversal potential | Schummers et al. [2007] | |
| Intrinsic (voltage gated) currents | |||
| S | Sodium current, peak conductance | Mariño et al. [2005] | |
| mV | Sodium current, reversal potential | Mariño et al. [2005] | |
| 3 | Sodium current, no. of activation sites | Mariño et al. [2005] | |
| 1 | Sodium current, no. of inactivation sites | Mariño et al. [2005] | |
| S | Potassium current, peak conductance | Mariño et al. [2005] | |
| mV | Potassium current, reversal potential | Mariño et al. [2005] | |
| 4 | Potassium current, no. of activation sites | Mariño et al. [2005] | |
| 0 | Potassium current, no. of inactivation sites | Mariño et al. [2005] | |
| nS | M-channel, peak conductance, excit. neurons | Mariño et al. [2005] | |
| nS | M-channel, peak conductance, inhib. neurons | Schummers et al. [2007] | |
| mV | M-channel, reversal potential | Mariño et al. [2005] | |
| 1 | M-channel, no. of activation sites | Mariño et al. [2005] | |
| 0 | M-channel, no. of inactivation sites | Mariño et al. [2005] | |
| Background currents | |||
| mS | Excitatory current, reversal potential | Schummers et al. [2007] | |
| mV | Inhibitory current, reversal potential | Schummers et al. [2007] | |
| ms | Excitatory current, time constant | Schummers et al. [2007] | |
| ms | Inhibitory current, time constant | Schummers et al. [2007] | |
| nS | average excit. to excit. conductance | Schummers et al. [2007] | |
| nS | average inhib. to excit. conductance | Schummers et al. [2007] | |
| nS | average excit. to inhib. conductance | Schummers et al. [2007] | |
| nS | average inhib. to inhib. conductance | Schummers et al. [2007] | |
| nS | Noise strength, excit. conductance | Schummers et al. [2007] | |
| nS | Noise strength, inhib. conductance | Schummers et al. [2007] | |
Intrinsic currents
The Hodgkin-Huxley-type neuron model implements three intrinsic voltage-gated currents , a fast sodium current , a delayed-rectified potassium current , and a slow non-inactivating population specific potassium current . The intrinsic currents of each neuron follow:
| (2) |
with the peak conductance, and the activation and inactivation variables, and the number of activation and inactivation sites, and the reversal potential of the channel. The peak conductance for the -current is population selective , to account for weaker adaptation in inhibitory neurons. The dynamics of activation () and inactivation () are given by:
with opening () and closing () transition rates. The kinetics follow Destexhe and Paré [1999] and are summarized in Table 3
| Gating var. | [mV-1] | [mV] | [mV] | |
|---|---|---|---|---|
Expressions for channel dynamics as in Destexhe and Paré [1999]
Synaptic currents
Each neuron receives a set of (lateral & afferent) glutamatergic and lateral GABA-ergic synaptic currents.
with the number of received connections, and the indices of projecting afferent, excitatory, and inhibitory neurons with the target population. The current through the specific receptor type at every synapse is governed by the introduced receptor dynamics. The post-synaptic current with is given by:
with the receptor specific peak conductance, the sum of open states, the membrane potential of the post-synaptic neuron, and the reversal potential. NMDA-receptors also express a voltage and magnesium dependent block and the extracellular magnesium concentration Jahr and Stevens [1990]. For the considerations of tuning in the conductances the excitatory synaptic conductances and are aggregated (). For the inhibitory conductances the experimental limitations to distinguish between synaptic inhibitory conductances and adapting intrinsic conductances we combine the GABAA and the slow non-inactivating potassium current. () to provide compatible values Schummers et al. [2007].
Synaptic peak conductances
A major difference to earlier models of V1 (cf. Stimberg et al. [2009] and Roy et al. [2013]) are the detailed synaptic kinetics. Therefore, afferent and lateral peak conductances had to be re-adjusted. To determine the peak-conductances for afferent ( and ) and inhibitory synapses () we stimulated simple exponential AMPA and GABAA synapses parametrized as in Stimberg et al. [2009] and the introduced detailed ones with the same Hz Poisson spike-trains for 2 s. Then we determined the peak conductance for which the average conductances were equal.
For the excitatory lateral peak conductances we assumed a 4:1 ratio for AMPA to NMDA receptors and we followed the paths described in Stimberg et al. [2009] and in Roy et al. [2013] to determine peak conductance values for connections to excitatory and inhibitory neurons. In detail we derived the peak conductances ( and , and , ) for the pinwheel-domain model by exactly following the procedure described in Stimberg et al. [2009] of matching orientation selectivity indices (OSI) for different mapOSIs to the data by Mariño et al. [2005] (for definition of OSI and mapOSI see below). For the salt-and-pepper network we matched the peak conductances by using Kolmogorov-Smirnov-tests to compare OSI-distributions with the data by Runyan and Sur [2013], as described in Roy et al. [2013]. In both cases we used a grid search in the space spanned by peak conductances to excitatory and inhibitory neurons and selected the best matching point. Parameter used for peak-conductances are comprised in Tab. 4.
| Parameter | Value | Description | Source |
| Synaptic – Currents | |||
| nS | Peak aff. AMPAR cond. to exc. neurons | * | |
| Peak aff. AMPAR cond. to inh. neurons | Stimberg et al. [2009] | ||
| nS | Peak rec. GABAAR conductance | * | |
| mV | AMPAR reversal potential | Destexhe et al. [1998] | |
| mV | NMDAR reversal potential | Destexhe et al. [1998] | |
| mV | GABAA reversal potential | Destexhe et al. [1998] | |
| mM/M | Unit-free magnesium concentration | Jahr and Stevens [1990] | |
| pinwheel-domain specific | |||
| nS | Peak rec. AMPAR conductance to exc. | * | |
| nS | Peak rec. AMPAR conductance to inh. | * | |
| nS | Peak rec. NMDAR conductance to exc. | * | |
| nS | Peak rec. NMDAR conductance to inh. | * | |
| salt-and-pepper specific | |||
| nS | Peak rec. AMPAR conductance to exc. | * | |
| nS | Peak rec. AMPAR conductance to inh. | * | |
| nS | Peak rec. NMDAR conductance to exc. | * | |
| nS | Peak rec. NMDAR conductance to inh. | * | |
| Extra-synaptic | |||
| nS | Peak extra-synaptic NMDAR conductance | Bentzen et al. [2009] | |
| M-H | Factor based on transition rates | Bentzen et al. [2009] | |
| Hill-coefficient of extra-synaptic NMDAR | Bentzen et al. [2009] | ||
| mV | Extra-synaptic NMDAR reversal potential | Bentzen et al. [2009] | |
| – M | Amb. Glut. concentr. to exc. neurons | Herman and Jahr [2007]∘ | |
| – M | Amb. Glut. concentr. to inh. neurons | Herman and Jahr [2007]∘ | |
* Peak synaptic conductances were determined as described in synaptic peak conductance paragraph. The ambient glutamate concentration are varied in a biological plausible range (cf. Herman and Jahr [2007])
Extrasynaptic ligand-gated currents
Extrasynaptic NMDA-receptors are activated by ambient glutamate . Different densities of NMDA-receptors on excitatory and inhibitory neurons provide population specific currents . The currents follow the steady state descriptions of extrasynaptic NMDA-receptors (eNMDAR) in Bentzen et al. [2009]:
with the peak conductance of eNMDARs, the dynamics of its magnesium block , the fraction of open eNMDARs following a power law-dependence on ambient glutamate, and the Nernst-potential of the eNMDARs (Parameters in Tab. 4).
Background currents
We consider the network to be embedded in surrounding neuronal activity. Therefore, each neuron receives synaptic background activity:
with specific reversal potentials (,) and fluctuating conductances the source population, following an Ornstein-Uhlenbeck process:
with the mean reversion speed, the average background conductance and the noise strength.
V1 network
The network layout is similar to Stimberg et al. [2009] and to Roy et al. [2013]. Two populations, an excitatory (size: ) and an inhibitory (size: ) population of neurons represent layer 2-3 of the primary visual cortex, on the one hand for species with a pinwheel-domain organization, e.g., ferrets (Fig. 7C left part), on the other hand for species with a salt-and-pepper organization, e.g., mice (Fig. 7C right part).
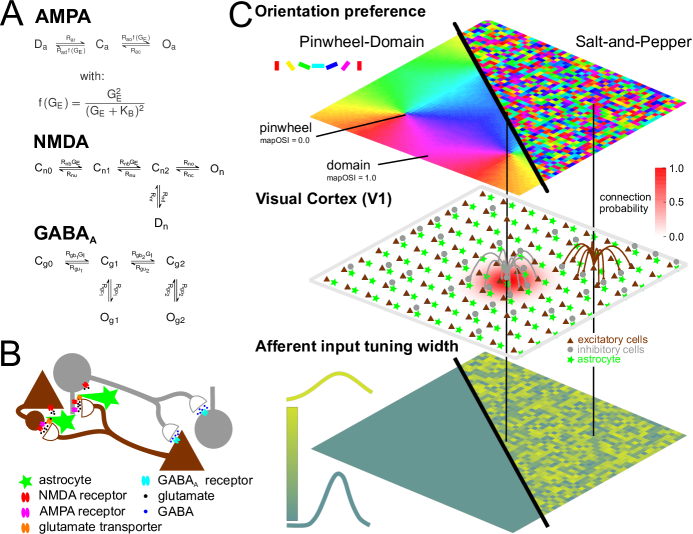
For both models the excitatory neurons are regularly placed on a 2d-grid of size . Inhibitory neurons are randomly placed on a third of all grid points. Each neuron receives a number () of afferent Poisson inputs with stimulus specific rates. Additionally, excitatory and inhibitory neurons receive fixed specific numbers of recurrent excitatory (, ) inputs and a number of recurrent inhibitory () inputs. The model for mouse features lower numbers of excitatory connections than the one for ferret (cf. Table 5). Independent of species all recurrent connections are randomly drawn, from the same radial symmetric 2d-Gaussian distance distribution, using the algorithm proposed in Efraimidis and Spirakis [2008],
with the distance (in gridpoints) to the presynaptic neuron, and the width of the Gaussian. Thereby connections between neighboring neurons are more likely (see Figure 7A). Each individual connection gets a transmission delay, which comprise synaptic and conduction delays, and is drawn from a gamma distribution with shape and scale parameters specific for the source population . Connections at the boundaries are generated using periodic boundary conditions. Parameters can be found in Table 5.
| Parameter | Value | Description | Source |
| Geometry | |||
| 2500 | Number of excit. neurons | Stimberg et al. [2009] | |
| 833 | Number of inhib. neurons | Stimberg et al. [2009] | |
| 20 | Number of afferent inputs | Stimberg et al. [2009] | |
| 4 | Spread of recurrent conn. (std. dev.) | Stimberg et al. [2009] | |
| Shape of Gamma distribution exc. conn. | Stimberg et al. [2009]* | ||
| Scale of Gamma distribution exc. conn. | Stimberg et al. [2009]* | ||
| Shape of Gamma distribution inh. conn. | Stimberg et al. [2009]* | ||
| Scale of Gamma distribution inh. conn. | Stimberg et al. [2009]* | ||
| ferret specific | |||
| = | 100 | Number of excit. recurrent inputs | Stimberg et al. [2009] |
| 50 | Number of inhib. recurrent inputs | Stimberg et al. [2009] | |
| mouse specific | |||
| 25 | Number of excit. to excit. inputs | Roy et al. [2013] | |
| 50 | Number of excit. to inhib. inputs | Roy et al. [2013] | |
| 50 | Number of inhib. recurrent inputs | Roy et al. [2013] | |
| Stimulation | |||
| Hz | max afferent firing rate | Stimberg et al. [2009] | |
| fraction of stimulus indep. rate | Stimberg et al. [2009] | ||
| ferret specific | |||
| deg. | input tuning width | Stimberg et al. [2009] | |
| mouse specific | |||
| deg. | input tuning width | Roy et al. [2013] | |
| deg. | input tuning width | Roy et al. [2013] | |
| deg. | input tuning width | Roy et al. [2013] | |
| deg. | input tuning width | Roy et al. [2013] | |
* Mean and standard deviation of the gamma distribution are matched to the values in Stimberg et al. [2009]
Organization of preferred orientations
For species which express a pinwheel-domain organization we generate the preferred orientation for each neuron based on its location within a pinwheel-domain map representing 4 pinwheels (see Figure 7C left part). The map is constructed by, first producing a single pinwheel in the first quadrant using equally spaced coordinates and and deriving every neurons preferred angle by:
second the full map is generated by mirroring the first into the other three quadrants. For species without a distinct organization we generate a salt-and-pepper-map by uniformly distributing preferred orientations randomly (see Fig. 7C right part).
Stimulation
All neurons receive a number of individual afferent Poisson-inputs generated by a full-field stimulation with a static fixed orientation . The neuron specific rate
depends on: selected stimulus orientation , preferred orientation of the neuron , a base-line firing rate , the maximal firing rate for optimal stimulation , and the population () and neuron specific input tuning width . For ferret all neurons independent of population receive input with identical tuning width (Fig. 7C left part). For mouse individual neuron receive specific afferent inputs drawn from two truncated (0-90) Gaussian-distributions differently parametrized for excitatory (mean: , standard deviation ) and inhibitory (mean: , standard deviation ) neurons, cf. Fig. 7C right part, Roy et al. [2013], and Table 5
Blocking glutamate transport
For the network we explore two ways how blocking glutamate transport affects tuning. First, at the synapses different decay times for and are considered. Second different NMDA-receptor current strengths to excitatory and inhibitory neurons are considered. We allow different and , as a proxy for different densities of NMDA-receptors.
Numerical Simulations
The synapses and the network model are implemented in Python 2.7 using Brian2 to generate C++ code. We used the Euler-integration scheme provided by the toolbox with an integration step of ms. Every simulation is run first for ms as initialization phase without recording data, then for ms data is recorded.
Analyses
Two different measures were used to analyze orientation tuning. First the orientation selectivity index (OSI; Swindale [1998]), given by
is the investigated quantity (e.g. firing rate) observed as response to a stimulation with orientation . Stimulation orientations have to span the entire range of possible orientations and have to be equally spaced. Values for OSI range from 0 (unselective) to 1 (highly selective). When using the number of sites with a specific orientation preference of neighboring pixels in a radius of 8 pixels instead of the OSI-measure can be used to derive the mapOSI, which quantifies the homogeneity of lateral inputs (cf. Fig 7C). As second measure we used the half-width at half max (HWHM) of the response tuning curves.
Instead of deriving tuning curves for each individual neuron by stimulating with different orientations we generate pseudo-neurons from a single simulation with one fixed stimulus orientation deg. Pseudo-neurons are generated by splitting all excitatory neurons into batches of 50 neurons based on their mapOSI (in pinwheel-domain case) or afferent input tuning width (in salt-and-pepper case). E.g., the 50 neurons with the smallest mapOSI constitute a pseudo neuron. As the 50 neurons have different preferred orientations we can consider these as stimulations with different offsets to the preferred orientation of a pseudo-neuron. Therefore, neurons (of a range of mapOSIs or afferent tuning width) with a preferred orientation close to will give the response of the pseudo-neuron (with the mapOSI or afferent tuning width) stimulated close to its preferred orientation. Equally spaced stimulations of the pseudo-neuron are obtained by, first fitting a flat-topped von-Mises distributions Swindale [1998] to the pseudo-neuron data, and second selecting points with a deg. difference from the obtained distributions. For the separation in pseudo-neurons close to pinwheel and within domains we used mapOSI and mapOSI , respectively.
Acknowledgments
The authors like to acknowledge the support team of Brian 2, which rapidly developed requested features which made it possible to run the simulations in standalone c++ code.
References
- Allam et al. [2012] Sushmita L Allam, Viviane S Ghaderi, Jean-Marie C Bouteiller, Arnaud Legendre, Nicolas Ambert, Renaud Greget, Serge Bischoff, Michel Baudry, and Theodore W Berger. A computational model to investigate astrocytic glutamate uptake influence on synaptic transmission and neuronal spiking. Front. Comput. Neurosci., 6(October):70, jan 2012. ISSN 1662-5188. doi: 10.3389/fncom.2012.00070. URL http://www.pubmedcentral.nih.gov/articlerender.fcgi?artid=3461576&tool=pmcentrez&rendertype=abstract.
- Alvarellos-González et al. [2012] Alberto Alvarellos-González, Alejandro Pazos, and Ana B Porto-Pazos. Computational models of neuron-astrocyte interactions lead to improved efficacy in the performance of neural networks. Comput. Math. Methods Med., 2012:476324, jan 2012. ISSN 1748-6718. doi: 10.1155/2012/476324. URL http://www.pubmedcentral.nih.gov/articlerender.fcgi?artid=3357509&tool=pmcentrez&rendertype=abstract.
- Araque et al. [2014] Alfonso Araque, Giorgio Carmignoto, Philip G. Haydon, Stéphane H.R. Oliet, Richard Robitaille, and Andrea Volterra. Gliotransmitters Travel in Time and Space. Neuron, 81(4):728–739, feb 2014. ISSN 08966273. doi: 10.1016/j.neuron.2014.02.007. URL http://linkinghub.elsevier.com/retrieve/pii/S0896627314001056.
- Barbour [2001] B Barbour. An evaluation of synapse independence. J. Neurosci., 21(20):7969–7984, 2001. ISSN 1529-2401. doi: 21/20/7969[pii].
- Barbour et al. [1994] Boris Barbour, Bernhard U. Keller, Isabel Llano, and Alain Marty. Prolonged presence of glutamate during excitatory synaptic transmission to cerebellar Purkinje cells. Neuron, 12(6):1331–1343, 1994. ISSN 08966273. doi: 10.1016/0896-6273(94)90448-0.
- Benediktsson et al. [2012] Adrienne M Benediktsson, Glen S Marrs, Jian Cheng Tu, Paul F Worley, Jeffrey D Rothstein, Dwight E Bergles, and Michael E Dailey. Neuronal activity regulates glutamate transporter dynamics in developing astrocytes. Glia, 60(2):175–88, feb 2012. ISSN 1098-1136. doi: 10.1002/glia.21249. URL http://www.ncbi.nlm.nih.gov/pubmed/22052455.
- Bentzen et al. [2009] N C K Bentzen, A M Zhabotinsky, and J L Laugesen. Modeling of glutamate-induced dynamical patterns. Int. J. Neural Syst., 19(6):395–407, dec 2009. ISSN 0129-0657. doi: 10.1142/S0129065709002105. URL http://www.ncbi.nlm.nih.gov/pubmed/20039463.
- Bopp et al. [2014] Rita Bopp, Nuno Maçarico da Costa, Björn M Kampa, Kevan a C Martin, and Morgane M Roth. Pyramidal Cells Make Specific Connections onto Smooth (GABAergic) Neurons in Mouse Visual Cortex. PLoS Biol., 12(8):e1001932, 2014. ISSN 1545-7885. doi: 10.1371/journal.pbio.1001932. URL http://www.pubmedcentral.nih.gov/articlerender.fcgi?artid=4138028&tool=pmcentrez&rendertype=abstract.
- Chaudhry et al. [1995] F a Chaudhry, K P Lehre, M van Lookeren Campagne, O P Ottersen, N C Danbolt, and J Storm-Mathisen. Glutamate transporters in glial plasma membranes: highly differentiated localizations revealed by quantitative ultrastructural immunocytochemistry. Neuron, 15(3):711–720, 1995. ISSN 08966273. doi: 10.1016/0896-6273(95)90158-2.
- Chen et al. [2012] Naiyan Chen, Hiroki Sugihara, Jitendra Sharma, Gertrudis Perea, Jeremy Petravicz, Chuong Le, and Mriganka Sur. Nucleus basalis-enabled stimulus-specific plasticity in the visual cortex is mediated by astrocytes. Proc. Natl. Acad. Sci. U. S. A., 109(41):E2832–41, oct 2012. ISSN 1091-6490. doi: 10.1073/pnas.1206557109. URL http://www.ncbi.nlm.nih.gov/pubmed/23012414.
- Clements et al. [1992] J D Clements, R a Lester, G Tong, Craig E Jahr, and G L Westbrook. The time course of glutamate in the synaptic cleft. Science, 258(5087):1498–501, nov 1992. ISSN 0036-8075. URL http://www.ncbi.nlm.nih.gov/pubmed/1359647.
- Danbolt [2001] N C Danbolt. Glutamate uptake. Prog. Neurobiol., 65(1):1–105, sep 2001. ISSN 0301-0082. URL http://www.pubmedcentral.nih.gov/articlerender.fcgi?artid=2775085&tool=pmcentrez&rendertype=abstract.
- David et al. [2009] Yaron David, Luisa P Cacheaux, Sebastian Ivens, Ezequiel Lapilover, Uwe Heinemann, Daniela Kaufer, and Alon Friedman. Astrocytic dysfunction in epileptogenesis: consequence of altered potassium and glutamate homeostasis? J. Neurosci., 29(34):10588–99, aug 2009. ISSN 1529-2401. doi: 10.1523/JNEUROSCI.2323-09.2009. URL http://www.pubmedcentral.nih.gov/articlerender.fcgi?artid=2875068&tool=pmcentrez&rendertype=abstract.
- De Pittà et al. [2011] Maurizio De Pittà, Vladislav Volman, Hugues Berry, and Eshel Ben-Jacob. A tale of two stories: astrocyte regulation of synaptic depression and facilitation. PLoS Comput. Biol., 7(12):e1002293, dec 2011. ISSN 1553-7358. doi: 10.1371/journal.pcbi.1002293. URL http://www.pubmedcentral.nih.gov/articlerender.fcgi?artid=3228793&tool=pmcentrez&rendertype=abstracthttp://dx.plos.org/10.1371/journal.pcbi.1002293.
- De Pittà et al. [2012] Maurizio De Pittà, Vladislav Volman, Hugues Berry, Vladimir Parpura, Andrea Volterra, and Eshel Ben-Jacob. Computational quest for understanding the role of astrocyte signaling in synaptic transmission and plasticity. Front. Comput. Neurosci., 6(December):1–25, 2012. ISSN 1662-5188. doi: 10.3389/fncom.2012.00098. URL http://www.frontiersin.org/Computational_Neuroscience/10.3389/fncom.2012.00098/abstract.
- Destexhe and Paré [1999] Alain Destexhe and D Paré. Impact of network activity on the integrative properties of neocortical pyramidal neurons in vivo. J. Neurophysiol., 81(4):1531–47, apr 1999. ISSN 0022-3077. URL http://www.ncbi.nlm.nih.gov/pubmed/10200189.
- Destexhe et al. [1998] Alain Destexhe, Z F Mainen, and Terrence J Sejnowski. Kinetic models of synaptic transmission. In I Koch, C. Segev, editor, Methods neuronal Model., pages 1–25. MIT Press, Cambridge, 2nd editio edition, 1998. URL http://citeseerx.ist.psu.edu/viewdoc/download?doi=10.1.1.164.9768&rep=rep1&type=pdf.
- Destexhe et al. [2001] Alain Destexhe, Michelle Rudolph, J M Fellous, and Terrence J Sejnowski. Fluctuating synaptic conductances recreate in vivo-like activity in neocortical neurons. Neuroscience, 107(1):13–24, jan 2001. ISSN 0306-4522. URL http://www.ncbi.nlm.nih.gov/pubmed/11744242.
- Diamond [2001] Jeffrey S Diamond. Neuronal glutamate transporters limit activation of NMDA receptors by neurotransmitter spillover on CA1 pyramidal cells. J. Neurosci., 21(21):8328–38, nov 2001. ISSN 1529-2401. URL http://www.ncbi.nlm.nih.gov/pubmed/11606620.
- Diamond [2005] Jeffrey S Diamond. Deriving the glutamate clearance time course from transporter currents in CA1 hippocampal astrocytes: transmitter uptake gets faster during development. J. Neurosci., 25(11):2906–16, mar 2005. ISSN 1529-2401. doi: 10.1523/JNEUROSCI.5125-04.2005. URL http://www.ncbi.nlm.nih.gov/pubmed/15772350.
- Divito and Underhill [2014] Christopher B. Divito and Suzanne M. Underhill. Excitatory amino acid transporters: Roles in glutamatergic neurotransmission. Neurochem. Int., 73(1):172–180, 2014. ISSN 18729754. doi: 10.1016/j.neuint.2013.12.008. URL http://dx.doi.org/10.1016/j.neuint.2013.12.008.
- Efraimidis and Spirakis [2008] Pavlos Efraimidis and Paul Spirakis. Weighted Random Sampling. In Ming-Yang Kao, editor, Encycl. Algorithms, pages 1024–1027. Springer US, 2008. ISBN 978-0-387-30770-1. doi: 10.1007/978-0-387-30162-4“˙478. URL http://dx.doi.org/10.1007/978-0-387-30162-4_478.
- Freche et al. [2011] Dominik Freche, Ulrike Pannasch, Nathalie Rouach, and David Holcman. Synapse geometry and receptor dynamics modulate synaptic strength. PLoS One, 6(10), 2011. ISSN 19326203. doi: 10.1371/journal.pone.0025122.
- Grynkiewicz et al. [1985] G. Grynkiewicz, M. Poenie, and R. Y. Tsien. A new generation of Ca2+ indicators with greatly improved fluorescence properties. J. Biol. Chem., 260(6):3440–3450, 1985. ISSN 00219258. doi: 3838314.
- Gulyás et al. [1999] a I Gulyás, M Megías, Z Emri, and T F Freund. Total number and ratio of excitatory and inhibitory synapses converging onto single interneurons of different types in the CA1 area of the rat hippocampus. J. Neurosci., 19(22):10082–10097, 1999. ISSN 1529-2401.
- Haydon and Nedergaard [2014] Philip G Haydon and Maiken Nedergaard. How Do Astrocytes Participate in Neural Plasticity? Cold Spring Harb. Perspect. Biol., pages 1–16, 2014. ISSN 1943-0264. doi: 10.1101/cshperspect.a020438. URL http://cshperspectives.cshlp.org/lookup/doi/10.1101/cshperspect.a020438.
- Helmchen and Denk [2005] Fritjof Helmchen and Winfried Denk. Deep tissue two-photon microscopy. Nat. Methods, 2(12):932–940, 2005. ISSN 1548-7091. doi: 10.1038/nmeth818.
- Herman and Jahr [2007] Melissa A Herman and Craig E Jahr. Extracellular glutamate concentration in hippocampal slice. J. Neurosci., 27(36):9736–41, sep 2007. ISSN 1529-2401. doi: 10.1523/JNEUROSCI.3009-07.2007. URL http://www.ncbi.nlm.nih.gov/pubmed/17804634http://www.pubmedcentral.nih.gov/articlerender.fcgi?artid=2670936&tool=pmcentrez&rendertype=abstract.
- Jahr and Stevens [1990] Craig E Jahr and C F Stevens. Voltage dependence of NMDA-activated macroscopic conductances predicted by single-channel kinetics. J. Neurosci., 10(9):3178–3182, sep 1990. URL http://www.jneurosci.org/content/10/9/3178.abstract.
- Koester and Johnston [2005] Helmut J Koester and Daniel Johnston. Target cell-dependent normalization of transmitter release at neocortical synapses. Science, 308(5723):863–866, 2005. ISSN 0036-8075. doi: 10.1126/science.1100815.
- Larsen et al. [2014] Brian Roland Larsen, Mette Assentoft, Maria L. Cotrina, Susan Z. Hua, Maiken Nedergaard, Kai Kaila, Juha Voipio, and Nanna Macaulay. Contributions of the Na+/K+-ATPase, NKCC1, and Kir4.1 to hippocampal K+ clearance and volume responses. Glia, 62:608–622, 2014. ISSN 08941491. doi: 10.1002/glia.22629.
- Lester and Jahr [1992] R a Lester and Craig E Jahr. NMDA channel behavior depends on agonist affinity. J. Neurosci., 12(2):635–43, feb 1992. ISSN 0270-6474. URL http://www.ncbi.nlm.nih.gov/pubmed/1346806.
- Litwin-Kumar and Doiron [2012] Ashok Litwin-Kumar and Brent Doiron. Slow dynamics and high variability in balanced cortical networks with clustered connections. Nat. Neurosci., 15(11):1498–1505, 2012. ISSN 1097-6256. doi: 10.1038/nn.3220.
- Mariño et al. [2005] Jorge Mariño, James Schummers, David C Lyon, Lars Schwabe, Oliver Beck, Peter Wiesing, Klaus Obermayer, and Mriganka Sur. Invariant computations in local cortical networks with balanced excitation and inhibition. Nat. Neurosci., 8(2):194–201, feb 2005. ISSN 1097-6256. doi: 10.1038/nn1391. URL http://www.ncbi.nlm.nih.gov/pubmed/15665876.
- Martina et al. [2003] Marzia Martina, Nicholas V Krasteniakov, and Richard Bergeron. D-Serine differently modulates NMDA receptor function in rat CA1 hippocampal pyramidal cells and interneurons. J. Physiol., 548(Pt 2):411–423, 2003. ISSN 0022-3751. doi: 10.1113/jphysiol.2002.037127.
- Martina et al. [2013] Marzia Martina, Tanya Comas, and Geoffrey a R Mealing. Selective pharmacological modulation of pyramidal neurons and interneurons in the CA1 region of the rat hippocampus. Front. Pharmacol., 4 MAR(March):1–16, 2013. ISSN 16639812. doi: 10.3389/fphar.2013.00024.
- Megías et al. [2001] M Megías, Z Emri, T F Freund, and A I Gulyás. Total number and distribution of inhibitory and excitatory synapses on hippocampal CA1 pyramidal cells. Neuroscience, 102(3):527–540, 2001. ISSN 0306-4522. doi: S0306-4522(00)00496-6[pii].
- Mennerick et al. [1999] S Mennerick, W Shen, W Xu, a Benz, K Tanaka, K Shimamoto, K E Isenberg, J E Krause, and C F Zorumski. Substrate turnover by transporters curtails synaptic glutamate transients. J. Neurosci., 19(21):9242–9251, 1999. ISSN 1529-2401.
- Min et al. [1998] Ming Yuan Min, Dmitri A. Rusakov, and Dimitri M. Kullmann. Activation of AMPA, kainate, and metabotropic receptors at hippocampal mossy fiber synapses: Role of glutamate diffusion. Neuron, 21(3):561–570, 1998. ISSN 08966273. doi: 10.1016/S0896-6273(00)80566-8.
- Murphy-royal et al. [2015] Ciaran Murphy-royal, Julien P Dupuis, Juan a Varela, Aude Panatier, Benoît Pinson, Jérôme Baufreton, Laurent Groc, and Stéphane H R Oliet. Surface diffusion of astrocytic glutamate transporters shapes synaptic transmission. Nat. Neurosci., 18(2), 2015. doi: 10.1038/nn.3901.
- Nadkarni et al. [2008] Suhita Nadkarni, Peter Jung, and Herbert Levine. Astrocytes optimize the synaptic transmission of information. PLoS Comput. Biol., 4(5):e1000088, may 2008. ISSN 1553-7358. doi: 10.1371/journal.pcbi.1000088. URL http://www.ncbi.nlm.nih.gov/pubmed/18516277.
- Nedergaard and Verkhratsky [2012] Maiken Nedergaard and Alexei Verkhratsky. Artifact versus reality-How astrocytes contribute to synaptic events? Glia, 1023(January):1013–1023, jan 2012. ISSN 1098-1136. doi: 10.1002/glia.22288. URL http://www.ncbi.nlm.nih.gov/pubmed/22228580.
- Panatier et al. [2011] Aude Panatier, Joanne Vallée, Michael Haber, Keith K Murai, Jean-Claude Lacaille, and Richard Robitaille. Astrocytes are endogenous regulators of basal transmission at central synapses. Cell, 146(5):785–98, sep 2011. ISSN 1097-4172. doi: 10.1016/j.cell.2011.07.022. URL http://www.ncbi.nlm.nih.gov/pubmed/21855979.
- Perea et al. [2009] Gertrudis Perea, Marta Navarrete, and Alfonso Araque. Tripartite synapses: astrocytes process and control synaptic information. Trends Neurosci., 32(8):421–31, aug 2009. ISSN 1878-108X. doi: 10.1016/j.tins.2009.05.001. URL http://www.ncbi.nlm.nih.gov/pubmed/19615761.
- Perea et al. [2014] Gertrudis Perea, Mriganka Sur, and Alfonso Araque. Neuron-glia networks: integral gear of brain function. Front. Cell. Neurosci., 8(November):1–8, 2014. ISSN 1662-5102. doi: 10.3389/fncel.2014.00378.
- Petravicz et al. [2014] Jeremy Petravicz, N Mellios, Sami El Boustani, C Le, and Mriganka Sur. Role of astrocyte glutamate transporters in ocular dominance plasticity and response properties of visual cortex. In Soc. Neurosci., page 127.14, 2014.
- Reato et al. [2012] Davide Reato, Mario Cammarota, Lucas C Parra, and Giorgio Carmignoto. Computational model of neuron-astrocyte interactions during focal seizure generation. Front. Comput. Neurosci., 6(October):81, jan 2012. ISSN 1662-5188. doi: 10.3389/fncom.2012.00081. URL http://www.pubmedcentral.nih.gov/articlerender.fcgi?artid=3467689&tool=pmcentrez&rendertype=abstract.
- Renart et al. [2007] Alfonso Renart, Rubén Moreno-Bote, Xiao-Jing Wang, and Néstor Parga. Mean-driven and fluctuation-driven persistent activity in recurrent networks. Neural Comput., 19(1):1–46, 2007. ISSN 0899-7667. doi: 10.1162/neco.2007.19.1.1.
- Rose and Karus [2013] Christine R Rose and Claudia Karus. Two sides of the same coin: Sodium homeostasis and signaling in astrocytes under physiological and pathophysiological conditions. Glia, pages 1–15, apr 2013. ISSN 1098-1136. doi: 10.1002/glia.22492. URL http://www.ncbi.nlm.nih.gov/pubmed/23553639.
- Rothstein et al. [1996] Jeffrey D. Rothstein, Margaret Dykes-Hoberg, Carlos A. Pardo, Lynn A. Bristol, Lin Jin, Ralph W. Kuncl, Yoshikatsu Kanai, Matthias A. Hediger, Yanfeng Wang, Jerry P. Schielke, and Devin F. Welty. Knockout of glutamate transporters reveals a major role for astroglial transport in excitotoxicity and clearance of glutamate. Neuron, 16(3):675–686, 1996. ISSN 08966273. doi: 10.1016/S0896-6273(00)80086-0.
- Roy et al. [2013] Dipanjan Roy, Yenni Tjandra, Konstantin Mergenthaler, Jeremy Petravicz, Caroline A Runyan, Nathan R Wilson, Mriganka Sur, and Klaus Obermayer. Afferent specificity, feature specific connectivity influence orientation selectivity: A computational study in mouse primary visual cortex. arXiv Prepr. arXiv1301.0996, page 39, 2013. URL http://arxiv.org/abs/1301.0996.
- Runyan and Sur [2013] Caroline a Runyan and Mriganka Sur. Response selectivity is correlated to dendritic structure in parvalbumin-expressing inhibitory neurons in visual cortex. J. Neurosci., 33(28):11724–33, jul 2013. ISSN 1529-2401. doi: 10.1523/JNEUROSCI.2196-12.2013. URL http://www.pubmedcentral.nih.gov/articlerender.fcgi?artid=3724550&tool=pmcentrez&rendertype=abstract.
- Rusakov [2001] Dmitri A. Rusakov. The role of perisynaptic glial sheaths in glutamate spillover and extracellular Ca(2+) depletion. Biophys. J., 81(4):1947–59, oct 2001. ISSN 0006-3495. doi: 10.1016/S0006-3495(01)75846-8. URL http://www.pubmedcentral.nih.gov/articlerender.fcgi?artid=1301670&tool=pmcentrez&rendertype=abstract.
- Rusakov and Kullmann [1998] Dmitri A. Rusakov and D M Kullmann. Extrasynaptic glutamate diffusion in the hippocampus: ultrastructural constraints, uptake, and receptor activation. J. Neurosci., 18(9):3158–70, may 1998. ISSN 0270-6474. URL http://www.ncbi.nlm.nih.gov/pubmed/9547224.
- Rusakov et al. [2014] Dmitri A. Rusakov, Lucie Bard, Michael G. Stewart, and Christian Henneberger. Diversity of astroglial functions alludes to subcellular specialisation. Trends Neurosci., 37(4):228–242, apr 2014. ISSN 01662236. doi: 10.1016/j.tins.2014.02.008. URL http://linkinghub.elsevier.com/retrieve/pii/S0166223614000228.
- Saftenku [2005] E E Saftenku. Modeling of slow glutamate diffusion and AMPA receptor activation in the cerebellar glomerulus. J. Theor. Biol., 234(3):363–82, jun 2005. ISSN 0022-5193. doi: 10.1016/j.jtbi.2004.11.036. URL http://www.ncbi.nlm.nih.gov/pubmed/15784271.
- Schummers et al. [2007] James Schummers, Beau Cronin, Klaus Wimmer, Marcel Stimberg, Robert Martin, Klaus Obermayer, Konrad Koerding, and Mriganka Sur. Dynamics of orientation tuning in cat v1 neurons depend on location within layers and orientation maps. Front. Neurosci., 1(1):145–59, nov 2007. ISSN 1662-453X. doi: 10.3389/neuro.01.1.1.011.2007. URL http://www.pubmedcentral.nih.gov/articlerender.fcgi?artid=2570087&tool=pmcentrez&rendertype=abstract.
- Schummers et al. [2008] James Schummers, Hongbo Yu, and Mriganka Sur. Tuned responses of astrocytes and their influence on hemodynamic signals in the visual cortex. Science, 320(5883):1638–43, jun 2008. ISSN 1095-9203. doi: 10.1126/science.1156120. URL http://www.ncbi.nlm.nih.gov/pubmed/18566287.
- Scimemi and Beato [2009] Annalisa Scimemi and Marco Beato. Determining the neurotransmitter concentration profile at active synapses. Mol. Neurobiol., 40(3):289–306, dec 2009. ISSN 1559-1182. doi: 10.1007/s12035-009-8087-7. URL http://www.pubmedcentral.nih.gov/articlerender.fcgi?artid=2777263&tool=pmcentrez&rendertype=abstract.
- Scimemi et al. [2009] Annalisa Scimemi, Hua Tian, and Jeffrey S Diamond. Neuronal transporters regulate glutamate clearance, NMDA receptor activation, and synaptic plasticity in the hippocampus. J. Neurosci., 29(46):14581–95, nov 2009. ISSN 1529-2401. doi: 10.1523/JNEUROSCI.4845-09.2009. URL http://www.pubmedcentral.nih.gov/articlerender.fcgi?artid=2853250&tool=pmcentrez&rendertype=abstract.
- Shushruth et al. [2012] S. Shushruth, P. Mangapathy, J. M. Ichida, P. C. Bressloff, L. Schwabe, and a. Angelucci. Strong Recurrent Networks Compute the Orientation Tuning of Surround Modulation in the Primate Primary Visual Cortex. J. Neurosci., 32(1):308–321, 2012. ISSN 0270-6474. doi: 10.1523/JNEUROSCI.3789-11.2012.
- Stimberg et al. [2009] Marcel Stimberg, Klaus Wimmer, Robert Martin, Lars Schwabe, Jorge Mariño, James Schummers, David C Lyon, Mriganka Sur, and Klaus Obermayer. The Operating Regime of Local Computations in Primary Visual Cortex. Cereb. Cortex, 19(9):2166–2180, 2009. URL http://www.culturacientifica.org/publicarch/cerebral_cortex_09_adv.pdf.
- Swindale [1998] N V Swindale. Orientation tuning curves : empirical description and estimation of parameters. Biol. Cybern., 78:45–56, 1998.
- Tarczy-Hornoch et al. [1998] K Tarczy-Hornoch, K A C Martin, J J B Jack, and K J Stratford. Synaptic interactions bewteen smooth and spiny neurones in layer 4 of cat visual cortex textit{in vitro}. J. Physiol., 508(2):351–363, 1998.
- Thomas et al. [2011] C. G. Thomas, Hua Tian, and Jeffrey S Diamond. The Relative Roles of Diffusion and Uptake in Clearing Synaptically Released Glutamate Change during Early Postnatal Development. J. Neurosci., 31(12):4743–4754, mar 2011. ISSN 0270-6474. doi: 10.1523/JNEUROSCI.5953-10.2011. URL http://www.jneurosci.org/cgi/doi/10.1523/JNEUROSCI.5953-10.2011.
- Tong and Jahr [1994] Gang Tong and Craig E. Jahr. Block of glutamate transporters potentiates postsynaptic excitation. Neuron, 13(5):1195–1203, 1994. ISSN 08966273. doi: 10.1016/0896-6273(94)90057-4.
- Tsukada et al. [2005] Shota Tsukada, Masae Iino, Yukihiro Takayasu, Keiko Shimamoto, and Seiji Ozawa. Effects of a novel glutamate transporter blocker, (2S, 3S)-3-[3-[4-(trifluoromethyl)benzoylamino]benzyloxy]aspartate (TFB-TBOA), on activities of hippocampal neurons. Neuropharmacology, 48(4):479–91, mar 2005. ISSN 0028-3908. doi: 10.1016/j.neuropharm.2004.11.006. URL http://www.ncbi.nlm.nih.gov/pubmed/15755476.
- Vizi et al. [2010] E. S. Vizi, a. Fekete, R. Karoly, and a. Mike. Non-synaptic receptors and transporters involved in brain functions and targets of drug treatment. Br. J. Pharmacol., 160(4):785–809, 2010. ISSN 00071188. doi: 10.1111/j.1476-5381.2009.00624.x.
- Zheng et al. [2008] Kaiyu Zheng, Annalisa Scimemi, and Dmitri A. Rusakov. Receptor actions of synaptically released glutamate: the role of transporters on the scale from nanometers to microns. Biophys. J., 95(10):4584–96, nov 2008. ISSN 1542-0086. doi: 10.1529/biophysj.108.129874. URL http://www.pubmedcentral.nih.gov/articlerender.fcgi?artid=2576387&tool=pmcentrez&rendertype=abstract.