An extraordinary outburst in the massive protostellar system NGC 6334I-MM1: quadrupling of the millimeter continuum
Abstract
Based on sub-arcsecond Atacama Large Millimeter/submillimeter Array (ALMA) and Submillimeter Array (SMA) 1.3 mm continuum images of the massive protocluster NGC 6334I obtained in 2015 and 2008, we find that the dust emission from MM1 has increased by a factor of 4.00.3 during the intervening years, and undergone a significant change in morphology. The continuum emission from the other cluster members (MM2, MM4 and the UCHII region MM3=NGC 6334F) has remained constant. Long term single-dish maser monitoring at HartRAO finds that multiple maser species toward NGC 6334I flared beginning in early 2015, a few months before our ALMA observation, and some persist in that state. New ALMA images obtained in 2016 July-August at 1.1 and 0.87 mm confirm the changes with respect to SMA 0.87 mm images from 2008, and indicate that the (sub)millimeter flaring has continued for at least a year. The excess continuum emission, centered on the hypercompact HII region MM1B, is extended and elongated ( au) with multiple peaks, suggestive of general heating of the surrounding subcomponents of MM1, some of which may trace clumps in a fragmented disk rather than separate protostars. In either case, these remarkable increases in maser and dust emission provide direct observational evidence of a sudden accretion event in the growth of a massive protostar yielding a sustained luminosity surge by a factor of , analogous to the largest events in simulations by Meyer et al. (2017). This target provides an excellent opportunity to assess the impact of such a rare event on a protocluster over many years.
Subject headings:
stars: formation — stars: protostars — accretion, accretion disks — ISM: individual objects (NGC 6334I) — radio continuum: ISM — submillimeter: ISM1. Introduction
| Parameter | 1.1 mm | 0.87 mm | 1.3 mm | 0.87 mm |
|---|---|---|---|---|
| ALMA | ALMA | SMA | SMA | |
| Observation date(s) | 2016 Jul 18, 2016 Aug 02 | 2016 Jul 17, 2016 Aug 02 | 2008 Aug 17,19 | 2008 Aug 11 |
| Julian day(s) | 2457587.7, 2457603.4 | 2457586.7, 2457603.5 | 2454695.8, 2454700.7 | 2454689.8 |
| Configuration(s) | C36-4, C36-5 | C36-4, C36-5 | Very extended | Very extended |
| Project code | 2015.A.00022.T | 2015.A.00022.T | 2008A-S008 | 2008A-S008 |
| Time on Source (min) | 26, 26 | 27, 27 | 150, 211 | 226 |
| Number of antennas | 40, 39 | 38, 37 | 8, 6 | 8 |
| FWHP Primary beam () | 20 | 17 | 56 | 37 |
| Baseband Freqs. (GHz) | 280.1, 282.0, 292.1, 294.0 | 337.1, 339.0, 349.1, 351.0 | 220.1, 230.1 | 336.5, 346.5 |
| Spectral windows | 4 | 4 | 48 | 48 |
| Channel width (MHz, km s-1) | 0.9766, 1.0 | 0.9766, 0.85 | 0.8125, 1.1 | 0.8125, 0.71 |
| Total bandwidth (GHz) | 7.5 | 7.5 | 3.9 | 3.9 |
| Continuum bandwidth (GHz) | 0.28 | 0.38 | 1.2 | 0.9 |
| Proj. baseline range (k) | 13-1247 | 14-1424 | 16-380 | 24-588 |
| Bandpass calibrator | J1924-2914, J1517-2422 | J1924-2914 | J1924-2914, 3c454.3 | J1924-2914, 3c454.3 |
| Gain calibrator | J1717-3342 | J1717-3342 | J1733-1304 | J1733-1304 |
| Flux calibrator | J1733-1304 | J1733-1304 | Callisto | Callisto |
| Robust clean parameter | +0.5 | 0.0 | 0.0 | |
| Resolution ( (P.A.)) | () | () | () | () |
| RMS noise (mJy beam-1)aaThe rms noise varies significantly with position in the images due to dynamic range limitations; the numbers provided here are representative values measured near the sources. | 2 | 3 | 7 | 20 |
Over the past decade, millimeter interferometers have found many examples of “massive protoclusters”, loosely defined as three or more continuum sources clustered within 10000 au that appear to trace massive protostars (e.g. Cyganowski et al., 2007; Palau et al., 2013; Sánchez-Monge et al., 2014). The cluster members typically span a diversity of evolutionary stages ranging from ultracompact HII regions and hot molecular cores to cold dust sources. The cluster member separations are well matched to the Trapezium stars (O’Dell et al., 2009), suggesting that we are seeing the formation phase of the central massive stars of future OB clusters. High resolution studies of these deeply embedded protoclusters at wavelengths that can penetrate the high dust column should provide clues to the accretion mechanisms that ultimately produce massive stars. One such proto-Trapezium is NGC 6334I, which is located in the northern end of the Galactic “mini-starburst” NGC 6334 (Willis et al., 2013). The bolometric luminosity of this protocluster is (Sandell, 2000) using the new maser parallax distance of 1.300.09 kpc for the neighboring source I(N) (Chibueze et al., 2014; Reid et al., 2014). We first resolved NGC 6334I with the Submillimeter Array (SMA)111The Submillimeter Array is a joint project between the Smithsonian Astrophysical Observatory and the Academia Sinica Institute of Astronomy and Astrophysics and is funded by the Smithsonian Institution and the Academia Sinica. at 1.3 mm (Hunter et al., 2006), into four sources: the well-known ultracompact (UC) HII region (MM3=NGC 6334F), two line-rich hot cores (MM1 and MM2, Beuther et al., 2007; Zernickel et al., 2012), and a dust core MM4. The latter three objects are so deeply embedded that they remain undetected at infrared wavelengths at least as long as 18m (De Buizer et al., 2002). The hot core MM1 lies at the origin of a high-velocity bipolar molecular outflow from the region (e.g. Leurini et al., 2006; Beuther et al., 2008; Qiu et al., 2011), indicating active accretion.
We observed NGC 6334I with the Atacama Large Millimeter/submillimeter Array (ALMA) in Cycle 2 at Band 6 (1.3 mm) with an angular resolution of (220 au). The continuum from the hot core MM1 was resolved into seven components within a projected radius of 1000 au and with brightness temperatures ranging from 100 to 260 K, consistent with the gas temperatures implied by the presence of a molecular line forest and copious H2O maser emission (Brogan et al., 2016). The luminosities inferred from the brightness temperatures and sizes suggest that MM1 is the dominant member of the protocluster in terms of bolometric luminosity. Thus, ALMA’s initial view of NGC 6334I MM1 suggested a “hot multi-core” of gas and dust containing multiple massive protostars undergoing accretion. However, the anomalously steep 1.5 cm to 1.3 mm spectral energy distributions that we reported for several components of MM1 motivated further investigation.
In this Letter, we perform a detailed comparison of ALMA images from 2015 and 2016 with SMA images obtained 7-8 years earlier, which reveals an extraordinary increase in the continuum emission from MM1 while the other protocluster members remained constant. We analyze several years of single-dish maser spectra and find flaring by a factor of in multiple transitions beginning in early 2015. Finally, using 2016 ALMA target-of-opportunity observations, we characterize the outburst in terms of luminosity, duration and location, highlighting its potential impact on the study of episodic accretion in massive star formation.
2. Observations
2.1. Millimeter and submillimeter interferometry
This Letter includes analysis of new ALMA Cycle 3 observations at 1.1 and 0.87 mm acquired in 2016 via Director’s Discretionary Time, along with older observations using the SMA in 2008 at 1.3 and 0.87 mm. The observing parameters for these data are presented in Table 1. The Cycle 3 ALMA data were calibrated using version C3R4B of the pipeline222See https://almascience.nrao.edu/processing/science-pipeline for details.. The SMA data were calibrated in MIRIAD and imaged in CASA. Because of the strong hot cores in NGC 6334I (MM1 and MM2, Zernickel et al., 2012), identifying line-free channels suitable for continuum imaging is challenging. We followed the procedure described in Brogan et al. (2016) and estimate that the resulting images suffer residual line contamination toward the hot cores. The line-free continuum bandwidths employed are given in Table 1. The estimated flux scale uncertainties are 5% for ALMA and 10% for SMA.
The continuum data were iteratively self-calibrated, using the bright emission as the initial model. Multi-scale clean was used on the ALMA data with scales of 0, 5, and 15 times the pixel size (). Robust visibility weighting was employed to promote matched angular resolution in the ALMA data; the beamsizes achieved are given in Table 1. All images were corrected for primary beam attenuation. Our earlier (Cycle 2) ALMA observations of this field at 1.3 mm are also used in this Letter. They are more fully described in Brogan et al. (2016), but we include their essential parameters here: observation date: 2015 August 29 (Julian day 2457264.5), mean frequency: 230.0 GHz, line-free bandwidth: 0.4 GHz, resolution: (220 AU), rms: 1.2 mJy beam-1.
2.2. Single-dish maser monitoring
NGC 6334I is one of several targets in a long-term maser monitoring program at the Hartebeesthoek Radio Observatory (HartRAO) using the 26 m telescope (see, e.g., Goedhart et al., 2004). Spectra of the 22.2 GHz H2O and 6.7 GHz CH3OH maser transitions were recorded in dual circular polarization with resolutions of 7.81 kHz (0.11 km s-1) and 0.98 kHz (0.044 km s-1), respectively, and typical rms sensitivities of 2 Jy and 1 Jy. The cadence of observations is typically every 10-15 days. Flux calibration is performed by observing Hydra A and 3C123 assuming the flux scale of Ott et al. (1994). The telescope beam size is and at the respective frequencies.
3. Results
3.1. Millimeter continuum
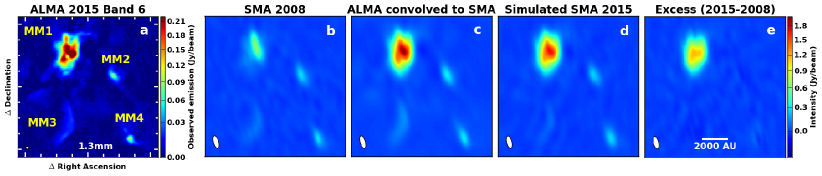
We present the ALMA 1.3 mm image from Brogan et al. (2016) in Figure 1a, alongside an SMA image observed seven years earlier (Fig. 1b). When we convolve the ALMA image to the resolution of the SMA image, the result (Fig. 1c) shows a significant difference in the morphology and the total flux density of MM1 (10.80.9 vs. 2.340.22 Jy) between the two epochs. Interestingly, the other sources in the protocluster (MM2, MM3, and MM4) do not show significant differences. As described in § 2.1, residual line emission contaminating the channels chosen to make the ALMA continuum image cannot be the cause of such a large difference in flux density. Furthermore, the spectrum of the MM2 hot core is similarly line-rich (Zernickel et al., 2012) so a line contamination effect should manifest in that source as well.
To exclude -sampling effects as the culprit, we simulated the 2008 SMA observations using the 2015 1.3 mm ALMA image (Fig 1a) as the sky model and applying the identical -coverage and flagging of our SMA observations (Fig 1b) using the CASA simobserve task. To account for the small difference in frequency between the ALMA and SMA 1.3 mm tunings, we first scaled the sky model image using a spectral index () image constructed from the contemporaneous 2016 1.1 and 0.87 mm ALMA images. This technique corrects for the distinct differences in among the dust sources (average values: MM1=2.9, MM2=3.2, MM4=2.4), which would otherwise cause a systematic error up to 6%. The resulting image (Fig. 1d) demonstrates what the SMA would have seen had it observed the region simultaneously with the 2015 ALMA observations. We find that the SMA could have recovered (9.4 Jy) of the MM1 emission recovered by ALMA, meaning that the bulk of the difference between the 2008 and 2015 images cannot be due to -sampling. Furthermore, Fig 1e, which shows the difference between the simulated 2015 SMA image and the actual 2008 SMA image, demonstrates that MM1 exhibits an excess of Jy, while MM2-4 are consistent with being unchanged (). We conclude that MM1 has flared by a factor of 3.90.6 at 1.3 mm during the seven-year interval between the observations, where the uncertainty includes the combined uncertainties in the flux scales and image measurements. This dramatic increase in flux density explains the anomalously steep 1.5 cm to 1.3 mm spectral energy distributions reported by Brogan et al. (2016) for several of the subcomponents of MM1, and further indicates that the millimeter flaring happened after the 2011 May VLA observations.
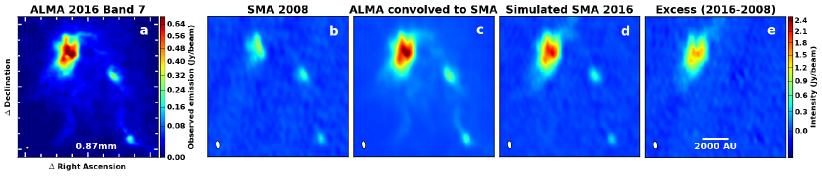
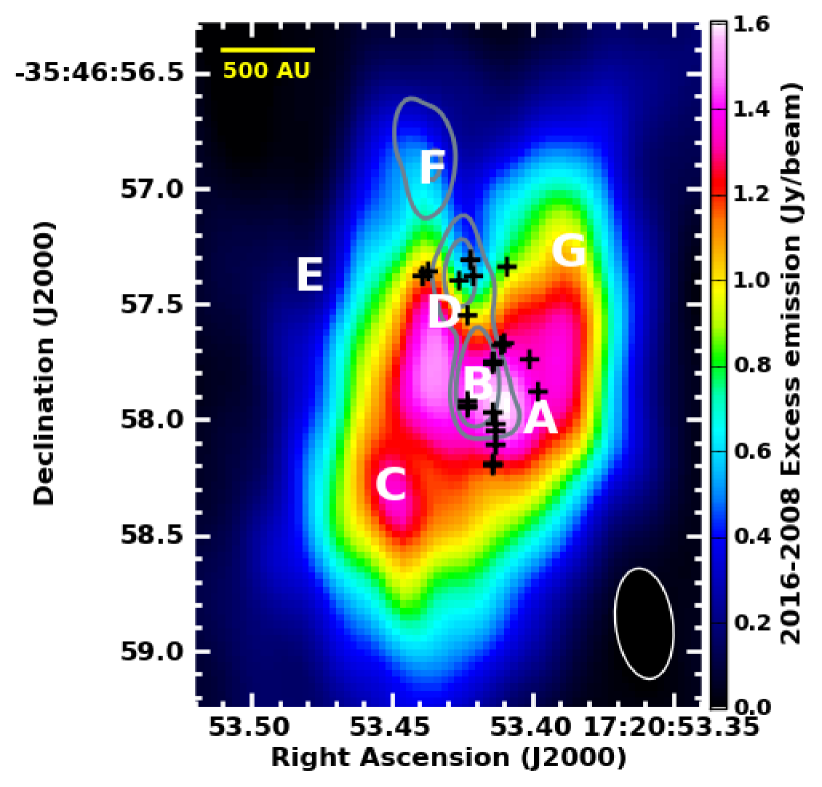
The 2016 0.87 mm ALMA image of NGC 6334I is shown in Figure 2a. The morphology of this image matches well with the 1.3 mm ALMA image observed one year earlier. Performing the same analysis on our 2016 ALMA and 2008 SMA data at 0.87 mm (Fig. 2a-e) yields an increase in the flux density of MM1 from 6.650.68 to 33.31.7 Jy. The SMA could have recovered (27.8 Jy) of the MM1 emission, yielding a comparable increase factor of 4.20.5. Combining the two bands, the mean factor is 4.00.3; however, the brightening factor could have evolved over 2015-2016. In any case, in both bands this increase represents only 30% of the total single-dish flux density from NGC 6334I measured in an beam (Sandell, 1994); thus, it would not have been so obvious in non-interferometric observations. In the highest-resolution image of the excess emission (0.87 mm, Fig. 3), the hypercompact (HC) HII region MM1B is the apparent center of activity. However, the emission is extended and elongated ( au), consistent with simultaneous increases in four other subcomponents of MM1 (A, C, D, and G). The positions of these four subcomponents form an elongated symmetric pattern relative to MM1B, with a major axis at position angle +140.5°. This pattern, combined with their simultaneous brightening, suggests that all of the subcomponents may not be independent protostars as originally interpreted by Brogan et al. (2016).
3.2. Contemporaneous maser flaring
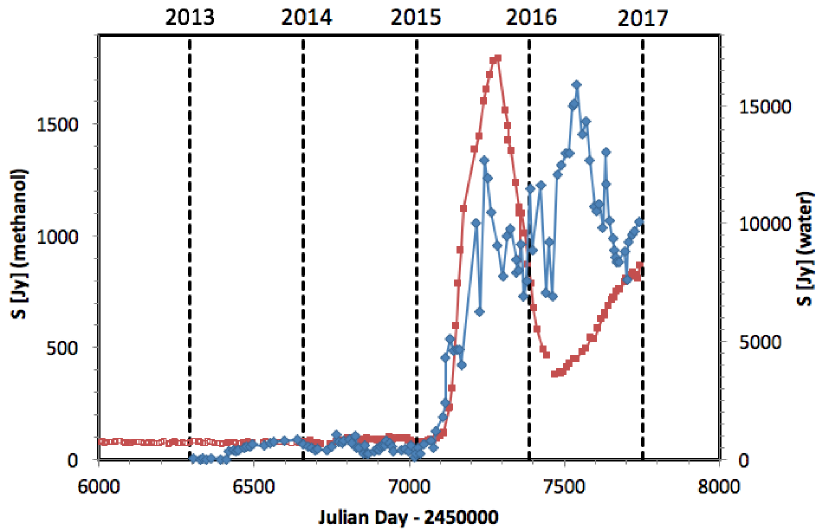
Strong flaring in 10 of 15 maser transitions from three species (H2O, CH3OH, and OH) toward NGC 6334I began in early 2015 (MacLeod, G. et al. 2017, in preparation). In Fig. 4 we show light curves for the 22.2 GHz H2O and 6.7 GHz Class II CH3OH maser lines, each for the component at km s-1, corresponding to the mean LSR velocity of the thermal gas (Zernickel et al., 2012). Both masers had increased by a factor of 10 by mid-May 2015. The H2O maser at this velocity ultimately increased by a factor of 40 compared to our 2011 May VLA data (Brogan et al., 2016), an increase that is reminiscent of past flares in Orion-KL (Omodaka et al., 1999; Abraham et al., 1981). H2O masers in star-forming regions are believed to occur behind -shocks (Hollenbach et al., 2013), suggesting that an energetic event has occurred. Serendipitously, the 2015 August 1.3 mm ALMA observations occurred when both masers reached their initial peak. While MM2 and MM3 contain 6.7 GHz masers (e.g., Brogan et al., 2016; Krishnan et al., 2013), MM1 has never been detected in this line, nor in the 12.2 GHz Class II maser line, in three decades of interferometric observations (Norris et al., 1988, 1993; Dodson & Moriarty, 2012). Because this maser requires far-infrared continuum to pump the torsionally excited states (Sobolev et al., 1997), the increase in continuum from MM1 could have initiated unprecedented maser activity in MM1 and/or enhanced the existing emission in MM2 and MM3. Follow-up VLA observations are underway to pinpoint the flaring masers.
3.3. Luminosity Increase
To estimate the increase in luminosity implied by the continuum flaring of MM1, we first measure the increase in 0.87 mm brightness temperature () averaged over the region of brightening shown in Fig. 3. In an aperture of diameter ( au), has increased by a factor of 2.90.3 (from 33 to 96 K). Given the uncertain geometry, we consider this change in the context of a simple model of a central protostar surrounded by a thick spherical shell of dust. Since our image resolves this structure, the dust temperature () will equal , where is the optical depth at 0.87 mm. The two temperatures should vary proportionally regardless of since the column density and emissivity of the grains (and hence ) cannot have changed substantially in such a short period, except in the hot innermost regions where grains are destroyed (see § 4). Thus, we can infer a similar increase factor of 2.9 for at the effective emitting surface. Radiative transfer models of dust envelopes surrounding outbursting protostars indicate that scales as the 1/4 power of the central luminosity (Taquet et al., 2016; Johnstone et al., 2013); thus, we compute a luminosity increase factor of . We can estimate a lower limit to the outburst luminosity as the sum of the brightness temperature luminosity estimates for the five MM1 components affected (A, B, C, D, and G) reported by Brogan et al. (2016), which is . Applying , the pre-outburst luminosity is then . Assuming the outburst began simultaneously with the maser burst, its duration is years, so the total energy released (so far) is erg.
4. Discussion
While unprecedented for a massive star forming core, a rapid quadrupling of the (sub)millimeter continuum flux density from a deeply embedded protostellar system like MM1 is within the realm of theoretical expectation due to episodic accretion, a phenomenon that is increasingly recognized as being essential to star formation (Kenyon et al., 1990; Evans et al., 2009). Although dramatic, the 70 luminosity increase estimated for MM1 is only about double that of the first identified outbursting Class 0 low-mass protostar HOPS 383 in Orion (30-50, Safron et al., 2015), whose submillimeter flux density increased by a factor . Based on continuum imaging alone, the MM1 increase occurred sometime during the 4.3 year interval between the VLA observations and the ALMA 1.3 mm observations. Since the initiation of the maser flare lies within this window, it likely further constrains the rise time. If the maser and continuum flares began simultaneously, then the rise time was less than a few months, compared to the 18 month constraint for HOPS 383 from its mid-infrared measurements.
Johnstone et al. (2013) simulate the effect of accretion outbursts on the envelope surrounding a low-mass protostar. A 100 increase in luminosity yields approximately a 5 increase in the 0.87 mm flux density after 208 days, which is somewhat faster and larger than the factor of 4.2 seen in MM1 at 445 days after the maser flare. The discrepancy may be due to longer timescales in a higher mass system where the dust will be heated to much higher temperatures in the inner optically thick zone. Indeed, the dust in the innermost region will be evaporated as the radius of the dust sublimation temperature (1500 K; e.g., Vaidya et al., 2009) moves outward, thereby enriching the gas phase (Taquet et al., 2016). The timescale to transfer heat from the surviving dust to the gas will be longer than the initial dust heating time (Johnstone et al., 2013). Modeling the rich, severely blended line emission from complex organic species in order to measure the ongoing changes in gas temperature and chemical abundance compared to the pre-burst state will be a challenging but important avenue of study.
The primary mechanism that could account for such a large outburst is a rapid increase in the accretion rate due either to disk fragmentation (Dunham & Vorobyov, 2012; Tobin et al., 2016) or an encounter (Pfalzner et al., 2008). A more extreme possibility is a protostellar merger, though for massive protostars this phenomenon would typically produce a much larger energy release than observed (Bally & Zinnecker, 2005). In the theory of competitive accretion (Bonnell & Bate, 2005), multiple seeds accrete gas simultaneously with higher rates occurring at the center of the protocluster. Simulations of such clustered environments find that encounter-induced boosting of the disk accretion rate is possible (Pfalzner, 2008), including up to (Forgan & Rice, 2010). While there are several massive protostars with candidate disks (see the list in Forgan et al., 2016), the first evidence for a disk-mediated accretion burst from a high-mass young stellar object was recently reported using infrared observations toward S255IR NIRS3 (Caratti o Garatti et al., 2017). It is similarly massive but less deeply embedded than MM1, enabling better constrained luminosity measurements. While its luminosity increase factor (5.5) is lower than MM1, its initial luminosity ( ) is significantly larger. Nevertheless, the two events are quantitatively similar in terms of the rapid onset, sustained duration ( yr), and total energy, which points toward a common origin. Both objects appear to drive bipolar outflows, which nominally require central disks. Intriguingly, the position angle of the elongated MM1 excess emission is exactly perpendicular to the large-scale bipolar outflow (+50°, Brogan et al., 2016) and the quasi-symmetry of the excess with respect to MM1B suggests a nearly edge-on, thick disk-like structure. Thus, MM1A, C, D, and G may trace clumps in a fragmented disk heated by an accretion event onto MM1B, which would explain their co-brightening. However, in this scenario, whether any of these components also contain central protostars is uncertain from the present data, since their high could be consistent with external heating by a central source after accounting for a modest beaming factor (2) from the “flashlight effect” (Yorke & Bodenheimer, 1999), an anisotropic radiation field favoring the poles that develops in simulations of massive accretion disks (e.g. Kuiper et al., 2015; Klassen et al., 2016).
The large, sustained increase in luminosity is analogous to FU Ori outbursts (Hartmann & Kenyon, 1996), whose decay periods range from 10 to several 100 years (Vittone & Errico, 2005; Audard et al., 2014), during which time an elevated quasi-steady accretion rate can persist (e.g., Zhu et al., 2010). It is also consistent with HOPS 383, which shows no fading after 6 years (Safron et al., 2015). In recent numerical hydrodynamic simulations of massive protostellar accretion including gas self-gravity and radiative feedback (Meyer et al., 2017), the central protostar undergoes a burst in accretion rate from 10-3 to 10-1 yr-1 as a massive (0.55 ) gas fragment approaches and enters the protostellar sink cell. Spaced by 2000 years, these largest events generate luminosity bursts of 50-100 lasting for several years, two characteristics analogous to the MM1 event. To test this scenario, it will be crucial to monitor the evolution of MM1 in future years in both dust and free-free emission, as well as to discern if there has been any change to the outflow properties due to the outburst. Toward this end, we have higher-resolution ALMA observations in the Cycle 4 queue, which should also help elucidate the nature of the MM1 subcomponents.
References
- Abraham et al. (1981) Abraham, Z., Cohen, N. L., Opher, R., Raffaelli, J. C., & Zisk, S. H. 1981, A&A, 100, L10
- Audard et al. (2014) Audard, M., Ábrahám, P., Dunham, M. M., et al. 2014, Protostars and Planets VI, 387
- Bally & Zinnecker (2005) Bally, J., & Zinnecker, H. 2005, AJ, 129, 2281
- Beuther et al. (2008) Beuther, H., Walsh, A. J., Thorwirth, S., et al. 2008, A&A, 481, 169
- Beuther et al. (2007) Beuther, H., Walsh, A. J., Thorwirth, S., et al. 2007, A&A, 466, 989
- Bonnell & Bate (2005) Bonnell, I. A., & Bate, M. R. 2005, MNRAS, 362, 915
- Brogan et al. (2016) Brogan, C. L., Hunter, T. R., Cyganowski, C. J., et al. 2016, ApJ, 832, 187
- Brogan et al. (2009) Brogan, C. L., Hunter, T. R., Cyganowski, C. J., et al. 2009, ApJ, 707, 1
- Caratti o Garatti et al. (2017) Caratti o Garatti, A., Stecklum, B., Garcia Lopez, R., et al. 2017, Nature Physics, 13, in press
- Chibueze et al. (2014) Chibueze, J. O., Omodaka, T., Handa, T., et al. 2014, ApJ, 784, 114
- Cyganowski et al. (2007) Cyganowski, C. J., Brogan, C. L., & Hunter, T. R. 2007, AJ, 134, 346
- De Buizer et al. (2002) De Buizer, J. M., Radomski, J. T., Piña, R. K., & Telesco, C. M. 2002, ApJ, 580, 305
- Dodson & Moriarty (2012) Dodson, R., & Moriarty, C. D. 2012, MNRAS, 421, 2395
- Dunham & Vorobyov (2012) Dunham, M. M., & Vorobyov, E. I. 2012, ApJ, 747, 52
- Evans et al. (2009) Evans, N. J., II, Dunham, M. M., Jørgensen, J. K., et al. 2009, ApJS, 181, 321-350
- Forgan et al. (2016) Forgan, D. H., Ilee, J. D., Cyganowski, C. J., Brogan, C. L., & Hunter, T. R. 2016, MNRAS, 463, 957
- Forgan & Rice (2010) Forgan, D., & Rice, K. 2010, MNRAS, 402, 1349
- Goedhart et al. (2004) Goedhart, S., Gaylard, M. J., & van der Walt, D. J. 2004, MNRAS, 355, 553
- Hartmann & Kenyon (1996) Hartmann, L., & Kenyon, S. J. 1996, ARA&A, 34, 207
- Hollenbach et al. (2013) Hollenbach, D., Elitzur, M., & McKee, C. F. 2013, ApJ, 773, 70
- Hunter et al. (2014) Hunter, T. R., Brogan, C. L., Cyganowski, C. J., & Young, K. H. 2014, ApJ, 788, 187
- Hunter et al. (2006) Hunter, T. R., Brogan, C. L., Megeath, S. T., et al., 2006, ApJ, 649, 888
- Johnstone et al. (2013) Johnstone, D., Hendricks, B., Herczeg, G. J., & Bruderer, S. 2013, ApJ, 765, 133
- Kenyon et al. (1990) Kenyon, S. J., Hartmann, L. W., Strom, K. M., & Strom, S. E. 1990, AJ, 99, 869
- Klassen et al. (2016) Klassen, M., Pudritz, R. E., Kuiper, R., Peters, T., & Banerjee, R. 2016, ApJ, 823, 28
- Krishnan et al. (2013) Krishnan, V., Ellingsen, S. P., Voronkov, M. A., & Breen, S. L. 2013, MNRAS, 433, 3346
- Kuiper et al. (2015) Kuiper, R., Yorke, H. W., & Turner, N. J. 2015, ApJ, 800, 86
- Leurini et al. (2006) Leurini, S., Schilke, P., Parise, B., et al., 2006, A&A, 454, L83
- Meyer et al. (2017) Meyer, D. M.-A., Vorobyov, E. I., Kuiper, R., & Kley, W. 2017, MNRAS, 464, L90
- Norris et al. (1988) Norris, R. P., Caswell, J. L., Wellington, K. J., McCutcheon, W. H., & Reynolds, J. E. 1988, Nature, 335, 149
- Norris et al. (1993) Norris, R. P., Whiteoak, J. B., Caswell, J. L., Wieringa, M. H., & Gough, R. G. 1993, ApJ, 412, 222
- O’Dell et al. (2009) O’Dell, C. R., Henney, W. J., Abel, N. P., Ferland, G. J., & Arthur, S. J. 2009, AJ, 137, 367
- Omodaka et al. (1999) Omodaka, T., Maeda, T., Miyoshi, M., et al. 1999, PASJ, 51, 333
- Ott et al. (1994) Ott, M., Witzel, A., Quirrenbach, A., et al. 1994, A&A, 284, 331
- Palau et al. (2013) Palau, A., Fuente, A., Girart, J. M., et al. 2013, ApJ, 762, 120
- Pfalzner et al. (2008) Pfalzner, S., Tackenberg, J., & Steinhausen, M. 2008, A&A, 487, L45
- Pfalzner (2008) Pfalzner, S. 2008, A&A, 492, 735
- Qiu et al. (2011) Qiu, K., Wyrowski, F., Menten, K. M., et al. 2011, ApJ, 743, L25
- Reid et al. (2014) Reid, M. J., Menten, K. M., Brunthaler, A., et al. 2014, ApJ, 783, 130
- Safron et al. (2015) Safron, E. J., Fischer, W. J., Megeath, S. T., et al. 2015, ApJ, 800, L5
- Sánchez-Monge et al. (2014) Sánchez-Monge, Á., Beltrán, M. T., Cesaroni, R., et al. 2014, A&A, 569, A11
- Sandell (2000) Sandell, G. 2000, A&A, 358, 242
- Sandell (1994) Sandell, G. 1994, MNRAS, 271, 75
- Sobolev et al. (1997) Sobolev, A. M., Cragg, D. M., & Godfrey, P. D. 1997, A&A, 324, 211
- Taquet et al. (2016) Taquet, V., Wirström, E. S., & Charnley, S. B. 2016, ApJ, 821, 46
- Tobin et al. (2016) Tobin, J. J., Kratter, K. M., Persson, M. V., et al. 2016, Nature, 538, 483
- Willis et al. (2013) Willis, S., Marengo, M., Allen, L., et al. 2013, ApJ, 778, 96
- Vaidya et al. (2009) Vaidya, B., Fendt, C., & Beuther, H. 2009, ApJ, 702, 567
- Vittone & Errico (2005) Vittone, A. A., & Errico, L. 2005, MmSAI, 76, 320
- Yorke & Bodenheimer (1999) Yorke, H. W., & Bodenheimer, P. 1999, ApJ, 525, 330
- Zernickel et al. (2012) Zernickel, A., Schilke, P., Schmiedeke, A., et al. 2012, A&A, 546, A87
- Zhu et al. (2010) Zhu, Z., Hartmann, L., Gammie, C. F., et al. 2010, ApJ, 713, 1134