Universal Peregrine soliton structure in nonlinear pulse compression in optical fiber.
Abstract
We present experimental evidence of the universal emergence of the Peregrine soliton predicted in the semi-classical (zero-dispersion) limit of the focusing nonlinear Schrödinger equation [Comm. Pure Appl. Math. 66, 678 (2012)]. Experiments studying higher-order soliton propagation in optical fiber use an optical sampling oscilloscope and frequency-resolved optical gating to characterise intensity and phase around the first point of soliton compression and the results show that the properties of the compressed pulse and background pedestal can be interpreted in terms of the Peregrine soliton. Experimental and numerical results reveal that the universal mechanism under study is highly robust and can be observed over a broad range of parameters, and experiments are in very good agreement with numerical simulations.
The focusing nonlinear Schrödinger equation (NLSE) is a fundamental model in nonlinear science that applies to a wide range of physical systems including water waves, plasmas, nonlinear fiber optics and Bose-Einstein condensates Akhmediev and Ankiewicz (1997). There is extensive current interest in the properties of particular NLSE solutions known as solitons on finite background, as they possess characteristics that suggest links with the emergence of rogue waves and extreme events on the ocean and in other environments Kharif and Pelinovsky (2003); Onorato et al. (2013); Dudley et al. (2014). The prototype structure of this kind is the celebrated Peregrine soliton, which was first derived as a rational solution to the NLSE in the context of plane wave modulation instability Peregrine (1983). Exciting the Peregrine soliton in experiments, however, requires careful choice of initial conditions, but a number of experiments have now observed its dynamics in the laboratory - first in nonlinear fiber optics Kibler et al. (2010), and then in hydrodynamics Chabchoub et al. (2011) and plasmas Bailung et al. (2011). These experiments have motivated much theoretical effort to study in detail the properties of the Peregrine soliton and other related NLSE solutions Akhmediev et al. (2013).
It has been widely considered that the Peregrine soliton was uniquely associated with the process of plane wave modulation instability. Recent theoretical studies, however, have shown that it actually appears more generally as a universal structure emerging during intensity localisation of high power pulses in the semi-classical (zero dispersion) limit of the NLSE Bertola and Tovbis (2012). Some evidence for this universality has already been seen in experiments that have characterised Peregrine soliton-like structures emerging during partially coherent nonlinear wave propagation in optical fibers Suret et al. (2016). But all other experimental studies of Peregrine solitons have been restricted only to the regime of plane wave modulation instability.
In a sense, this is surprising, because nonlinear propagation in optical fiber has been studied for decades Taylor (1992); Agrawal (2013). Moreover, high power pulse propagation in the anomalous dispersion regime of optical fiber is a well-known technique to generate pulse narrowing through higher-order soliton compression Mollenauer et al. (1983); Dianov et al. (1986); Agrawal (2001). To our knowledge, however, any possible link between these compression dynamics and the localisation properties of the Peregrine soliton has never been explored.
In this paper, we fill this gap and present a detailed theoretical and experimental study that confirms the appearance of the universal Peregrine soliton structure in nonlinear (N-soliton) pulse compression in an NLSE system. Our experimental results use two different fiber optic based setups, and in one experiment where we use the technique of frequency-resolved optical gating (FROG), we fully characterize intensity and phase of the pulse during its propagation. These results are not only of fundamental interest in showing the universality of the Peregrine soliton in cubic NLSE systems, but they also provide insight into the physical characteristics of nonlinear pulse compression. In particular, nonlinear compression is well known to lead to a central temporally-localised peak sitting upon an extended pedestal Mollenauer et al. (1983), and we are now able to interpret the physical origin of this structure in terms of the Peregrine soliton.
We begin by writing the focussing NLSE as follows:
| (1) |
Here, the envelope is a function of normalized distance and time , and the input pulse is such that as . Note that these initial conditions are fundamentally different to the plane wave used to excite the Peregrine soliton from modulation instability Dudley et al. (2009). The parameter (not necessarily integer) that sets the dimensionless amplitude is well-known in optics as the soliton number Agrawal (2013), but the associated parameter is also used in descriptions of NLSE dynamics, particularly in the semi-classical analysis Bertola and Tovbis (2012).
In terms of fiber parameters and physical distance and time , we have where we define nonlinear length , dispersive length , and . Here and are the fiber nonlinearity and dispersion respectively Agrawal (2013), and the input pulse is characterized by timescale and peak power . The normalised envelope where is the dimensional field (units of ). The parameter couples the fiber parameters and initial conditions. When is an integer, the initial condition represents an exact -soliton solution of the NLSE, which follows the well-known periodic evolution Yang (2010).
Analysis proceeds by writing the in terms of real variables (Madelung transform Madelung (1926)) corresponding to intensity and instantaneous frequency (or chirp) defined through . Assuming a smooth (more precisely, analytic) initial pulse shape and large , we obtain a leading order approximation (nonlinear geometric optics) system:
| (2) |
describing the initial evolution of the pulse as long the derivative is not too large Kamvissis et al. (2003); Tovbis et al. (2004).
It is known from analytical solutions of (2) Akhmanov et al. (1966); Gurevich and Shvartsburg (1970) and numerical studies of the full NLSE (1) Dudley et al. (2006) that nonlinear pulse propagation at high power in the focussing NLSE typically leads to temporal self-compression of the intensity profile resulting, at some , in a gradient catastrophe, the point when the intensity profile has infinite derivative . In the vicinity of this point the geometric optics approximation (2) becomes invalid and the full NLSE must be used. Since is assumed to be large (equivalently, is small) one can take advantage of the semi-classical analysis of the NLSE inverse scattering solution performed in ref. Bertola and Tovbis (2012). One of the key results of ref. Bertola and Tovbis (2012) is that, when (i.e. ) the dynamics near the gradient catastrophe universally lead to the generation of the rational Peregrine soliton as a local asymptotic solution of the NLSE, which at the point of maximum compression assumes the form .
For the case of N-soliton initial data, the background for this local Peregrine soliton was shown in Tovbis et al. (2004) to be given by the field amplitude at the gradient catastrophe point found from solution to (2). Significantly, the appearance of the Peregrine soliton as a universal nonlinear coherent structure locally regularising the gradient catastrophe does not depend on global properties (i.e. on the Zakharov-Shabat spectrum Zakharov and Shabat (1972)) of the NLSE decaying initial condition – it can have high soliton content or even be completely solitonless. Moreover, although this analysis is carried out in the semi-classical () limit of the NLSE (which coincides with the nonlinear geometric optics approximation (2) only for ), as we shall see below from simulations and experiment, the appearance of the Peregrine soliton in the compressed pulse profile is extremely robust and is seen over a very wide range of .
We begin by showing numerical results in Fig. 1 solving Eq. 1 for pulsed initial condition with different . The nonlinear dynamics of high power pulse propagation in the focussing NLSE are well known, leading to a strongly-localised central peak surrounded by a temporally-extended pedestal at a compression distance . The solid black lines in Fig. 1 (a) show the amplitude at , with the black dashed line showing the profile of the input pulse. The discussion above leads us to expect that the profile of the localised compressed peak will follow that of the Peregrine soliton, and indeed the analytic Peregrine soliton (dashed red line) is an excellent fit to simulation over the central region.
To further compare the properties of the compressed pulse and Peregrine soliton, Fig. 1(b) compares the longitudinal evolution with of the amplitude at the centre of the compressed pulse and the centre of the Peregrine soliton. We note close agreement especially in the growth stage, but we remark that the decay stage of the pulsed evolution would be expected to deviate from the Peregrine soliton because of complex splitting dynamics beyond the compression point. The maximum value of the pulse amplitude at the compression point described in Bertola and Tovbis (2012) is denoted , and simulation results plotting as a function of are plotted in Fig. 1(c). Significantly, in the large- limit, the amplitude approaches the asymptotic value of as calculated in Bertola and Tovbis (2012).
To compare in more detail the compressed pulse characteristics with the Peregrine soliton, Fig. 2(a) shows an expanded view of the evolution from Fig. 1 in the vicinity of the compression point. Fig. 2(b) shows the corresponding results for an ideal Peregrine soliton, and we see clearly the close similarity in the both amplitude and phase evolution. The confirmation of the expected phase jump across the zero intensity points separating the “wings” and the central lobe of the Peregrine soliton is particularly striking.
These numerical studies show clearly how Peregrine soliton characteristics appear locally during nonlinear compression of a pulsed initial condition in an NLSE system. We stress again how fundamentally different this is from the emergence of the Peregrine soliton in plane wave modulation instability.
We have confirmed these results experimentally using two different setups injecting high power pulses in optical fiber. Fig. 3 shows a schematic of two setups used. In setup 1, near-Gaussian pulses of ps duration (FWHM) at 1525 nm from a spectrally-filtered optical parametric oscillator (Coherent Chameleon) were injected into 400 m of polarization maintaining fiber (Fibercore PMF). The fiber parameters were and , and with injected pulse peak power of , we estimate for the input pulse (). With the input pulse well-fitted by a Gaussian profile, the parameter Agrawal (2013). Simulations were used to select the input power such that the fibre length corresponded to close to the first compression distance, and the pulse intensity profile was measured using a custom-designed optical sampling oscilloscope (see Walczak et al. (2015) and Supplementary Information). The results obtained in this case are displayed in Fig. 4 where we show the input pulse (green sampled points), the compressed pulse at the fibre output (blue sampled points), numerical simulation results (solid black line) and the ideal theoretical Peregrine soliton (solid red line). Note that there are no free parameters used in the simulations.
These experiments provide clear confirmation that nonlinear pulse compression in optical fiber yields intensity characteristics in good agreement with the Peregrine soliton. To examine the pulse properties in more detail, however, requires complete characterisation of the compressed pulse in both amplitude and phase, and to this end we developed a second experimental setup using second harmonic generation FROG to characterise the nonlinear pulse evolution Trebino (2002); Dudley et al. (1999).
In these experiments, the input pulses from a picosecond fibre laser (Pritel PPL) had duration 1.1 ps (FWHM) at 1550 nm. The pulses were injected with input power W into Ge-doped highly nonlinear optical fiber (HNLF) fiber with and . The input pulses here were was well-fitted by a sech profile such that Agrawal (2013), giving . Numerical simulations for these parameters determined the first point of compression around m. Note that our simulations also included the effect of third order dispersion (), the Raman effect Agrawal (2013) and input pulse asymmetry, but whilst including these effects was found to improve quantitative agreement with experiment (see below), the essential pulse dynamics up to the first compression point remain very well described by an ideal NLSE. Of course, the higher-order effects play a major role beyond the compression point where they lead to supercontinuum broadening that prevents observation of recurrence to the initial state Dudley et al. (2006).
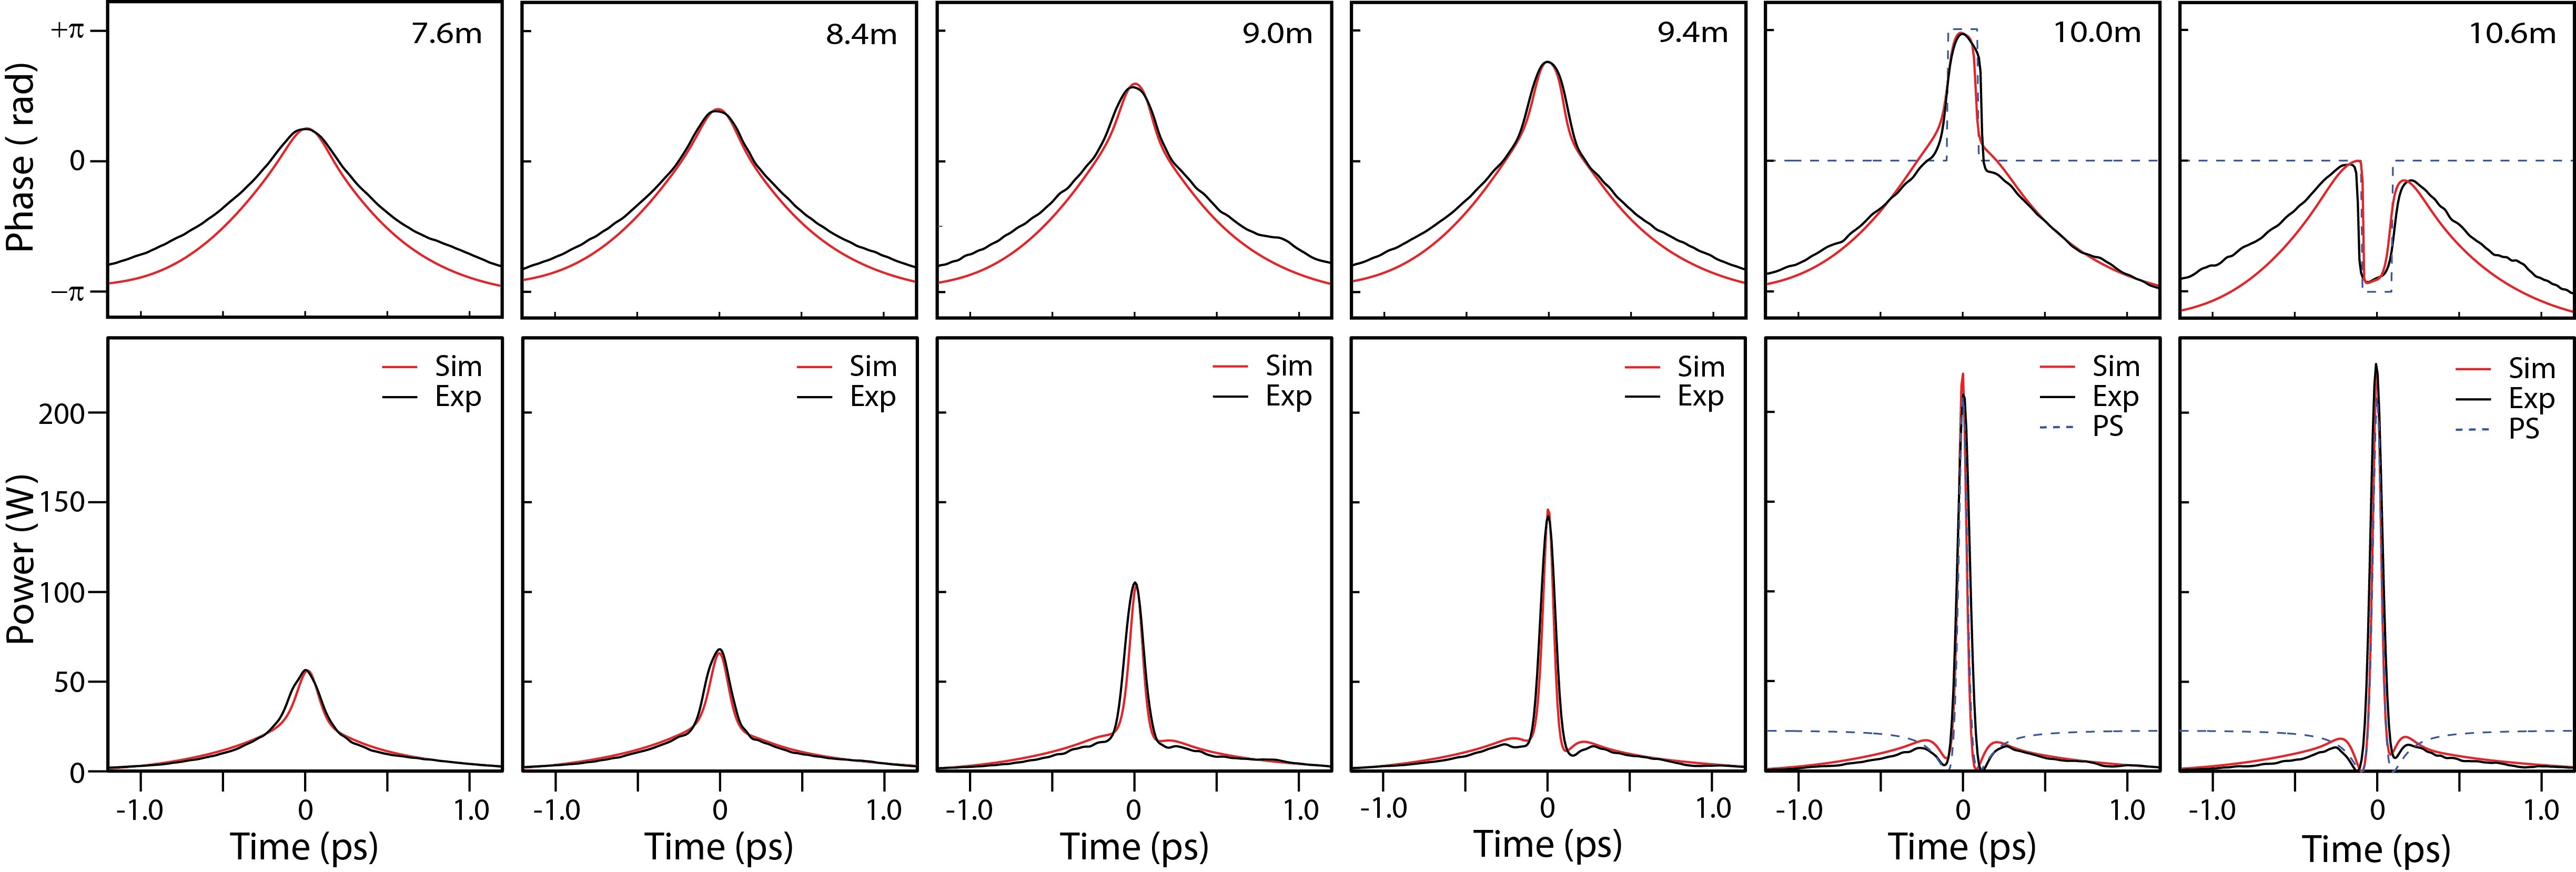
Experiments were first performed at a maximum fiber length of 10.6 m, before the fiber was cut-back progressively. At each fiber length, FROG measurements were made to yield intensity and phase profiles. FROG acquisition was performed on a grid and FROG retrieval errors were typically . Standard checks of the retrieved pulse characteristics involving comparison with independent spectral and autocorrelation measurements were used to check measurement fidelity, and the direction-of-time ambiguity was lifted by an additional FROG measurement of propagation in a length of single mode fiber Trebino (2002).
The results of these experiments are shown in Fig. 5. Here we plot the retrieved intensity (bottom) and phase (top) at the fiber lengths indicated, comparing experiment (black line) with simulations (red line). In all cases, we see excellent agreement between experiment and simulation, and we clearly observe the compression of the central region of the intensity profile and the development of a broader intensity pedestal. The associated phase evolution is dominated by nonlinearity (where the phase profile follows the intensity profile) but as we approach the compression point, we see the development of a central region of phase with steepening edges upon a slower phase variation associated with the intensity pedestal.
Indeed for the results at 10 m and 10.6 m, we also plot the intensity and phase profile of an ideal Peregrine soliton solution, and there is excellent agreement with experiment and simulation across the pulse center. Of course, one difference is that the Peregrine soliton background extends to whereas the pedestal observed in experiments is limited by the temporal width of the input pulse. This highlights how the emergence of the Peregrine soliton here is a local dynamical mechanism. The qualitative and quantitative agreement is clear, and in particular, as observed in numerical simulations of Fig. 2, the phase jump occurring at zero intensity between the central lobe and the pedestal is a striking signature of the Peregrine soliton. Note finally, that the change of the sign of the phase derivative across the maximum compression point which is also a characteristic of the analytic Peregrine soliton solution at the center of the pulse, is clearly observed in the experiments between 10 m and 10.6 m in Fig. 5. Remarkably, this property of the Peregrine soliton is also consistent with the generic change of sign of the phase derivative across the gradient catastrophe point Gurevich and Shvartsburg (1970).
These results are very significant from both basic and applied viewpoints. From a fundamental perspective, our simulations and experiments confirm the predictions of Ref. Bertola and Tovbis (2012) in showing how the regularization of the gradient catastrophe in the semiclassical NLSE leads to the emergence of the Peregrine soliton. Specifically, in addition to its appearance in the development of plane wave modulational instability, we see how the Peregrine soliton also arises as the compressed pulse shape associated with high power nonlinear pulse propagation in the NLSE. Our results reveal that this phenomenon arises over a very broad range of parameters : we locally observe the Peregrine soliton in the nonlinear regime of propagation as long as . For the particular system of nonlinear fiber optics, our results provide a clear physical interpretation to the longstanding observation that soliton-effect compression is necessarily associated with a broader pedestal, often considered deleterious for many applications. Although techniques do exist which can reduce or suppress this pedestal to some degree Agrawal (2001), our results suggest that – at least for nonlinear N-soliton compression scenarios described by the NLSE - its presence is inevitable. Finally, we anticipate application of these results in studies of extreme events and rogue waves in integrable turbulence Walczak et al. (2015); Soto-Crespo et al. (2016); Suret et al. (2016); Randoux et al. (2016) where the problem of nonlinear localisation mechanisms remains a challenging open problem.
Acknowledgements.
This work was supported by the European Research Council Advanced Grant ERC-2011-AdG-290562 MULTIWAVE and Proof of Concept Grant ERC-2013-PoC 632198-WAVEMEASUREMENT, the European Union Horizon 2020 research and innovation programme under grant agreement No 722380 SUPUVIR, the Agence Nationale de la Recherche (ANR OPTIROC ANR-12-BS04-0011, LABEX CEMPI ANR-11-LABX-0007 and ACTION ANR-11-LABX-0001-01), the Region of Franche-Comté Project CORPS, the French Ministry of Higher Education and Research, the Nord-Pas de Calais Regional Council and European Regional Development Fund (ERDF) through the Contrat de Projets Etat-Région (CPER Photonics for Society P4S). G. G. acknowledges the support from the Academy of Finland (Grants 267576 and 298463).References
- Akhmediev and Ankiewicz (1997) N. N. Akhmediev and A. Ankiewicz, Solitons: Nonlinear Pulses and Beams (Chapman & Hall, 1997).
- Kharif and Pelinovsky (2003) C. Kharif and E. Pelinovsky, European Journal of Mechanics-B/Fluids 22, 603 (2003).
- Onorato et al. (2013) M. Onorato, S. Residori, U. Bortolozzo, A. Montina, and F. T. Arecchi, Physics Reports 528, 47 (2013).
- Dudley et al. (2014) J. M. Dudley, F. Dias, M. Erkintalo, and G. Genty, Nature Photonics 8, 755 (2014).
- Peregrine (1983) D. H. Peregrine, The Journal of the Australian Mathematical Society. Series B. Applied Mathematics 25, 16 (1983).
- Kibler et al. (2010) B. Kibler, J. Fatome, C. Finot, G. Millot, F. Dias, G. Genty, N. Akhmediev, and J. M. Dudley, Nature Physics 6, 790 (2010).
- Chabchoub et al. (2011) A. Chabchoub, N. Hoffmann, and N. Akhmediev, Physical Review Letters 106, 204502 (2011).
- Bailung et al. (2011) H. Bailung, S. K. Sharma, and Y. Nakamura, Phys. Rev. Lett. 107, 255005 (2011).
- Akhmediev et al. (2013) N. Akhmediev, J. M. Dudley, D. R. Solli, and S. K. Turitsyn, Journal of Optics 15 (2013), 10.1088/2040-8978/15/6/060201.
- Bertola and Tovbis (2012) M. Bertola and A. Tovbis, Communications on Pure and Applied Mathematics 66, 678 (2012).
- Suret et al. (2016) P. Suret, R. El Koussaifi, A. Tikan, C. Evain, S. Randoux, C. Szwaj, and S. Bielawski, Nat. Commun. 7, 13136 (2016).
- Taylor (1992) J. R. Taylor, ed., Optical Solitons Theory and Experiment (Cambridge University Press, 1992).
- Agrawal (2013) G. P. Agrawal, Nonlinear Fiber Optics (Academic Press, 2013).
- Mollenauer et al. (1983) L. F. Mollenauer, W. J. Tomlinson, R. H. Stolen, and J. P. Gordon, Opt. Lett. 8, 289 (1983).
- Dianov et al. (1986) E. M. Dianov, Z. S. Nikonova, A. M. Prokhorov, and V. N. Serkin, Sov. Tech. Phys. Lett. 12, 311 (1986).
- Agrawal (2001) G. P. Agrawal, Applications of Nonlinear Fiber Optics (Academic Press, 2001).
- Dudley et al. (2009) J. M. Dudley, G. Genty, F. Dias, B. Kibler, and N. Akhmediev, Optics Express 17, 21497 (2009).
- Yang (2010) J. Yang, Nonlinear waves in integrable and nonintegrable systems, Vol. 16 (SIAM, 2010).
- Madelung (1926) E. Madelung, Naturwissenschaften 14, 1004 (1926).
- Kamvissis et al. (2003) S. Kamvissis, K. D. T.-R. McLaughlin, and P. D. Miller, Semiclassical soliton ensembles for the focusing nonlinear Schrödinger equation.Kamvissis, Annals of Mathematics Studies, Vol. AM-154 (Princeton University Press, 2003).
- Tovbis et al. (2004) A. Tovbis, S. Venakides, and X. Zhou, Comm. Pure Appl. Math 57, 877 (2004).
- Akhmanov et al. (1966) S. Akhmanov, A. Sukhorukov, and R. Khokhlov, Sov. Phys. JETP 23, 1025 (1966).
- Gurevich and Shvartsburg (1970) A. Gurevich and A. Shvartsburg, Sov. Phys. JETP 31, 1084 (1970).
- Dudley et al. (2006) J. M. Dudley, G. Genty, and S. Coen, Reviews of Modern Physics 78, 1135 (2006).
- Zakharov and Shabat (1972) V. Zakharov and A. B. Shabat, Sov. Phys. JETP 34, 62 (1972).
- Walczak et al. (2015) P. Walczak, S. Randoux, and P. Suret, Phys. Rev. Lett. 114, 143903 (2015).
- Trebino (2002) R. Trebino, Frequency-Resolved Optical Gating: The Measurement of Ultrashort Laser Pulses (Springer, 2002).
- Dudley et al. (1999) J. M. Dudley, L. P. Barry, J. D. Harvey, M. D. Thomson, B. C. Thomsen, P. G. Bollond, and R. Leonhardt, IEEE Journal of Quantum Electronics 35, 441 (1999).
- Soto-Crespo et al. (2016) J. M. Soto-Crespo, N. Devine, and N. Akhmediev, Phys. Rev. Lett. 116, 103901 (2016).
- Randoux et al. (2016) S. Randoux, P. Suret, and G. El, Sci. Rep. 6, 29238 (2016).